US Crop Production
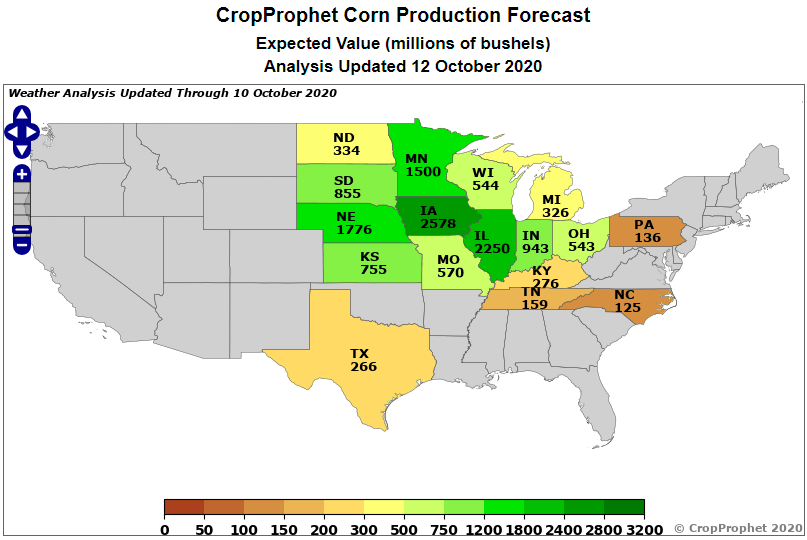
Understanding total US crop production is important for creating opportunities in grain futures trading. Prices in the agricultural futures market vary based on grain supply and demand perceptions. For example, changes in Mississippi River gage heights impact grain transportation and supply logistics. Having access to daily updated, weather-driven crop supply forecasts, such as those provided by CropProphet, that are materially ahead of market perceptions creates opportunities for profitable futures trades and improved risk management.
Total grain production in any year is equal to the number of acres harvested multiplied by the crop’s average yield. This is stated in equation form as:

This equation, along with the key equation for grain yield modeling, forms the mathematical backbone of CropProphet.
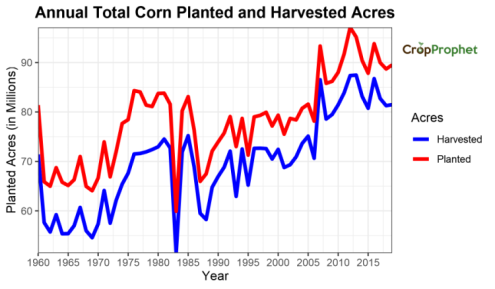
US Crop Production: Planted vs. Harvested Acres
Crop production variations from year to year across any region are caused by variations in harvested acres, the average yield, or both. Weather conditions during the crop season also cause variations in year-to-year crop yield.
The agriculture futures market closely tracks the number of planted acres early each crop season and the number of harvested acres by the end of the crop season along with the USDA crop condition report. Both harvested and planted acres are important because the USDA NASS publishes both statistics at the end of each season.
The USDA end-of-season estimated yield is based on harvested acres (see table below). However, the end-of-season production estimate is relative to yield per planted acres, making that statistic also important to track.
Weather events, such as droughts, usually are a factor that contributes to the difference between planted and harvested acres in any year during the crop season. The August 2020 Iowa derecho event is a great example of severe weather risk impacting the number of harvested corn acres.
CropProphet provides corn, soybean, and winter wheat production and yield forecasts. This is possible because crop season weather conditions are the primary cause of year-to-year variations in yield.
US Crop Production: Tracking the Data
The US Department of Agriculture National Agriculture Statistics Service (NASS) releases yearly agricultural statistics. CropProphet uses the history of this data to create its daily, updated weather-based crop yield and production forecasts. The table provides access to blog posts documenting the annual ranks by year for state corn, soybean, and winter wheat production, yield, and planted and harvested acres.
State Production, Yield Per Acre, Planted, and Harvested Acre Rankings by State
| Data Type | Corn | Soybean | Winter Wheat |
|---|---|---|---|
| Production | Production | Production | Production |
| Yield | Yield per Acre | Yield per Acre | Yield per Acre |
| Planted Acres | Planted Acres | Planted Acres | Planted Acres |
| Harvested Acres | Harvested Acres | Harvested Acres | Harvested Acres |
Request your risk-free trial of CropProphet today.

You can also review the highest-producing corn and soybean counties. We also answer the questions, “What state produces the most corn?” and “What state produces the most soybeans?”
We are releasing corn and soybean yield forecasts for Argentina.