Corn Yield Forecast: The fundamentals
Creating a corn yield forecast involves understanding what drives corn’s growth from year to year, finding the necessary data to create a relevant statistical model, and then using machine learning techniques to find the relationship between the important factors of crop growth.
CropProphet is a corn, soybean, and winter wheat forecasting system that uses weather data to predict yield in bushels per acre and total crop production. While this discussion focuses on creating a corn yield forecast, the method is the same for the other crops as well. Having access to a crop yield forecast system is critical to understanding changes in US crop production.
The trading and grains markets focus on yields because, as discussed below, they are fundamentally impacted by the growing season weather. Crop production, which can be calculated as a yield * the number of planted acres, varies year-to-year based on weather. Market perceptions of total corn production can impact market prices, such as the July corn futures price. Trading opportunities, such as systematic grain trading, are created because CropProphet is more accurate than market perceptions and captures changes in the likely trend before other participants.
Crop production can also change based on the planting decisions of producers. Crop yields are, therefore, a relatively easy metric to follow and is an easy proxy for crop production. The market perceptions of the likely annual crop supply are a primary factor causing corn and soybean futures prices to change.
2023 Corn Yield Review
The 2023 USDA corn yield final estimates were released in January 2024. We reviewed the weather conditions during 2023 and their impact on the US corn crop.
Corn Yield Forecast: The Model
To create a corn yield forecast at the national level we use a simple conceptual model:The US national corn yield can therefore be considered as the combination of
- Technology Yield Trend +
- Weather during the crop season+
- The error remaining after creating the model.

Where is corn grown?
Modeling corn yield requires a long history of corn yield data. Historical corn yield and production data are provided by the USDA NASS. The final national yield estimates for each growing season are reported by the USDA NASS in January of the following year. For example, the 2019 US national corn yield estimate was released in January of 2020. This data is forms the basis for modeling corn yields.
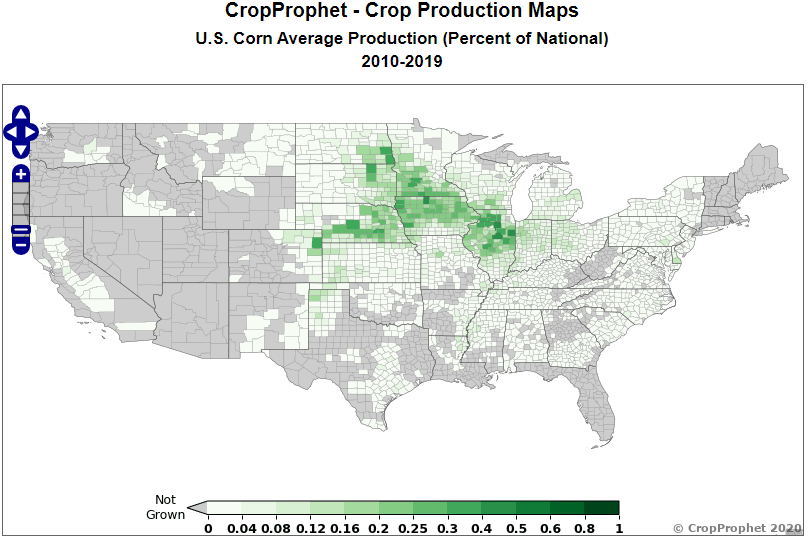
The regions of the United States that grow corn are shown below. The regions with darker green shading depict counties that grow more corn relative to its contribution to national production. While the counties in green, indicating the greatest contribution to national production, do not have necessarily all have the highest yields in the country, they do have relatively large harvested acreage. This predominantly corn area is called the “Corn Belt,” because it has the highest corn yield potential.
Technology Trend
For application to corn yield forecasting, the technology yield trend is created by all factors increasing the average yield per harvested acre for corn in the United States from year to year. This includes all of the seed, fertilizer, machinery, management technology that has been developed to improve yields.
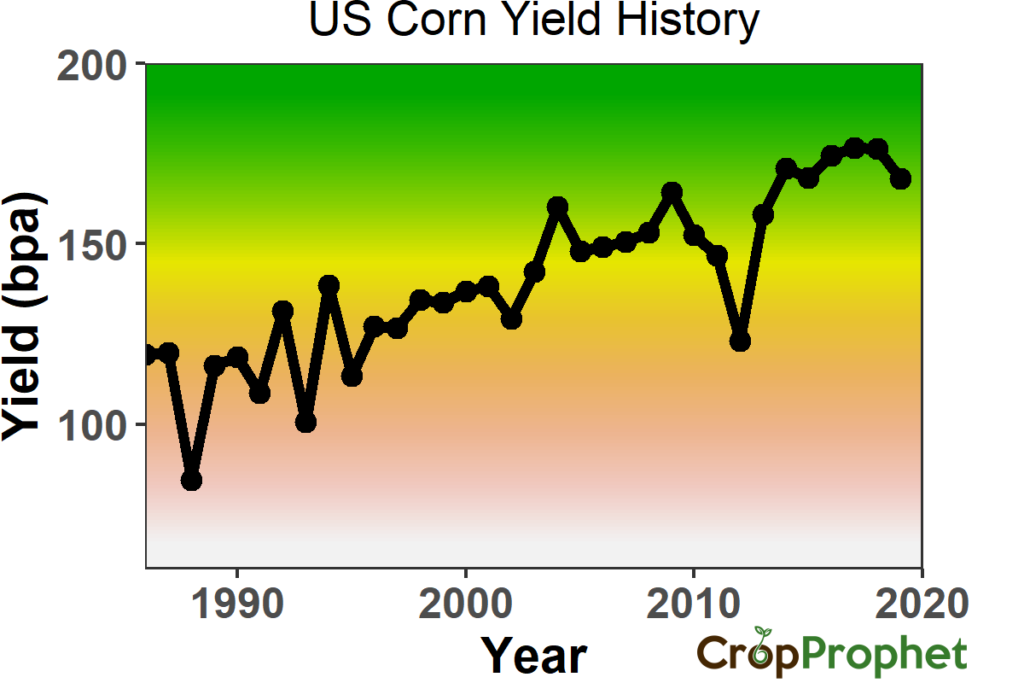
The collective result is the technology trend, which is the upward sloping yield in the graphic below. The technology trend, which increases the average yield each year, helps to create the baseline corn yield potential to start forecasting each year.
Corn Yield Forecast: Weather
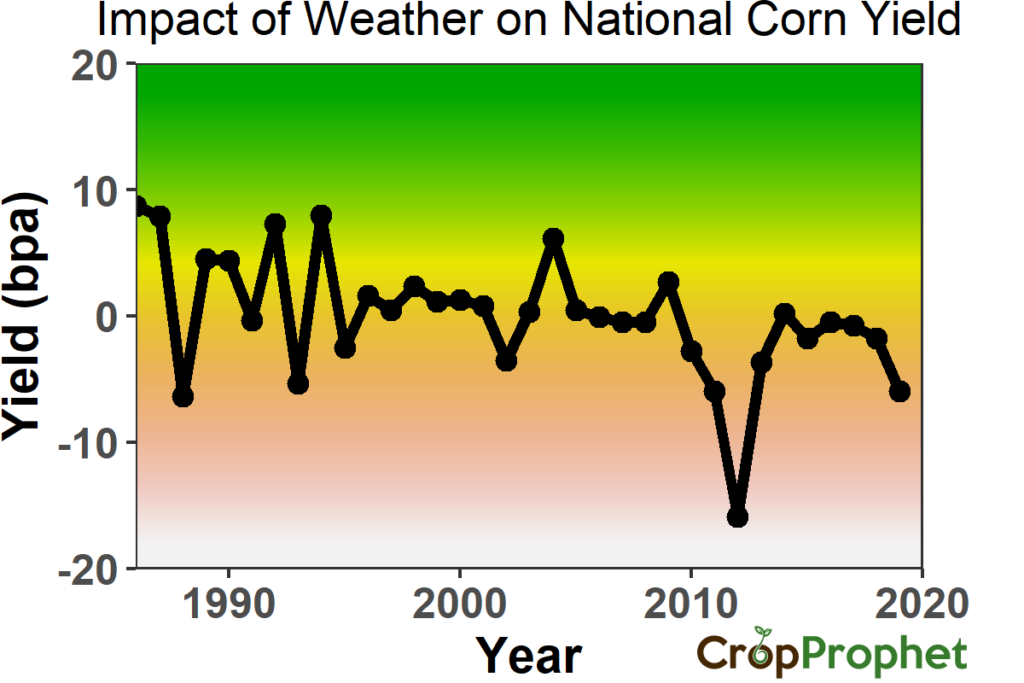
The technology trend can be estimated from the corn yield history data. Doing so removes the isolates the role of the technology trend relative to yield variations. The information that remains, based on the model stated above, is the variations in corn yield due to the impact of weather conditions such as temperature, precipitation, and soil moisture.
The technology trend estimation for this blog post is measured as the simple linear trend of corn data above over time. For implementation in CropProphet, however, we use a much more sophisticated method to estimate the technology trend.
Using techniques associated with Big Data analytics and machine learning, it’s possible to model the impact of weather on the end-of-season yields. The process used for CropProphet seeks to find the optimal relationship between weather and corn in regions smaller than states.
The national yield forecast is then created by production weighting the smaller regions yield forecasts. CropProphet uses weather data sets developed from 3rd party sources of weather information. The weather data is used to model the USDA NASS end-of-season reported corn, soybean, and winter wheat yields.
Corn Yield Forecast: Example from 2012
Many people remember the summer of 2012, which was an extremely warm and dry year across much of the central United States. 2012 creates an excellent test case for to evaluate the performance of a yield forecasting model. Watch the animation below to see how the 2012 season evolved.
Yield Prediction: Soybeans
The same basic methodology applies to forecasting soybean yield and soybean production as well as winter wheat yield and production. Certain periods during the summer crop season are different relative to corn and soybeans, but the model training process successfully determines the differences.
Impact of Weather Forecast Models
CropProphet provides weather forecast information from the ECMWF, GFS, and CFS forecast models.
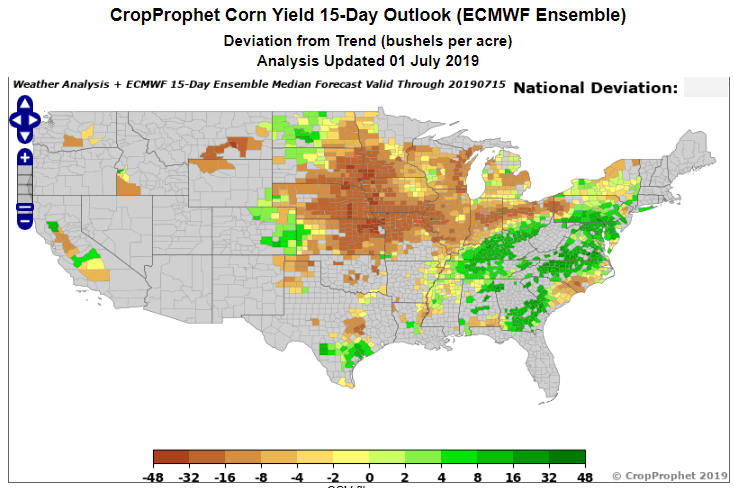
But it’s difficult to know the impact that any single weather forecast may have on a crop during the growing season. To address this problem, CropProphet also converts the weather forecast information into an analysis of the impact on the crop yield forecast. This provides an advantage of being ahead of the market expectations of crop production and therefore in the corn or soybean futures market.
An example of an ECMWF weather forecast model is provided below.
The resulting product is a sophisticated corn yield forecast model that can be used to gain an advantage in corn futures and soybean futures market trading.
Corn Yield Forecast: Application to the GFS 12Z Operational Forecast
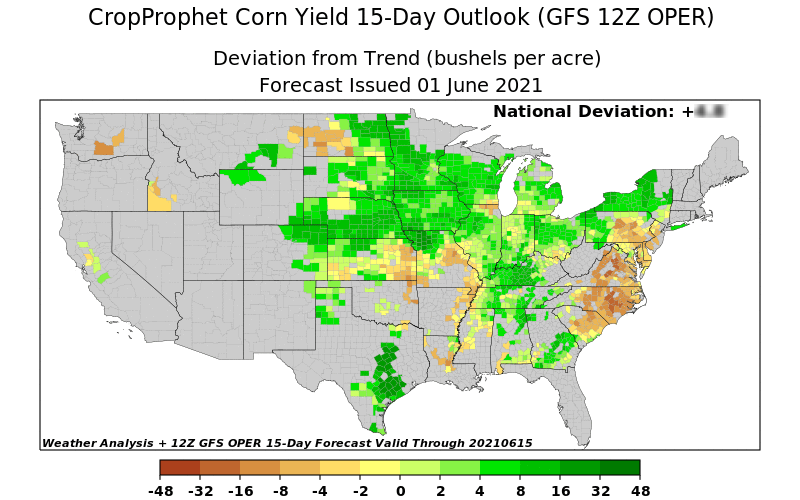
Once the weather-driven crop model is in place, it can be applied to weather forecasts as well. For example, we recently released a daily email service that calculates the impact of the 12Z GFS operational weather forecast on the yield forecast. This particular weather forecast, which is released by NOAA around 11 AM CT each day, can induce market volatility if it changes substantially from the previous forecast released 12 hours before. An example is shown below. Grain traders use this information to maximize the value of daily grain futures volatility.
Request your trial of CropProphet today.

