CropProphet provides weather-based soybean (and corn) yield and production forecasts. Our crop yield and production forecast model is based on county-level data and analysis but we focus on providing the most accurate possible national-level forecast of corn and soybean production. We are often asked, “What counties produce the most soybeans?”
In other words, we help grain traders, grain merchandisers, and discretionary and systematic commodity traders manage weather risk by quantifying the impact of weather on grain crops. A wide range of grain commodity traders seize grain market trading opportunities using CropProphet by knowing the differences between market perceptions of corn production and our accurate forecast. As the market perception corrects towards the CropProphet forecasts corn prices change. Our customers have an information advantage in the grain market.
Knowing the impact of weather on national grain yield is hard. We make it easy.
Discover the benefits of CropProphet now.
The information below provides the top soybean-producing counties for each year from 2000-2020. You can also view soybean production rankings by state or an overview of understanding US crop production.

What is the #1 soybean producing county in the United States?
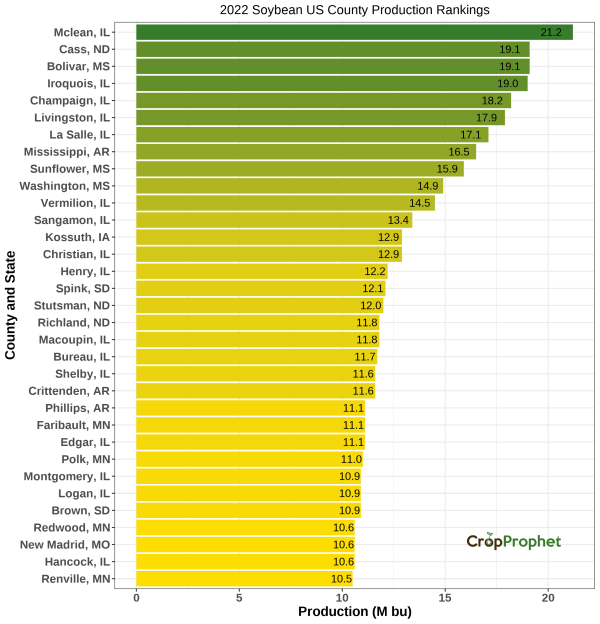
McLean County, Illinois is the top soybean producing county in the United States. As shown below, McLean county produced 71 million bushels of soybeans in 2022. It also happens to be the top corn producing county in the United States as well.
Soybean Production by County: Top 33 of 2022
The top 33 soybeans-producing counties (and their total production) of 2022 was:
| County Production Rankings: 2022 | ||
| Rank | County, State | Production (M bu) |
|---|---|---|
| 1 | Mclean, IL | 21.2 |
| 2 | Bolivar, MS | 19.1 |
| 2 | Cass, ND | 19.1 |
| 3 | Iroquois, IL | 19.0 |
| 4 | Champaign, IL | 18.2 |
| 5 | Livingston, IL | 17.9 |
| 6 | La Salle, IL | 17.1 |
| 7 | Mississippi, AR | 16.5 |
| 8 | Sunflower, MS | 15.9 |
| 9 | Washington, MS | 14.9 |
| 10 | Vermilion, IL | 14.5 |
| 11 | Sangamon, IL | 13.4 |
| 12 | Kossuth, IA | 12.9 |
| 12 | Christian, IL | 12.9 |
| 13 | Henry, IL | 12.2 |
| 14 | Spink, SD | 12.1 |
| 15 | Stutsman, ND | 12.0 |
| 16 | Macoupin, IL | 11.8 |
| 16 | Richland, ND | 11.8 |
| 17 | Bureau, IL | 11.7 |
| 18 | Shelby, IL | 11.6 |
| 18 | Crittenden, AR | 11.6 |
| 19 | Edgar, IL | 11.1 |
| 19 | Phillips, AR | 11.1 |
| 19 | Faribault, MN | 11.1 |
| 20 | Polk, MN | 11.0 |
| 21 | Logan, IL | 10.9 |
| 21 | Montgomery, IL | 10.9 |
| 21 | Brown, SD | 10.9 |
| 22 | Hancock, IL | 10.6 |
| 22 | New Madrid, MO | 10.6 |
| 22 | Redwood, MN | 10.6 |
| 23 | Renville, MN | 10.5 |
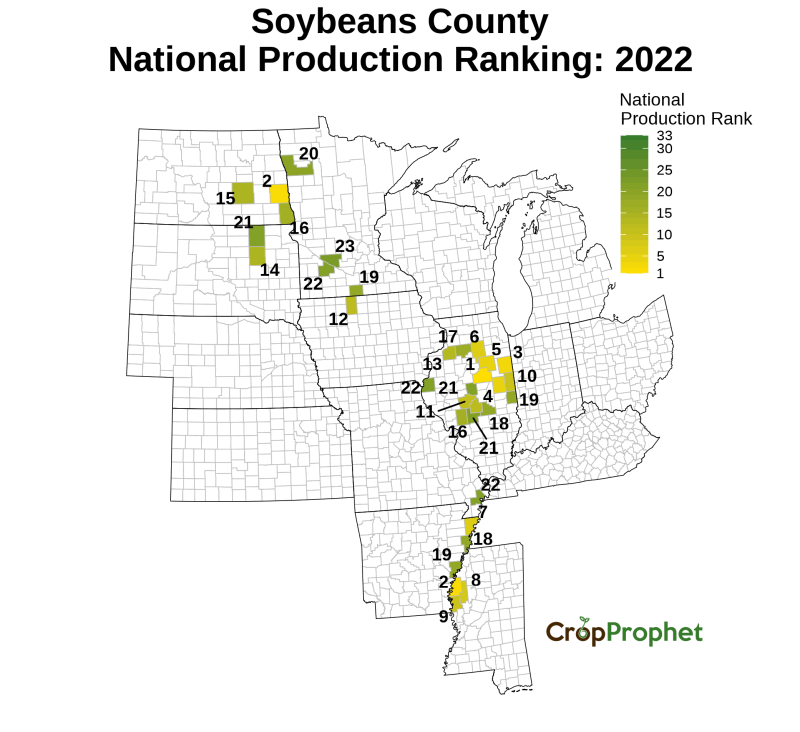
County Soybean Production – 2022
County Soybean County National Production Ranking – 2022
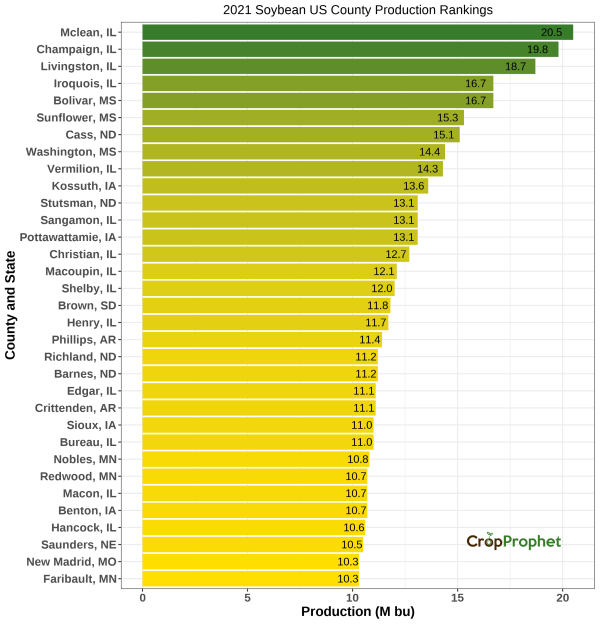
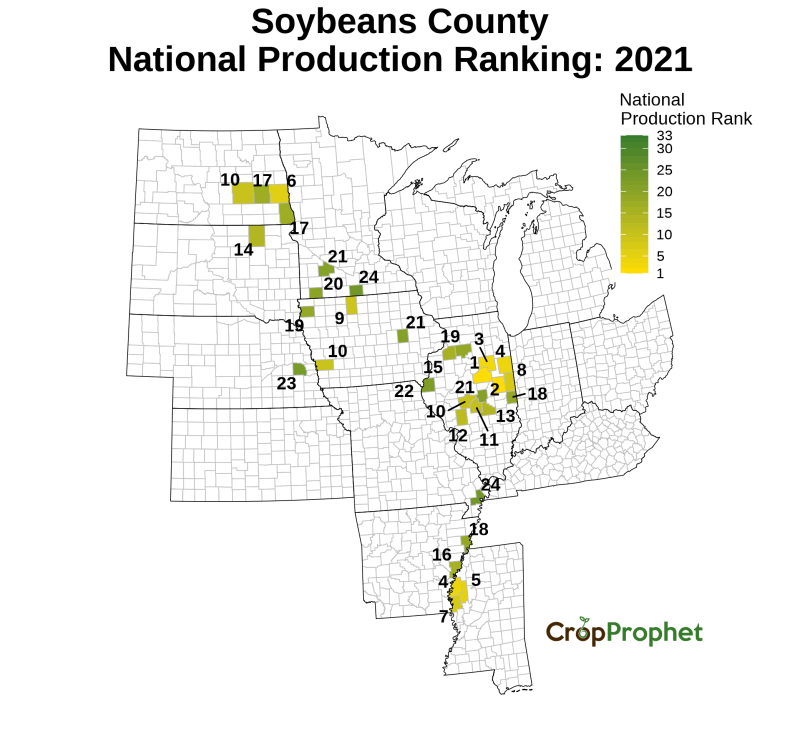
Soybean Production by County: Top 33 of 2021
The top 33 soybeans-producing counties (and their total production) of 2021 was:
| County Production Rankings: 2021 | ||
| Rank | County, State | Production (M bu) |
|---|---|---|
| 1 | Mclean, IL | 20.5 |
| 2 | Champaign, IL | 19.8 |
| 3 | Livingston, IL | 18.7 |
| 4 | Bolivar, MS | 16.7 |
| 4 | Iroquois, IL | 16.7 |
| 5 | Sunflower, MS | 15.3 |
| 6 | Cass, ND | 15.1 |
| 7 | Washington, MS | 14.4 |
| 8 | Vermilion, IL | 14.3 |
| 9 | Kossuth, IA | 13.6 |
| 10 | Stutsman, ND | 13.1 |
| 10 | Sangamon, IL | 13.1 |
| 10 | Pottawattamie, IA | 13.1 |
| 11 | Christian, IL | 12.7 |
| 12 | Macoupin, IL | 12.1 |
| 13 | Shelby, IL | 12.0 |
| 14 | Brown, SD | 11.8 |
| 15 | Henry, IL | 11.7 |
| 16 | Phillips, AR | 11.4 |
| 17 | Barnes, ND | 11.2 |
| 17 | Richland, ND | 11.2 |
| 18 | Edgar, IL | 11.1 |
| 18 | Crittenden, AR | 11.1 |
| 19 | Sioux, IA | 11.0 |
| 19 | Bureau, IL | 11.0 |
| 20 | Nobles, MN | 10.8 |
| 21 | Macon, IL | 10.7 |
| 21 | Redwood, MN | 10.7 |
| 21 | Benton, IA | 10.7 |
| 22 | Hancock, IL | 10.6 |
| 23 | Saunders, NE | 10.5 |
| 24 | Faribault, MN | 10.3 |
| 24 | New Madrid, MO | 10.3 |
County Soybean Production – 2021
County Soybean County National Production Ranking – 2021
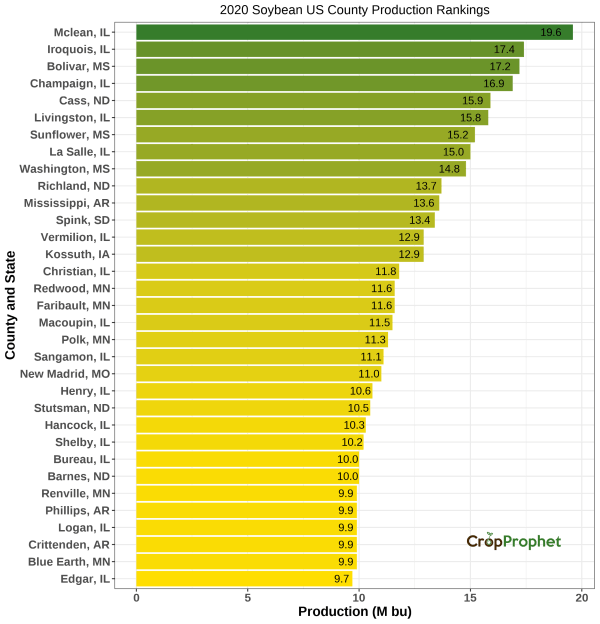
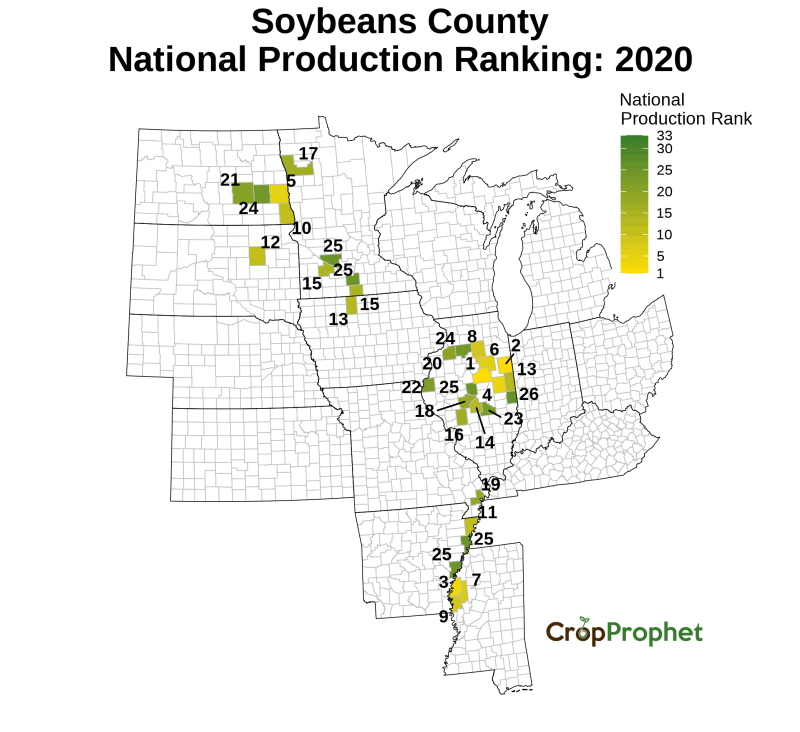
Soybean Production by County: Top 33 of 2020
The top 33 soybeans-producing counties (and their total production) of 2020 was:
| County Production Rankings: 2020 | ||
| Rank | County, State | Production (M bu) |
|---|---|---|
| 1 | Mclean, IL | 19.6 |
| 2 | Iroquois, IL | 17.4 |
| 3 | Bolivar, MS | 17.2 |
| 4 | Champaign, IL | 16.9 |
| 5 | Cass, ND | 15.9 |
| 6 | Livingston, IL | 15.8 |
| 7 | Sunflower, MS | 15.2 |
| 8 | La Salle, IL | 15.0 |
| 9 | Washington, MS | 14.8 |
| 10 | Richland, ND | 13.7 |
| 11 | Mississippi, AR | 13.6 |
| 12 | Spink, SD | 13.4 |
| 13 | Vermilion, IL | 12.9 |
| 13 | Kossuth, IA | 12.9 |
| 14 | Christian, IL | 11.8 |
| 15 | Faribault, MN | 11.6 |
| 15 | Redwood, MN | 11.6 |
| 16 | Macoupin, IL | 11.5 |
| 17 | Polk, MN | 11.3 |
| 18 | Sangamon, IL | 11.1 |
| 19 | New Madrid, MO | 11.0 |
| 20 | Henry, IL | 10.6 |
| 21 | Stutsman, ND | 10.5 |
| 22 | Hancock, IL | 10.3 |
| 23 | Shelby, IL | 10.2 |
| 24 | Barnes, ND | 10.0 |
| 24 | Bureau, IL | 10.0 |
| 25 | Renville, MN | 9.9 |
| 25 | Phillips, AR | 9.9 |
| 25 | Logan, IL | 9.9 |
| 25 | Crittenden, AR | 9.9 |
| 25 | Blue Earth, MN | 9.9 |
| 26 | Edgar, IL | 9.7 |
County Soybean Production – 2020
County Soybean County National Production Ranking – 2020
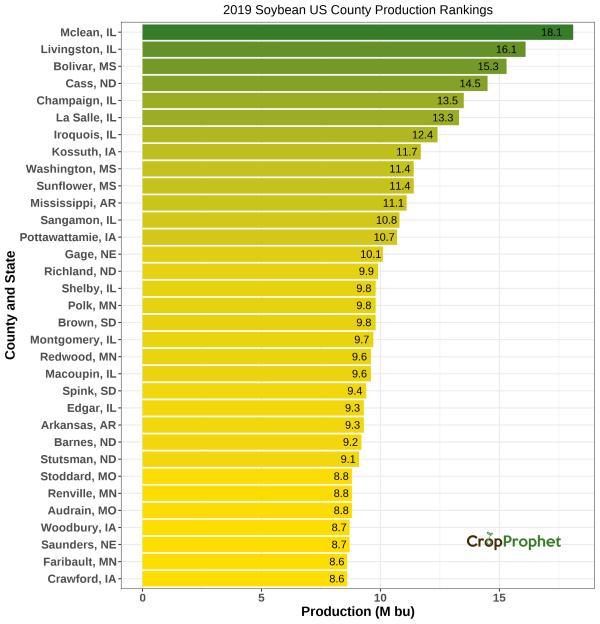
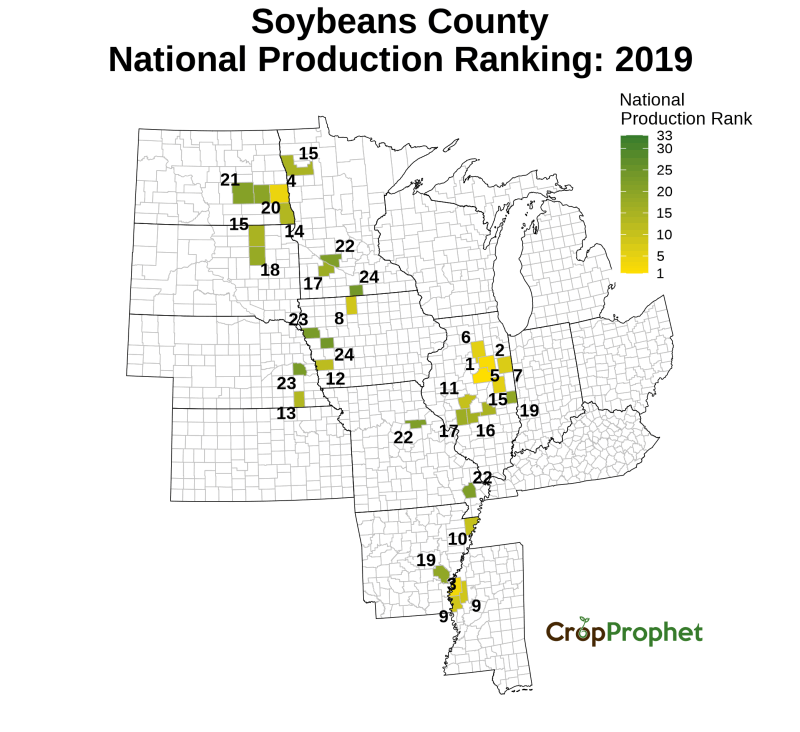
Soybean Production by County: Top 33 of 2019
The top 33 soybeans-producing counties (and their total production) of 2019 was:
| County Production Rankings: 2019 | ||
| Rank | County, State | Production (M bu) |
|---|---|---|
| 1 | Mclean, IL | 18.1 |
| 2 | Livingston, IL | 16.1 |
| 3 | Bolivar, MS | 15.3 |
| 4 | Cass, ND | 14.5 |
| 5 | Champaign, IL | 13.5 |
| 6 | La Salle, IL | 13.3 |
| 7 | Iroquois, IL | 12.4 |
| 8 | Kossuth, IA | 11.7 |
| 9 | Washington, MS | 11.4 |
| 9 | Sunflower, MS | 11.4 |
| 10 | Mississippi, AR | 11.1 |
| 11 | Sangamon, IL | 10.8 |
| 12 | Pottawattamie, IA | 10.7 |
| 13 | Gage, NE | 10.1 |
| 14 | Richland, ND | 9.9 |
| 15 | Shelby, IL | 9.8 |
| 15 | Polk, MN | 9.8 |
| 15 | Brown, SD | 9.8 |
| 16 | Montgomery, IL | 9.7 |
| 17 | Redwood, MN | 9.6 |
| 17 | Macoupin, IL | 9.6 |
| 18 | Spink, SD | 9.4 |
| 19 | Edgar, IL | 9.3 |
| 19 | Arkansas, AR | 9.3 |
| 20 | Barnes, ND | 9.2 |
| 21 | Stutsman, ND | 9.1 |
| 22 | Stoddard, MO | 8.8 |
| 22 | Renville, MN | 8.8 |
| 22 | Audrain, MO | 8.8 |
| 23 | Saunders, NE | 8.7 |
| 23 | Woodbury, IA | 8.7 |
| 24 | Crawford, IA | 8.6 |
| 24 | Faribault, MN | 8.6 |
County Soybean Production – 2019
County Soybean County National Production Ranking – 2019
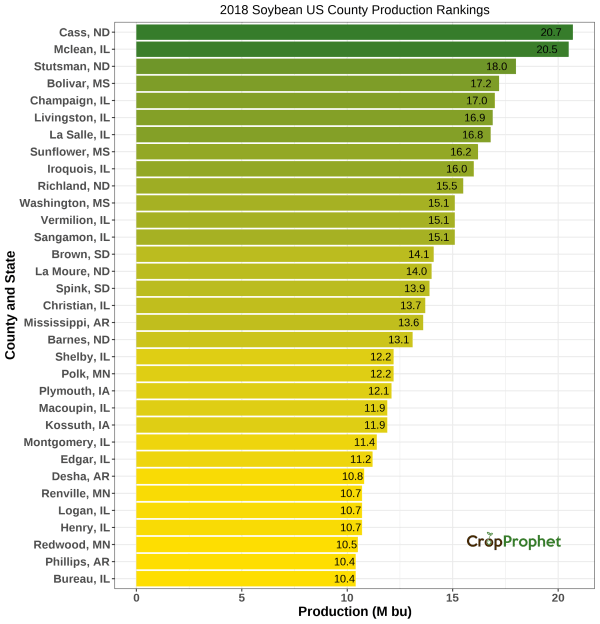
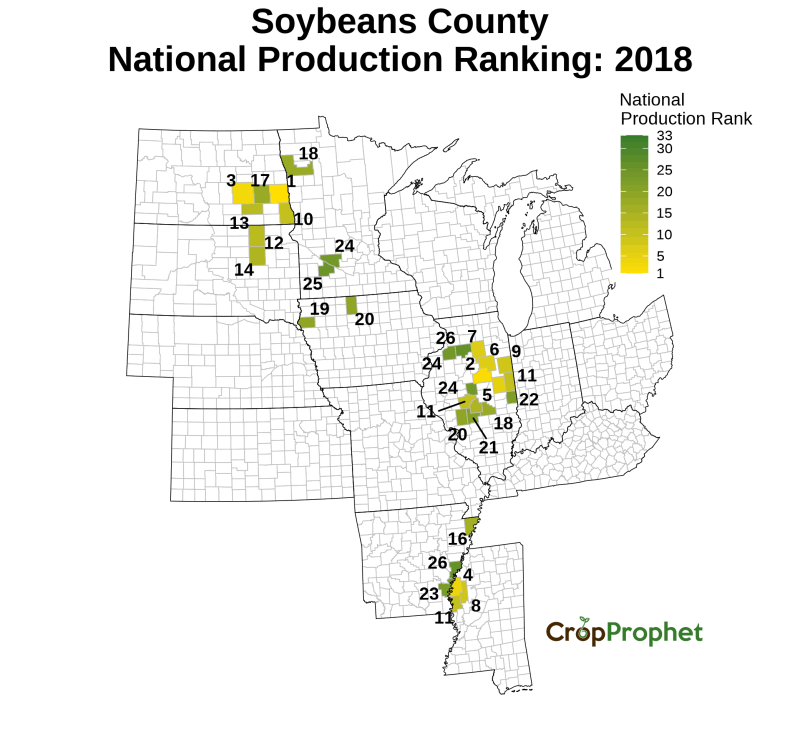
Soybean Production by County: Top 33 of 2018
The top 33 soybeans-producing counties (and their total production) of 2018 was:
| County Production Rankings: 2018 | ||
| Rank | County, State | Production (M bu) |
|---|---|---|
| 1 | Cass, ND | 20.7 |
| 2 | Mclean, IL | 20.5 |
| 3 | Stutsman, ND | 18.0 |
| 4 | Bolivar, MS | 17.2 |
| 5 | Champaign, IL | 17.0 |
| 6 | Livingston, IL | 16.9 |
| 7 | La Salle, IL | 16.8 |
| 8 | Sunflower, MS | 16.2 |
| 9 | Iroquois, IL | 16.0 |
| 10 | Richland, ND | 15.5 |
| 11 | Vermilion, IL | 15.1 |
| 11 | Washington, MS | 15.1 |
| 11 | Sangamon, IL | 15.1 |
| 12 | Brown, SD | 14.1 |
| 13 | La Moure, ND | 14.0 |
| 14 | Spink, SD | 13.9 |
| 15 | Christian, IL | 13.7 |
| 16 | Mississippi, AR | 13.6 |
| 17 | Barnes, ND | 13.1 |
| 18 | Shelby, IL | 12.2 |
| 18 | Polk, MN | 12.2 |
| 19 | Plymouth, IA | 12.1 |
| 20 | Macoupin, IL | 11.9 |
| 20 | Kossuth, IA | 11.9 |
| 21 | Montgomery, IL | 11.4 |
| 22 | Edgar, IL | 11.2 |
| 23 | Desha, AR | 10.8 |
| 24 | Henry, IL | 10.7 |
| 24 | Renville, MN | 10.7 |
| 24 | Logan, IL | 10.7 |
| 25 | Redwood, MN | 10.5 |
| 26 | Bureau, IL | 10.4 |
| 26 | Phillips, AR | 10.4 |
County Soybean Production – 2018
County Soybean County National Production Ranking – 2018
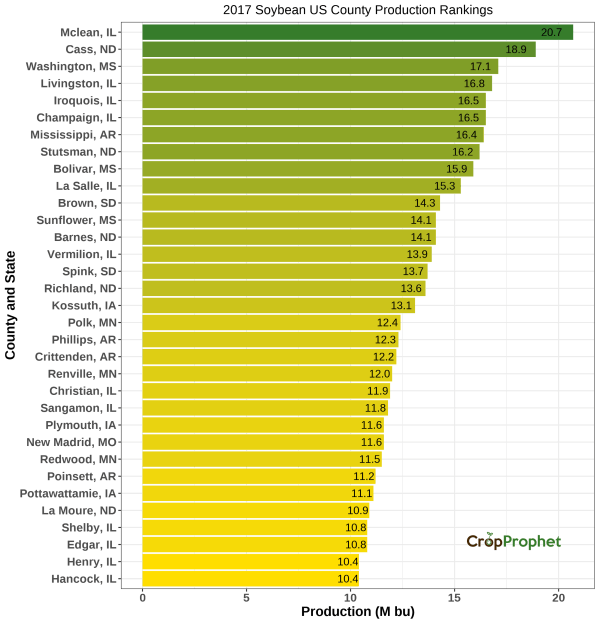
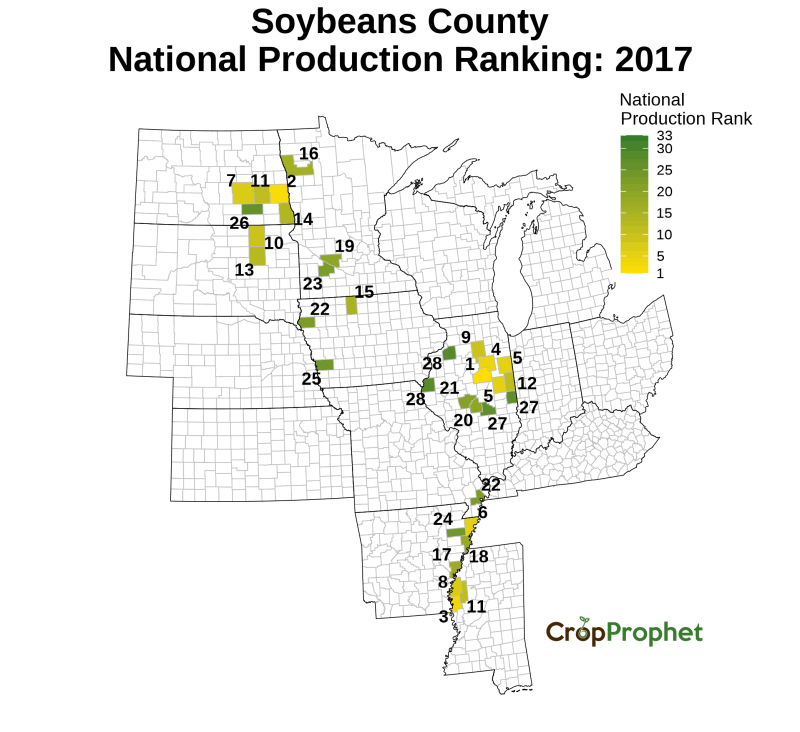
Soybean Production by County: Top 33 of 2017
The top 33 soybeans-producing counties (and their total production) of 2017 was:
| County Production Rankings: 2017 | ||
| Rank | County, State | Production (M bu) |
|---|---|---|
| 1 | Mclean, IL | 20.7 |
| 2 | Cass, ND | 18.9 |
| 3 | Washington, MS | 17.1 |
| 4 | Livingston, IL | 16.8 |
| 5 | Champaign, IL | 16.5 |
| 5 | Iroquois, IL | 16.5 |
| 6 | Mississippi, AR | 16.4 |
| 7 | Stutsman, ND | 16.2 |
| 8 | Bolivar, MS | 15.9 |
| 9 | La Salle, IL | 15.3 |
| 10 | Brown, SD | 14.3 |
| 11 | Sunflower, MS | 14.1 |
| 11 | Barnes, ND | 14.1 |
| 12 | Vermilion, IL | 13.9 |
| 13 | Spink, SD | 13.7 |
| 14 | Richland, ND | 13.6 |
| 15 | Kossuth, IA | 13.1 |
| 16 | Polk, MN | 12.4 |
| 17 | Phillips, AR | 12.3 |
| 18 | Crittenden, AR | 12.2 |
| 19 | Renville, MN | 12.0 |
| 20 | Christian, IL | 11.9 |
| 21 | Sangamon, IL | 11.8 |
| 22 | Plymouth, IA | 11.6 |
| 22 | New Madrid, MO | 11.6 |
| 23 | Redwood, MN | 11.5 |
| 24 | Poinsett, AR | 11.2 |
| 25 | Pottawattamie, IA | 11.1 |
| 26 | La Moure, ND | 10.9 |
| 27 | Edgar, IL | 10.8 |
| 27 | Shelby, IL | 10.8 |
| 28 | Henry, IL | 10.4 |
| 28 | Hancock, IL | 10.4 |
County Soybean Production – 2017
County Soybean County National Production Ranking – 2017
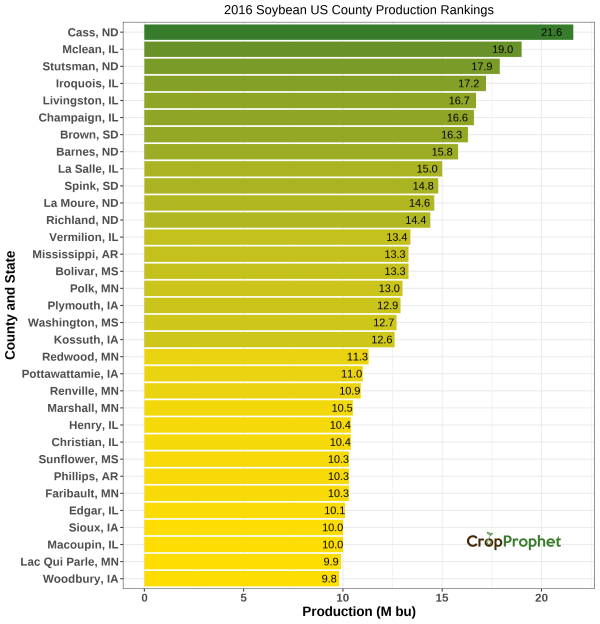
Soybean Production by County: Top 33 of 2016
The top 33 soybeans-producing counties (and their total production) of 2016 was:
| County Production Rankings: 2016 | ||
| Rank | County, State | Production (M bu) |
|---|---|---|
| 1 | Cass, ND | 21.6 |
| 2 | Mclean, IL | 19.0 |
| 3 | Stutsman, ND | 17.9 |
| 4 | Iroquois, IL | 17.2 |
| 5 | Livingston, IL | 16.7 |
| 6 | Champaign, IL | 16.6 |
| 7 | Brown, SD | 16.3 |
| 8 | Barnes, ND | 15.8 |
| 9 | La Salle, IL | 15.0 |
| 10 | Spink, SD | 14.8 |
| 11 | La Moure, ND | 14.6 |
| 12 | Richland, ND | 14.4 |
| 13 | Vermilion, IL | 13.4 |
| 14 | Mississippi, AR | 13.3 |
| 14 | Bolivar, MS | 13.3 |
| 15 | Polk, MN | 13.0 |
| 16 | Plymouth, IA | 12.9 |
| 17 | Washington, MS | 12.7 |
| 18 | Kossuth, IA | 12.6 |
| 19 | Redwood, MN | 11.3 |
| 20 | Pottawattamie, IA | 11.0 |
| 21 | Renville, MN | 10.9 |
| 22 | Marshall, MN | 10.5 |
| 23 | Henry, IL | 10.4 |
| 23 | Christian, IL | 10.4 |
| 24 | Faribault, MN | 10.3 |
| 24 | Phillips, AR | 10.3 |
| 24 | Sunflower, MS | 10.3 |
| 25 | Edgar, IL | 10.1 |
| 26 | Sioux, IA | 10.0 |
| 26 | Macoupin, IL | 10.0 |
| 27 | Lac Qui Parle, MN | 9.9 |
| 28 | Woodbury, IA | 9.8 |
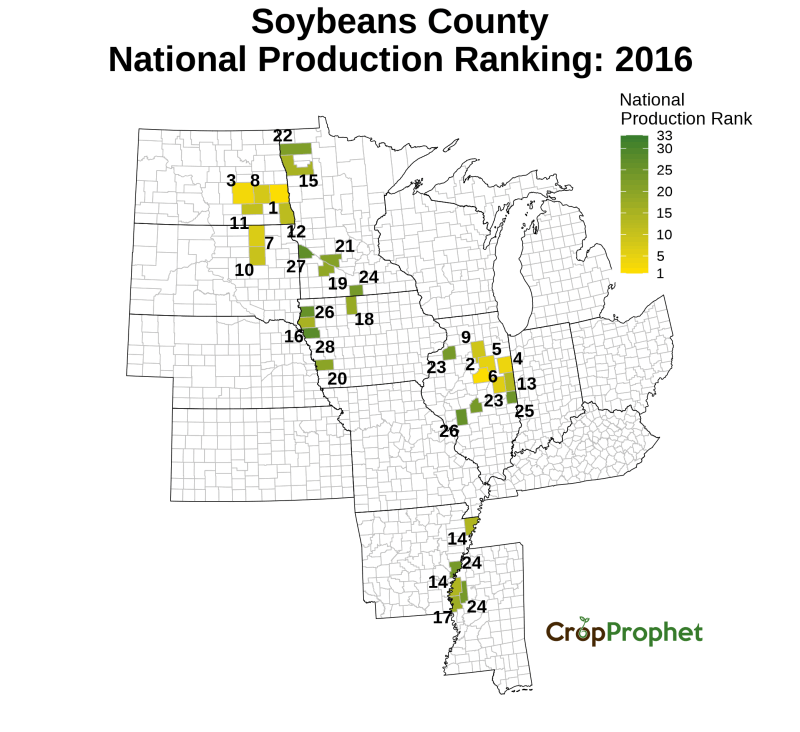
County Soybean Production – 2016
County Soybean County National Production Ranking – 2016
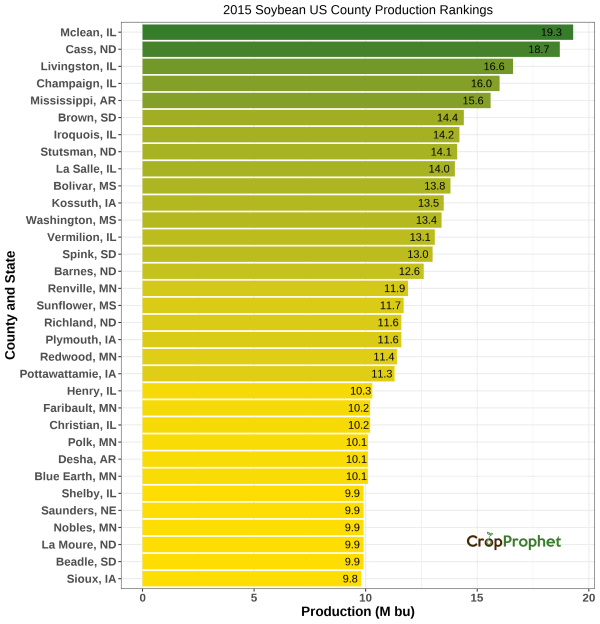
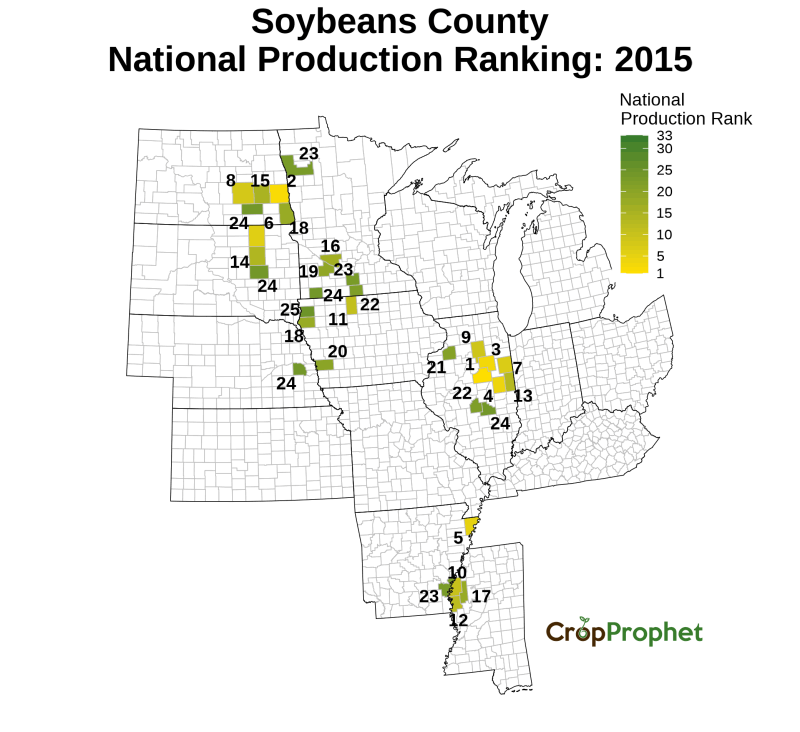
Soybean Production by County: Top 33 of 2015
The top 33 soybeans-producing counties (and their total production) of 2015 was:
| County Production Rankings: 2015 | ||
| Rank | County, State | Production (M bu) |
|---|---|---|
| 1 | Mclean, IL | 19.3 |
| 2 | Cass, ND | 18.7 |
| 3 | Livingston, IL | 16.6 |
| 4 | Champaign, IL | 16.0 |
| 5 | Mississippi, AR | 15.6 |
| 6 | Brown, SD | 14.4 |
| 7 | Iroquois, IL | 14.2 |
| 8 | Stutsman, ND | 14.1 |
| 9 | La Salle, IL | 14.0 |
| 10 | Bolivar, MS | 13.8 |
| 11 | Kossuth, IA | 13.5 |
| 12 | Washington, MS | 13.4 |
| 13 | Vermilion, IL | 13.1 |
| 14 | Spink, SD | 13.0 |
| 15 | Barnes, ND | 12.6 |
| 16 | Renville, MN | 11.9 |
| 17 | Sunflower, MS | 11.7 |
| 18 | Plymouth, IA | 11.6 |
| 18 | Richland, ND | 11.6 |
| 19 | Redwood, MN | 11.4 |
| 20 | Pottawattamie, IA | 11.3 |
| 21 | Henry, IL | 10.3 |
| 22 | Faribault, MN | 10.2 |
| 22 | Christian, IL | 10.2 |
| 23 | Polk, MN | 10.1 |
| 23 | Desha, AR | 10.1 |
| 23 | Blue Earth, MN | 10.1 |
| 24 | Shelby, IL | 9.9 |
| 24 | Nobles, MN | 9.9 |
| 24 | La Moure, ND | 9.9 |
| 24 | Beadle, SD | 9.9 |
| 24 | Saunders, NE | 9.9 |
| 25 | Sioux, IA | 9.8 |
County Soybean Production – 2015
County Soybean County National Production Ranking – 2015
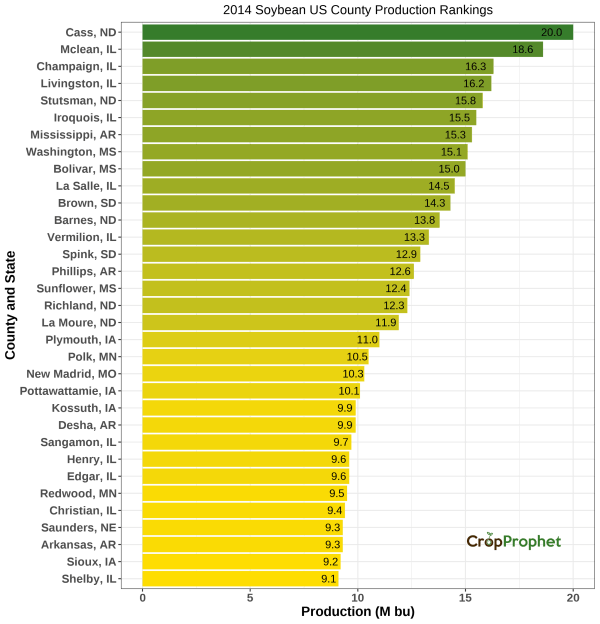
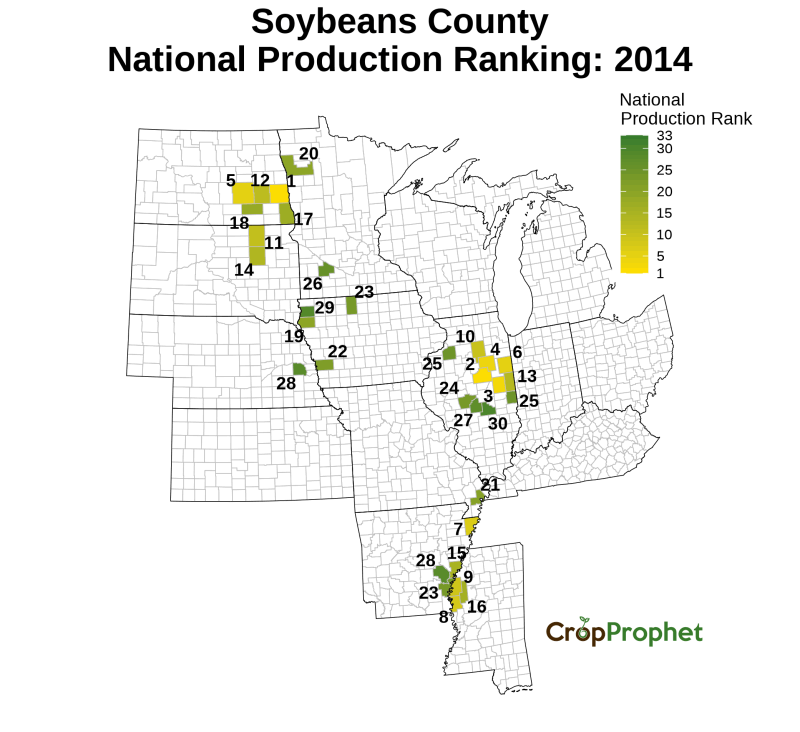
Soybean Production by County: Top 33 of 2014
The top 33 soybeans-producing counties (and their total production) of 2014 was:
| County Production Rankings: 2014 | ||
| Rank | County, State | Production (M bu) |
|---|---|---|
| 1 | Cass, ND | 20.0 |
| 2 | Mclean, IL | 18.6 |
| 3 | Champaign, IL | 16.3 |
| 4 | Livingston, IL | 16.2 |
| 5 | Stutsman, ND | 15.8 |
| 6 | Iroquois, IL | 15.5 |
| 7 | Mississippi, AR | 15.3 |
| 8 | Washington, MS | 15.1 |
| 9 | Bolivar, MS | 15.0 |
| 10 | La Salle, IL | 14.5 |
| 11 | Brown, SD | 14.3 |
| 12 | Barnes, ND | 13.8 |
| 13 | Vermilion, IL | 13.3 |
| 14 | Spink, SD | 12.9 |
| 15 | Phillips, AR | 12.6 |
| 16 | Sunflower, MS | 12.4 |
| 17 | Richland, ND | 12.3 |
| 18 | La Moure, ND | 11.9 |
| 19 | Plymouth, IA | 11.0 |
| 20 | Polk, MN | 10.5 |
| 21 | New Madrid, MO | 10.3 |
| 22 | Pottawattamie, IA | 10.1 |
| 23 | Desha, AR | 9.9 |
| 23 | Kossuth, IA | 9.9 |
| 24 | Sangamon, IL | 9.7 |
| 25 | Henry, IL | 9.6 |
| 25 | Edgar, IL | 9.6 |
| 26 | Redwood, MN | 9.5 |
| 27 | Christian, IL | 9.4 |
| 28 | Saunders, NE | 9.3 |
| 28 | Arkansas, AR | 9.3 |
| 29 | Sioux, IA | 9.2 |
| 30 | Shelby, IL | 9.1 |
County Soybean Production – 2014
County Soybean County National Production Ranking – 2014
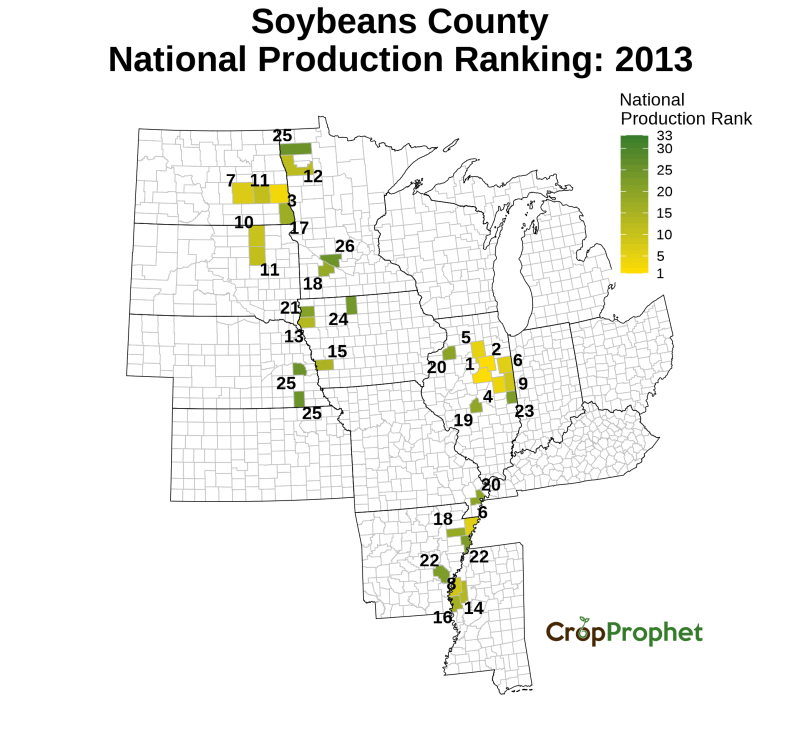
Soybean Production by County: Top 33 of 2013
The top 33 soybeans-producing counties (and their total production) of 2013 was:
| County Production Rankings: 2013 | ||
| Rank | County, State | Production (M bu) |
|---|---|---|
| 1 | Mclean, IL | 16.6 |
| 2 | Livingston, IL | 15.1 |
| 3 | Cass, ND | 15.0 |
| 4 | Champaign, IL | 13.1 |
| 5 | La Salle, IL | 12.8 |
| 6 | Mississippi, AR | 12.3 |
| 6 | Iroquois, IL | 12.3 |
| 7 | Stutsman, ND | 11.8 |
| 8 | Bolivar, MS | 10.9 |
| 9 | Vermilion, IL | 10.7 |
| 10 | Brown, SD | 10.5 |
| 11 | Barnes, ND | 10.4 |
| 11 | Spink, SD | 10.4 |
| 12 | Polk, MN | 10.2 |
| 13 | Plymouth, IA | 9.9 |
| 14 | Sunflower, MS | 9.8 |
| 15 | Pottawattamie, IA | 9.6 |
| 16 | Washington, MS | 9.5 |
| 17 | Richland, ND | 9.4 |
| 18 | Redwood, MN | 9.3 |
| 18 | Poinsett, AR | 9.3 |
| 19 | Christian, IL | 9.1 |
| 20 | Henry, IL | 9.0 |
| 20 | New Madrid, MO | 9.0 |
| 21 | Sioux, IA | 8.9 |
| 22 | Crittenden, AR | 8.7 |
| 22 | Arkansas, AR | 8.7 |
| 23 | Edgar, IL | 8.6 |
| 24 | Kossuth, IA | 8.5 |
| 25 | Gage, NE | 8.3 |
| 25 | Marshall, MN | 8.3 |
| 25 | Saunders, NE | 8.3 |
| 26 | Renville, MN | 8.2 |
County Soybean Production – 2013

County Soybean County National Production Ranking – 2013
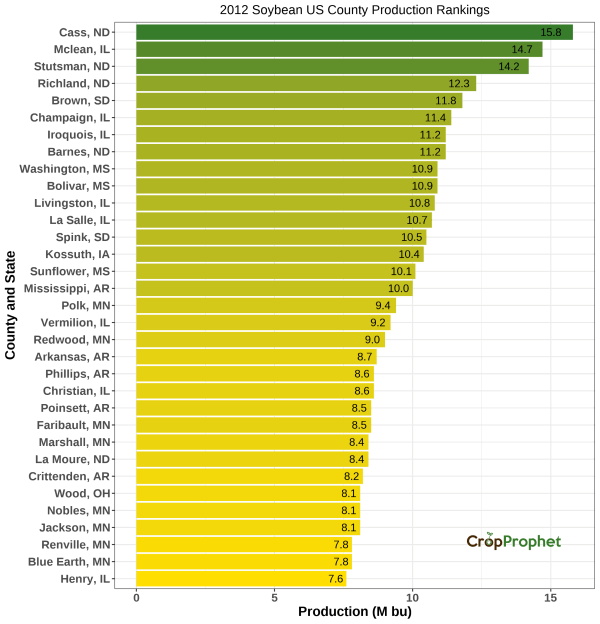
Soybean Production by County: Top 33 of 2012
The top 33 soybeans-producing counties (and their total production) of 2012 was:
| County Production Rankings: 2012 | ||
| Rank | County, State | Production (M bu) |
|---|---|---|
| 1 | Cass, ND | 15.8 |
| 2 | Mclean, IL | 14.7 |
| 3 | Stutsman, ND | 14.2 |
| 4 | Richland, ND | 12.3 |
| 5 | Brown, SD | 11.8 |
| 6 | Champaign, IL | 11.4 |
| 7 | Barnes, ND | 11.2 |
| 7 | Iroquois, IL | 11.2 |
| 8 | Washington, MS | 10.9 |
| 8 | Bolivar, MS | 10.9 |
| 9 | Livingston, IL | 10.8 |
| 10 | La Salle, IL | 10.7 |
| 11 | Spink, SD | 10.5 |
| 12 | Kossuth, IA | 10.4 |
| 13 | Sunflower, MS | 10.1 |
| 14 | Mississippi, AR | 10.0 |
| 15 | Polk, MN | 9.4 |
| 16 | Vermilion, IL | 9.2 |
| 17 | Redwood, MN | 9.0 |
| 18 | Arkansas, AR | 8.7 |
| 19 | Phillips, AR | 8.6 |
| 19 | Christian, IL | 8.6 |
| 20 | Faribault, MN | 8.5 |
| 20 | Poinsett, AR | 8.5 |
| 21 | Marshall, MN | 8.4 |
| 21 | La Moure, ND | 8.4 |
| 22 | Crittenden, AR | 8.2 |
| 23 | Jackson, MN | 8.1 |
| 23 | Nobles, MN | 8.1 |
| 23 | Wood, OH | 8.1 |
| 24 | Blue Earth, MN | 7.8 |
| 24 | Renville, MN | 7.8 |
| 25 | Henry, IL | 7.6 |
County Soybean Production – 2012
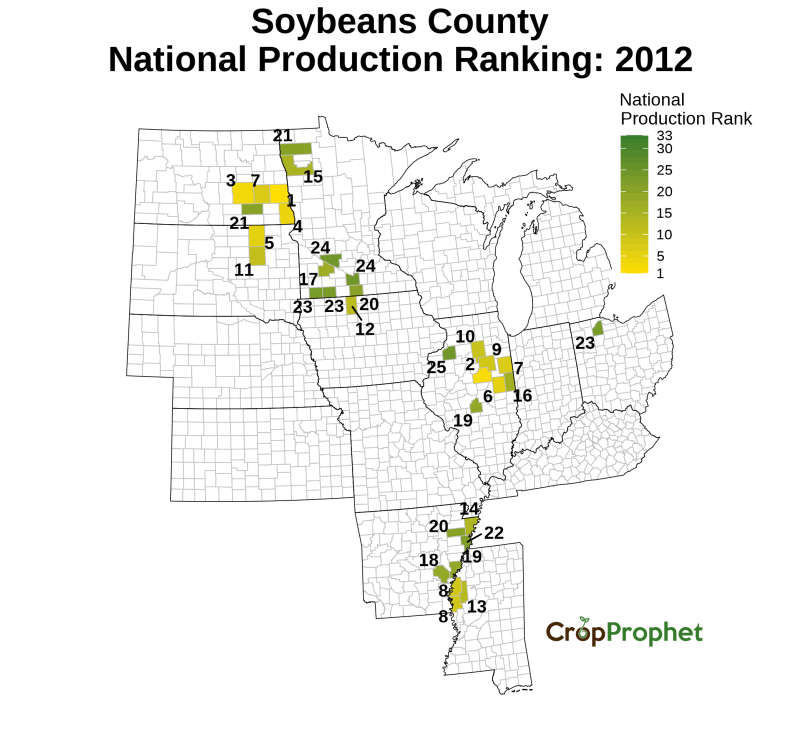
County Soybean County National Production Ranking – 2012
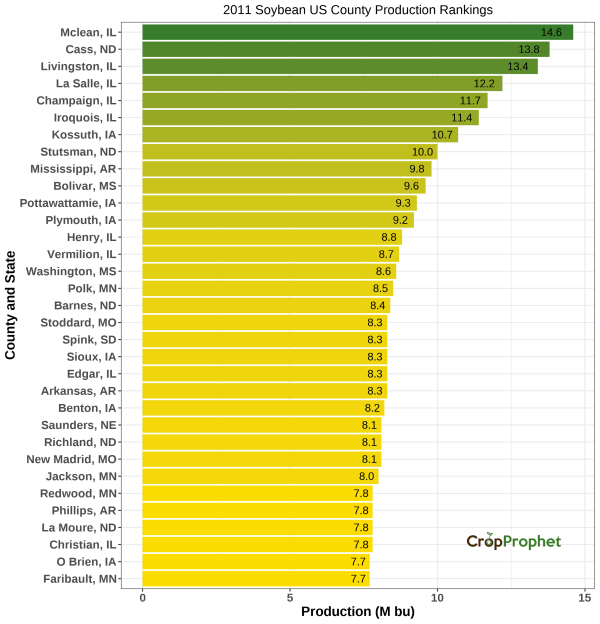
Soybean Production by County: Top 33 of 2011
The top 33 soybeans-producing counties (and their total production) of 2011 was:
| County Production Rankings: 2011 | ||
| Rank | County, State | Production (M bu) |
|---|---|---|
| 1 | Mclean, IL | 14.6 |
| 2 | Cass, ND | 13.8 |
| 3 | Livingston, IL | 13.4 |
| 4 | La Salle, IL | 12.2 |
| 5 | Champaign, IL | 11.7 |
| 6 | Iroquois, IL | 11.4 |
| 7 | Kossuth, IA | 10.7 |
| 8 | Stutsman, ND | 10.0 |
| 9 | Mississippi, AR | 9.8 |
| 10 | Bolivar, MS | 9.6 |
| 11 | Pottawattamie, IA | 9.3 |
| 12 | Plymouth, IA | 9.2 |
| 13 | Henry, IL | 8.8 |
| 14 | Vermilion, IL | 8.7 |
| 15 | Washington, MS | 8.6 |
| 16 | Polk, MN | 8.5 |
| 17 | Barnes, ND | 8.4 |
| 18 | Spink, SD | 8.3 |
| 18 | Stoddard, MO | 8.3 |
| 18 | Sioux, IA | 8.3 |
| 18 | Edgar, IL | 8.3 |
| 18 | Arkansas, AR | 8.3 |
| 19 | Benton, IA | 8.2 |
| 20 | Richland, ND | 8.1 |
| 20 | Saunders, NE | 8.1 |
| 20 | New Madrid, MO | 8.1 |
| 21 | Jackson, MN | 8.0 |
| 22 | Phillips, AR | 7.8 |
| 22 | Redwood, MN | 7.8 |
| 22 | Christian, IL | 7.8 |
| 22 | La Moure, ND | 7.8 |
| 23 | Faribault, MN | 7.7 |
| 23 | O Brien, IA | 7.7 |
County Soybean Production – 2011
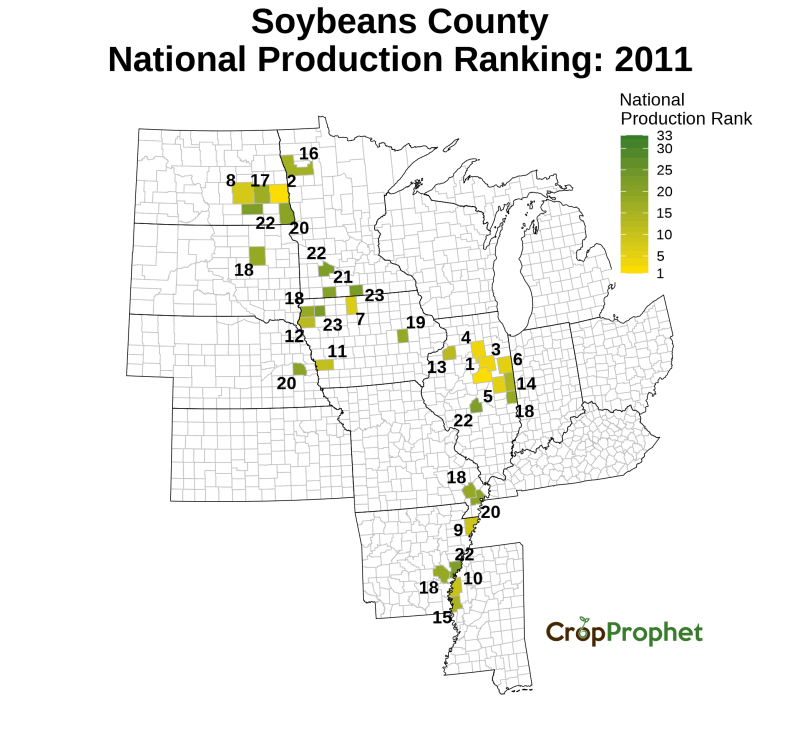
County Soybean County National Production Ranking – 2011
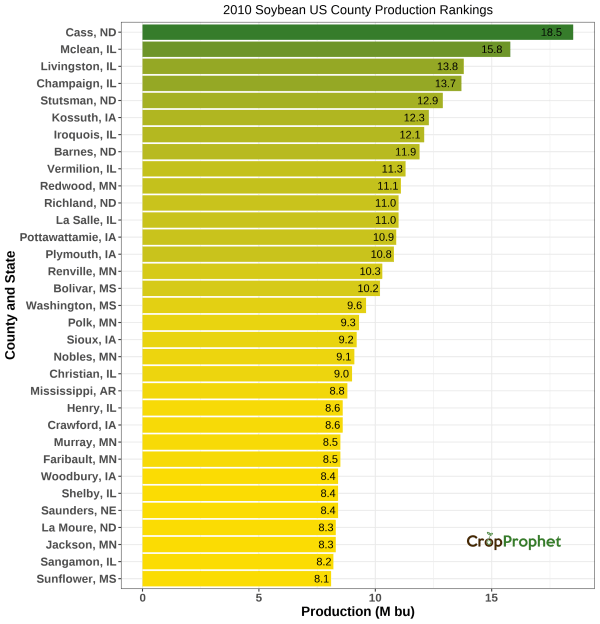
Soybean Production by County: Top 33 of 2010
The top 33 soybeans-producing counties (and their total production) of 2010 was:
| County Production Rankings: 2010 | ||
| Rank | County, State | Production (M bu) |
|---|---|---|
| 1 | Cass, ND | 18.5 |
| 2 | Mclean, IL | 15.8 |
| 3 | Livingston, IL | 13.8 |
| 4 | Champaign, IL | 13.7 |
| 5 | Stutsman, ND | 12.9 |
| 6 | Kossuth, IA | 12.3 |
| 7 | Iroquois, IL | 12.1 |
| 8 | Barnes, ND | 11.9 |
| 9 | Vermilion, IL | 11.3 |
| 10 | Redwood, MN | 11.1 |
| 11 | La Salle, IL | 11.0 |
| 11 | Richland, ND | 11.0 |
| 12 | Pottawattamie, IA | 10.9 |
| 13 | Plymouth, IA | 10.8 |
| 14 | Renville, MN | 10.3 |
| 15 | Bolivar, MS | 10.2 |
| 16 | Washington, MS | 9.6 |
| 17 | Polk, MN | 9.3 |
| 18 | Sioux, IA | 9.2 |
| 19 | Nobles, MN | 9.1 |
| 20 | Christian, IL | 9.0 |
| 21 | Mississippi, AR | 8.8 |
| 22 | Crawford, IA | 8.6 |
| 22 | Henry, IL | 8.6 |
| 23 | Faribault, MN | 8.5 |
| 23 | Murray, MN | 8.5 |
| 24 | Shelby, IL | 8.4 |
| 24 | Woodbury, IA | 8.4 |
| 24 | Saunders, NE | 8.4 |
| 25 | Jackson, MN | 8.3 |
| 25 | La Moure, ND | 8.3 |
| 26 | Sangamon, IL | 8.2 |
| 27 | Sunflower, MS | 8.1 |
County Soybean Production – 2010
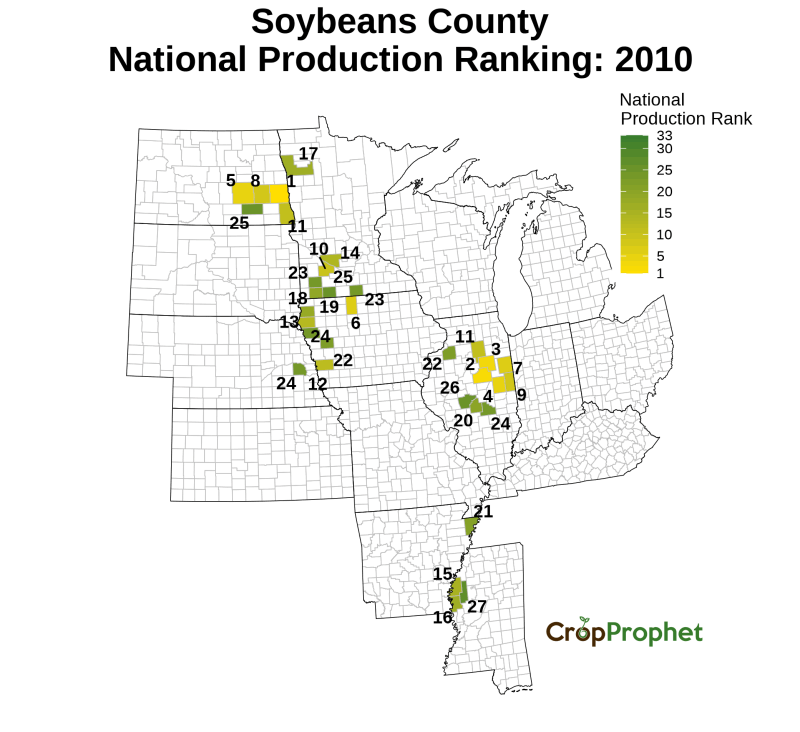
County Soybean County National Production Ranking – 2010
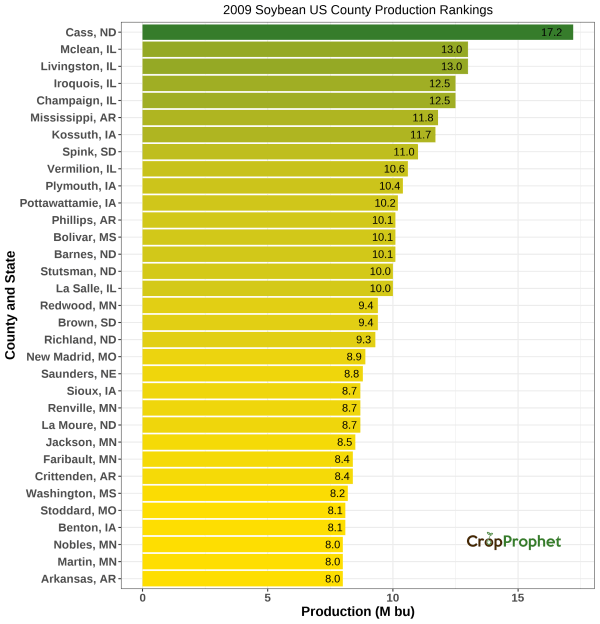
Soybean Production by County: Top 33 of 2009
The top 33 soybeans-producing counties (and their total production) of 2009 was:
| County Production Rankings: 2009 | ||
| Rank | County, State | Production (M bu) |
|---|---|---|
| 1 | Cass, ND | 17.2 |
| 2 | Mclean, IL | 13.0 |
| 2 | Livingston, IL | 13.0 |
| 3 | Iroquois, IL | 12.5 |
| 3 | Champaign, IL | 12.5 |
| 4 | Mississippi, AR | 11.8 |
| 5 | Kossuth, IA | 11.7 |
| 6 | Spink, SD | 11.0 |
| 7 | Vermilion, IL | 10.6 |
| 8 | Plymouth, IA | 10.4 |
| 9 | Pottawattamie, IA | 10.2 |
| 10 | Barnes, ND | 10.1 |
| 10 | Phillips, AR | 10.1 |
| 10 | Bolivar, MS | 10.1 |
| 11 | La Salle, IL | 10.0 |
| 11 | Stutsman, ND | 10.0 |
| 12 | Redwood, MN | 9.4 |
| 12 | Brown, SD | 9.4 |
| 13 | Richland, ND | 9.3 |
| 14 | New Madrid, MO | 8.9 |
| 15 | Saunders, NE | 8.8 |
| 16 | Sioux, IA | 8.7 |
| 16 | Renville, MN | 8.7 |
| 16 | La Moure, ND | 8.7 |
| 17 | Jackson, MN | 8.5 |
| 18 | Faribault, MN | 8.4 |
| 18 | Crittenden, AR | 8.4 |
| 19 | Washington, MS | 8.2 |
| 20 | Stoddard, MO | 8.1 |
| 20 | Benton, IA | 8.1 |
| 21 | Nobles, MN | 8.0 |
| 21 | Arkansas, AR | 8.0 |
| 21 | Martin, MN | 8.0 |
County Soybean Production – 2009
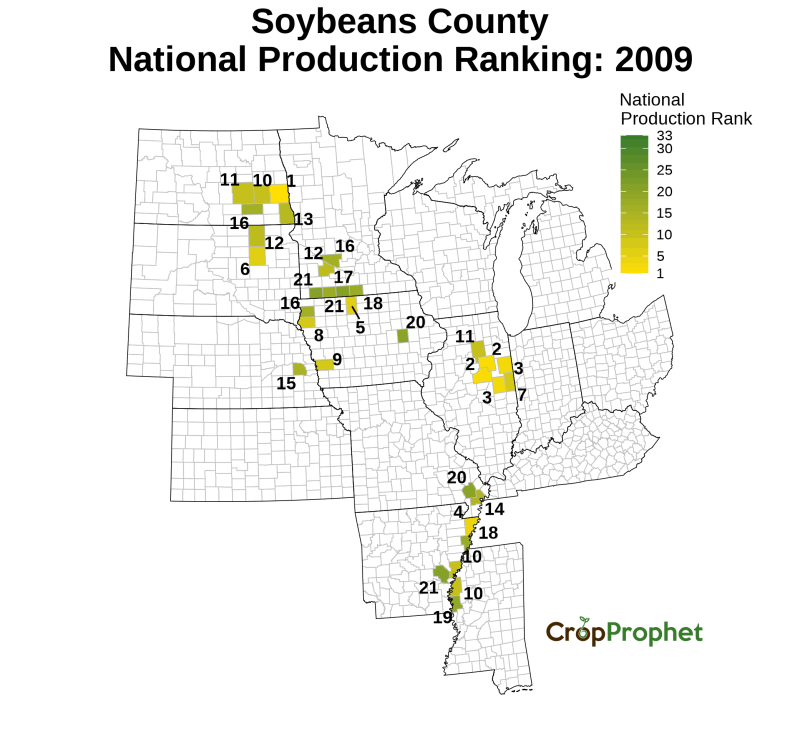
County Soybean County National Production Ranking – 2009
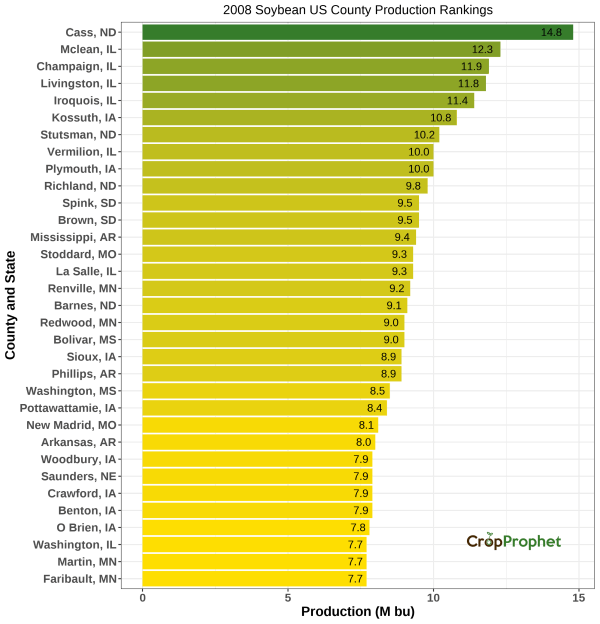
Soybean Production by County: Top 33 of 2008
The top 33 soybeans-producing counties (and their total production) of 2008 was:
| County Production Rankings: 2008 | ||
| Rank | County, State | Production (M bu) |
|---|---|---|
| 1 | Cass, ND | 14.8 |
| 2 | Mclean, IL | 12.3 |
| 3 | Champaign, IL | 11.9 |
| 4 | Livingston, IL | 11.8 |
| 5 | Iroquois, IL | 11.4 |
| 6 | Kossuth, IA | 10.8 |
| 7 | Stutsman, ND | 10.2 |
| 8 | Vermilion, IL | 10.0 |
| 8 | Plymouth, IA | 10.0 |
| 9 | Richland, ND | 9.8 |
| 10 | Spink, SD | 9.5 |
| 10 | Brown, SD | 9.5 |
| 11 | Mississippi, AR | 9.4 |
| 12 | La Salle, IL | 9.3 |
| 12 | Stoddard, MO | 9.3 |
| 13 | Renville, MN | 9.2 |
| 14 | Barnes, ND | 9.1 |
| 15 | Bolivar, MS | 9.0 |
| 15 | Redwood, MN | 9.0 |
| 16 | Sioux, IA | 8.9 |
| 16 | Phillips, AR | 8.9 |
| 17 | Washington, MS | 8.5 |
| 18 | Pottawattamie, IA | 8.4 |
| 19 | New Madrid, MO | 8.1 |
| 20 | Arkansas, AR | 8.0 |
| 21 | Woodbury, IA | 7.9 |
| 21 | Crawford, IA | 7.9 |
| 21 | Saunders, NE | 7.9 |
| 21 | Benton, IA | 7.9 |
| 22 | O Brien, IA | 7.8 |
| 23 | Martin, MN | 7.7 |
| 23 | Washington, IL | 7.7 |
| 23 | Faribault, MN | 7.7 |
County Soybean Production – 2008
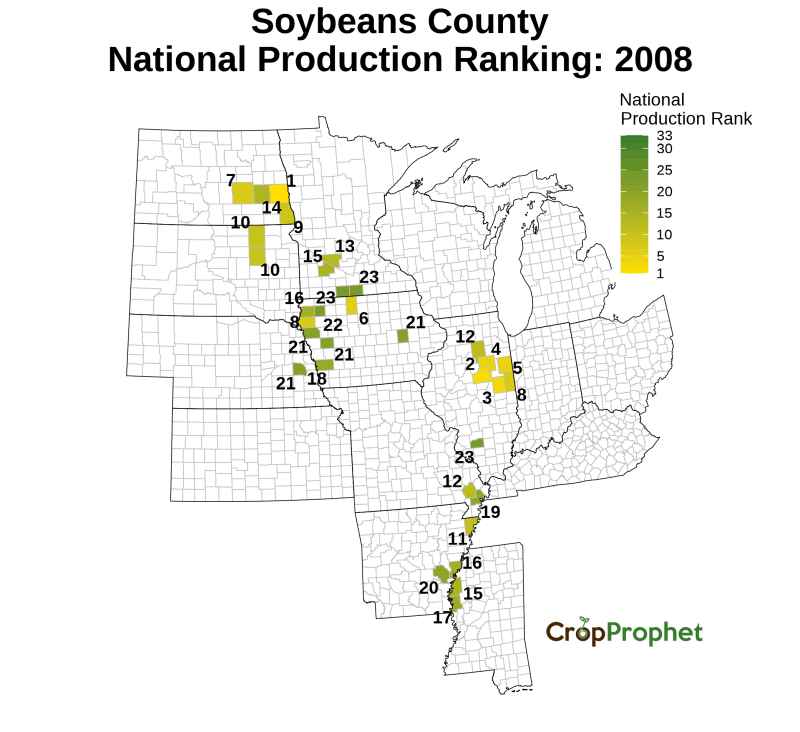
County Soybean County National Production Ranking – 2008
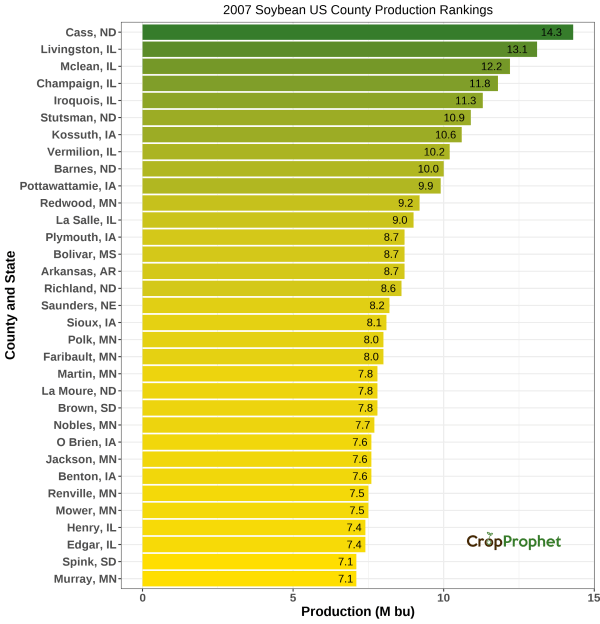
Soybean Production by County: Top 33 of 2007
The top 33 soybeans-producing counties (and their total production) of 2007 was:
| County Production Rankings: 2007 | ||
| Rank | County, State | Production (M bu) |
|---|---|---|
| 1 | Cass, ND | 14.3 |
| 2 | Livingston, IL | 13.1 |
| 3 | Mclean, IL | 12.2 |
| 4 | Champaign, IL | 11.8 |
| 5 | Iroquois, IL | 11.3 |
| 6 | Stutsman, ND | 10.9 |
| 7 | Kossuth, IA | 10.6 |
| 8 | Vermilion, IL | 10.2 |
| 9 | Barnes, ND | 10.0 |
| 10 | Pottawattamie, IA | 9.9 |
| 11 | Redwood, MN | 9.2 |
| 12 | La Salle, IL | 9.0 |
| 13 | Arkansas, AR | 8.7 |
| 13 | Plymouth, IA | 8.7 |
| 13 | Bolivar, MS | 8.7 |
| 14 | Richland, ND | 8.6 |
| 15 | Saunders, NE | 8.2 |
| 16 | Sioux, IA | 8.1 |
| 17 | Faribault, MN | 8.0 |
| 17 | Polk, MN | 8.0 |
| 18 | La Moure, ND | 7.8 |
| 18 | Brown, SD | 7.8 |
| 18 | Martin, MN | 7.8 |
| 19 | Nobles, MN | 7.7 |
| 20 | Benton, IA | 7.6 |
| 20 | O Brien, IA | 7.6 |
| 20 | Jackson, MN | 7.6 |
| 21 | Renville, MN | 7.5 |
| 21 | Mower, MN | 7.5 |
| 22 | Edgar, IL | 7.4 |
| 22 | Henry, IL | 7.4 |
| 23 | Spink, SD | 7.1 |
| 23 | Murray, MN | 7.1 |
County Soybean Production – 2007
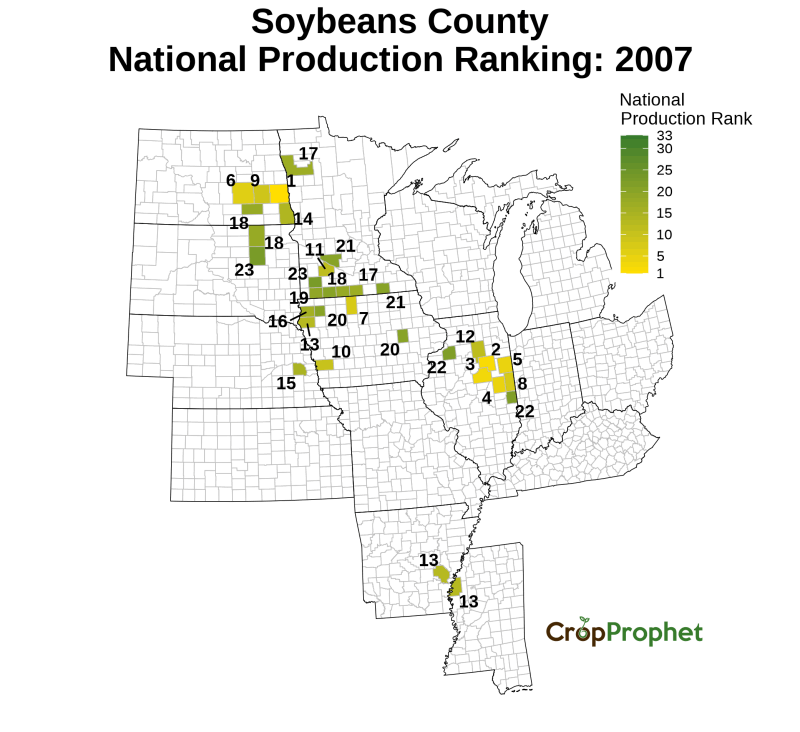
County Soybean County National Production Ranking – 2007
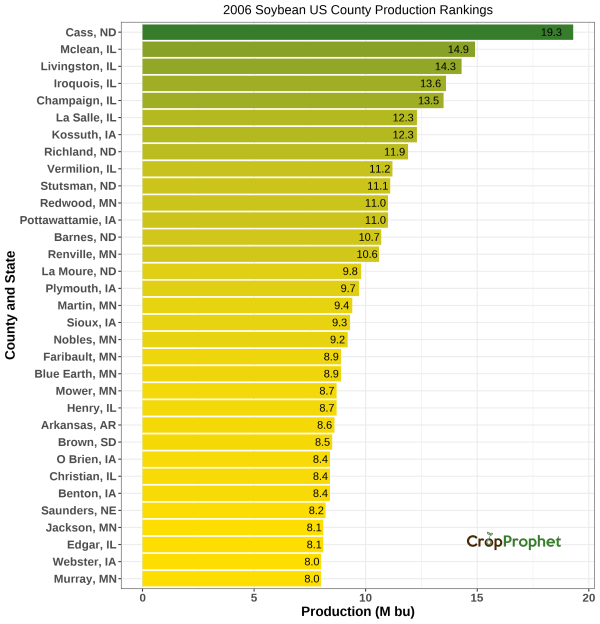
Soybean Production by County: Top 33 of 2006
The top 33 soybeans-producing counties (and their total production) of 2006 was:
| County Production Rankings: 2006 | ||
| Rank | County, State | Production (M bu) |
|---|---|---|
| 1 | Cass, ND | 19.3 |
| 2 | Mclean, IL | 14.9 |
| 3 | Livingston, IL | 14.3 |
| 4 | Iroquois, IL | 13.6 |
| 5 | Champaign, IL | 13.5 |
| 6 | La Salle, IL | 12.3 |
| 6 | Kossuth, IA | 12.3 |
| 7 | Richland, ND | 11.9 |
| 8 | Vermilion, IL | 11.2 |
| 9 | Stutsman, ND | 11.1 |
| 10 | Redwood, MN | 11.0 |
| 10 | Pottawattamie, IA | 11.0 |
| 11 | Barnes, ND | 10.7 |
| 12 | Renville, MN | 10.6 |
| 13 | La Moure, ND | 9.8 |
| 14 | Plymouth, IA | 9.7 |
| 15 | Martin, MN | 9.4 |
| 16 | Sioux, IA | 9.3 |
| 17 | Nobles, MN | 9.2 |
| 18 | Faribault, MN | 8.9 |
| 18 | Blue Earth, MN | 8.9 |
| 19 | Henry, IL | 8.7 |
| 19 | Mower, MN | 8.7 |
| 20 | Arkansas, AR | 8.6 |
| 21 | Brown, SD | 8.5 |
| 22 | Christian, IL | 8.4 |
| 22 | Benton, IA | 8.4 |
| 22 | O Brien, IA | 8.4 |
| 23 | Saunders, NE | 8.2 |
| 24 | Jackson, MN | 8.1 |
| 24 | Edgar, IL | 8.1 |
| 25 | Webster, IA | 8.0 |
| 25 | Murray, MN | 8.0 |
County Soybean Production – 2006
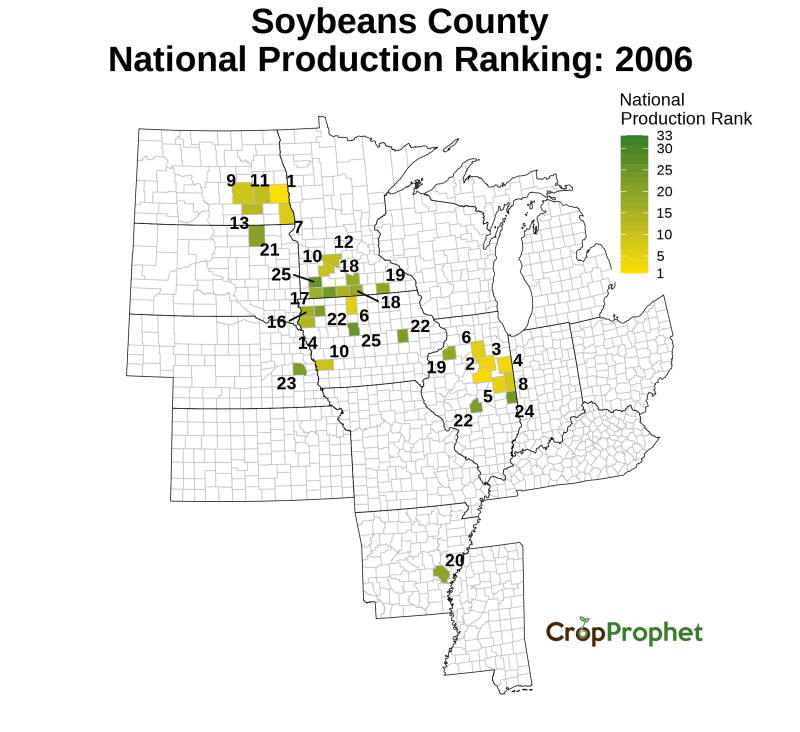
County Soybean County National Production Ranking – 2006
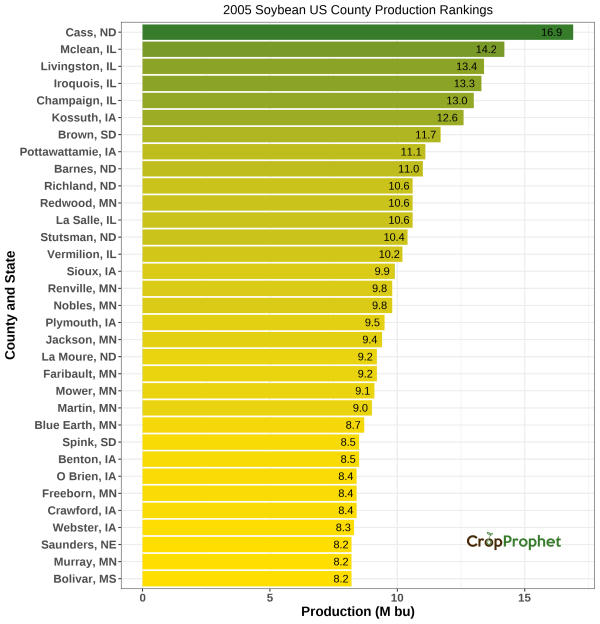
Soybean Production by County: Top 33 of 2005
The top 33 soybeans-producing counties (and their total production) of 2005 was:
| County Production Rankings: 2005 | ||
| Rank | County, State | Production (M bu) |
|---|---|---|
| 1 | Cass, ND | 16.9 |
| 2 | Mclean, IL | 14.2 |
| 3 | Livingston, IL | 13.4 |
| 4 | Iroquois, IL | 13.3 |
| 5 | Champaign, IL | 13.0 |
| 6 | Kossuth, IA | 12.6 |
| 7 | Brown, SD | 11.7 |
| 8 | Pottawattamie, IA | 11.1 |
| 9 | Barnes, ND | 11.0 |
| 10 | Richland, ND | 10.6 |
| 10 | La Salle, IL | 10.6 |
| 10 | Redwood, MN | 10.6 |
| 11 | Stutsman, ND | 10.4 |
| 12 | Vermilion, IL | 10.2 |
| 13 | Sioux, IA | 9.9 |
| 14 | Renville, MN | 9.8 |
| 14 | Nobles, MN | 9.8 |
| 15 | Plymouth, IA | 9.5 |
| 16 | Jackson, MN | 9.4 |
| 17 | La Moure, ND | 9.2 |
| 17 | Faribault, MN | 9.2 |
| 18 | Mower, MN | 9.1 |
| 19 | Martin, MN | 9.0 |
| 20 | Blue Earth, MN | 8.7 |
| 21 | Spink, SD | 8.5 |
| 21 | Benton, IA | 8.5 |
| 22 | O Brien, IA | 8.4 |
| 22 | Freeborn, MN | 8.4 |
| 22 | Crawford, IA | 8.4 |
| 23 | Webster, IA | 8.3 |
| 24 | Saunders, NE | 8.2 |
| 24 | Bolivar, MS | 8.2 |
| 24 | Murray, MN | 8.2 |
County Soybean Production – 2005
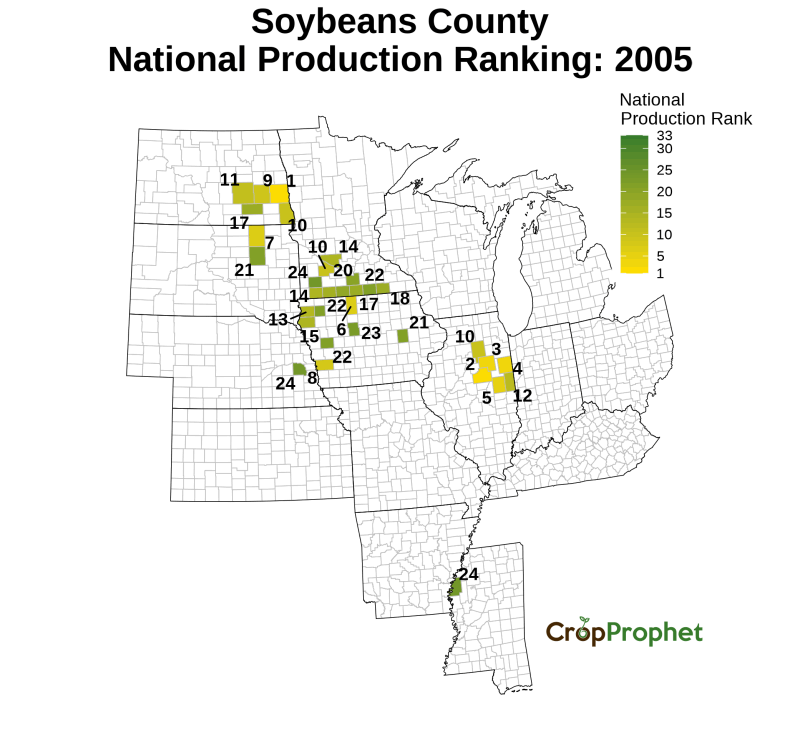
County Soybean County National Production Ranking – 2005
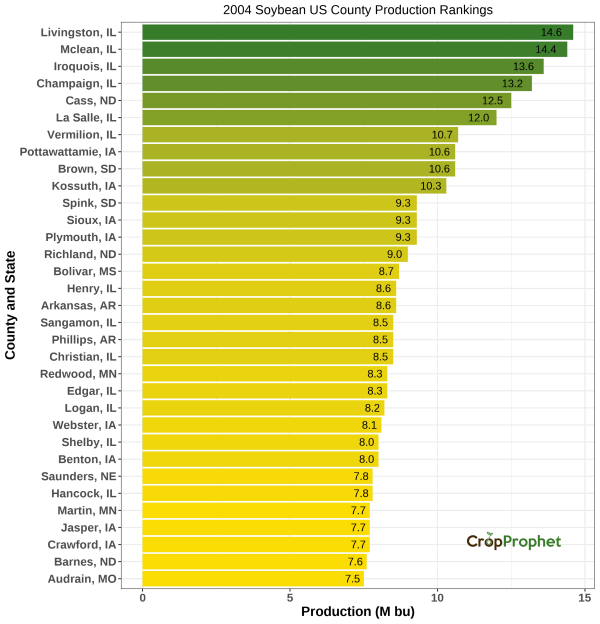
Soybean Production by County: Top 33 of 2004
The top 33 soybeans-producing counties (and their total production) of 2004 was:
| County Production Rankings: 2004 | ||
| Rank | County, State | Production (M bu) |
|---|---|---|
| 1 | Livingston, IL | 14.6 |
| 2 | Mclean, IL | 14.4 |
| 3 | Iroquois, IL | 13.6 |
| 4 | Champaign, IL | 13.2 |
| 5 | Cass, ND | 12.5 |
| 6 | La Salle, IL | 12.0 |
| 7 | Vermilion, IL | 10.7 |
| 8 | Brown, SD | 10.6 |
| 8 | Pottawattamie, IA | 10.6 |
| 9 | Kossuth, IA | 10.3 |
| 10 | Sioux, IA | 9.3 |
| 10 | Spink, SD | 9.3 |
| 10 | Plymouth, IA | 9.3 |
| 11 | Richland, ND | 9.0 |
| 12 | Bolivar, MS | 8.7 |
| 13 | Henry, IL | 8.6 |
| 13 | Arkansas, AR | 8.6 |
| 14 | Sangamon, IL | 8.5 |
| 14 | Christian, IL | 8.5 |
| 14 | Phillips, AR | 8.5 |
| 15 | Redwood, MN | 8.3 |
| 15 | Edgar, IL | 8.3 |
| 16 | Logan, IL | 8.2 |
| 17 | Webster, IA | 8.1 |
| 18 | Benton, IA | 8.0 |
| 18 | Shelby, IL | 8.0 |
| 19 | Saunders, NE | 7.8 |
| 19 | Hancock, IL | 7.8 |
| 20 | Martin, MN | 7.7 |
| 20 | Jasper, IA | 7.7 |
| 20 | Crawford, IA | 7.7 |
| 21 | Barnes, ND | 7.6 |
| 22 | Audrain, MO | 7.5 |
County Soybean Production – 2004
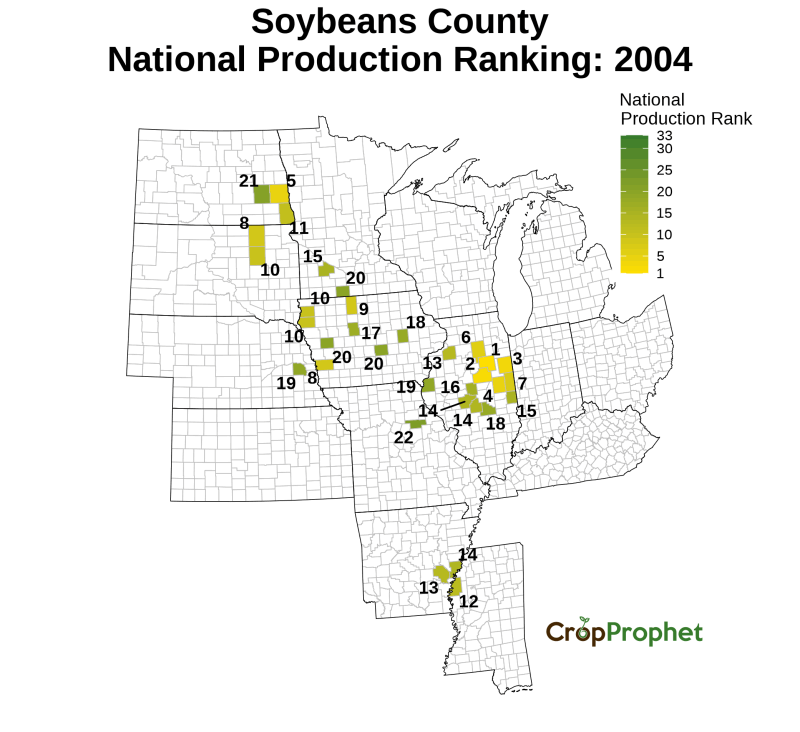
County Soybean County National Production Ranking – 2004
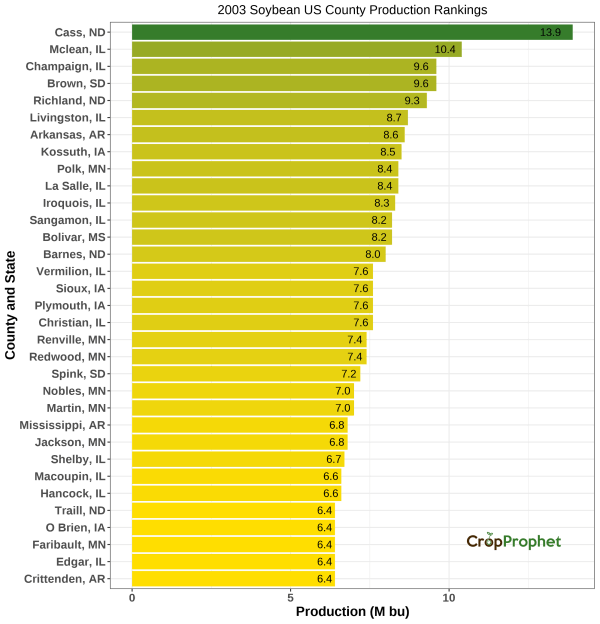
Soybean Production by County: Top 33 of 2003
The top 33 soybeans-producing counties (and their total production) of 2003 was:
| County Production Rankings: 2003 | ||
| Rank | County, State | Production (M bu) |
|---|---|---|
| 1 | Cass, ND | 13.9 |
| 2 | Mclean, IL | 10.4 |
| 3 | Brown, SD | 9.6 |
| 3 | Champaign, IL | 9.6 |
| 4 | Richland, ND | 9.3 |
| 5 | Livingston, IL | 8.7 |
| 6 | Arkansas, AR | 8.6 |
| 7 | Kossuth, IA | 8.5 |
| 8 | La Salle, IL | 8.4 |
| 8 | Polk, MN | 8.4 |
| 9 | Iroquois, IL | 8.3 |
| 10 | Sangamon, IL | 8.2 |
| 10 | Bolivar, MS | 8.2 |
| 11 | Barnes, ND | 8.0 |
| 12 | Christian, IL | 7.6 |
| 12 | Plymouth, IA | 7.6 |
| 12 | Vermilion, IL | 7.6 |
| 12 | Sioux, IA | 7.6 |
| 13 | Redwood, MN | 7.4 |
| 13 | Renville, MN | 7.4 |
| 14 | Spink, SD | 7.2 |
| 15 | Martin, MN | 7.0 |
| 15 | Nobles, MN | 7.0 |
| 16 | Jackson, MN | 6.8 |
| 16 | Mississippi, AR | 6.8 |
| 17 | Shelby, IL | 6.7 |
| 18 | Macoupin, IL | 6.6 |
| 18 | Hancock, IL | 6.6 |
| 19 | O Brien, IA | 6.4 |
| 19 | Faribault, MN | 6.4 |
| 19 | Edgar, IL | 6.4 |
| 19 | Crittenden, AR | 6.4 |
| 19 | Traill, ND | 6.4 |
County Soybean Production – 2003
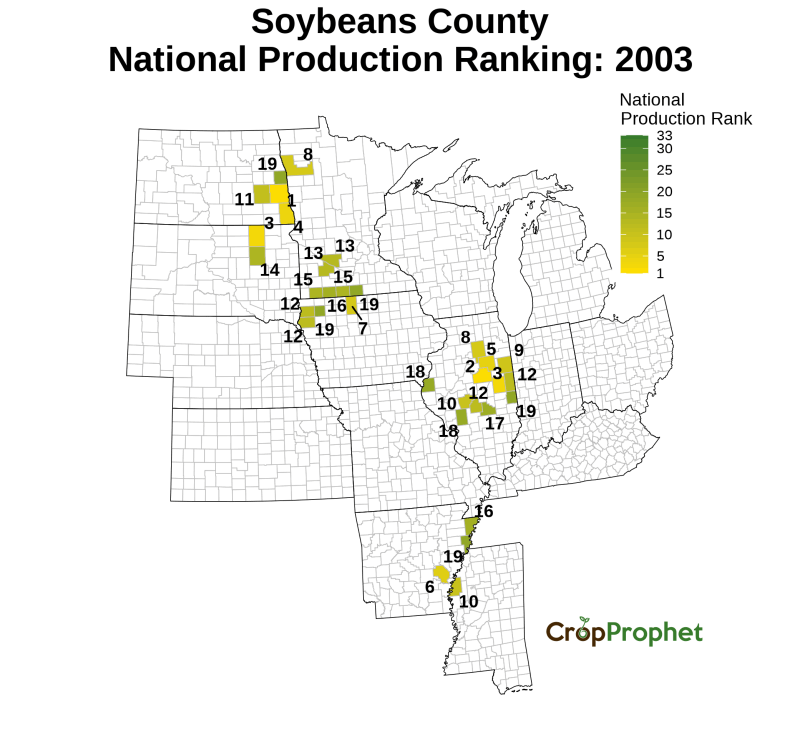
County Soybean County National Production Ranking – 2003
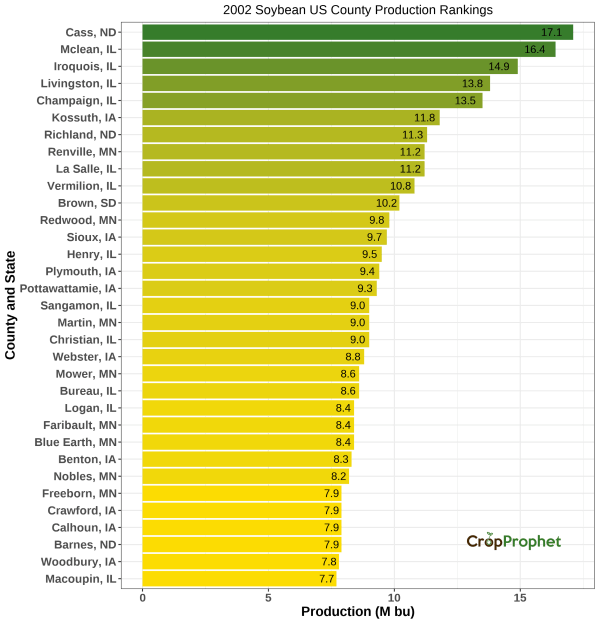
Soybean Production by County: Top 33 of 2002
The top 33 soybeans-producing counties (and their total production) of 2002 was:
| County Production Rankings: 2002 | ||
| Rank | County, State | Production (M bu) |
|---|---|---|
| 1 | Cass, ND | 17.1 |
| 2 | Mclean, IL | 16.4 |
| 3 | Iroquois, IL | 14.9 |
| 4 | Livingston, IL | 13.8 |
| 5 | Champaign, IL | 13.5 |
| 6 | Kossuth, IA | 11.8 |
| 7 | Richland, ND | 11.3 |
| 8 | Renville, MN | 11.2 |
| 8 | La Salle, IL | 11.2 |
| 9 | Vermilion, IL | 10.8 |
| 10 | Brown, SD | 10.2 |
| 11 | Redwood, MN | 9.8 |
| 12 | Sioux, IA | 9.7 |
| 13 | Henry, IL | 9.5 |
| 14 | Plymouth, IA | 9.4 |
| 15 | Pottawattamie, IA | 9.3 |
| 16 | Martin, MN | 9.0 |
| 16 | Sangamon, IL | 9.0 |
| 16 | Christian, IL | 9.0 |
| 17 | Webster, IA | 8.8 |
| 18 | Mower, MN | 8.6 |
| 18 | Bureau, IL | 8.6 |
| 19 | Logan, IL | 8.4 |
| 19 | Blue Earth, MN | 8.4 |
| 19 | Faribault, MN | 8.4 |
| 20 | Benton, IA | 8.3 |
| 21 | Nobles, MN | 8.2 |
| 22 | Freeborn, MN | 7.9 |
| 22 | Crawford, IA | 7.9 |
| 22 | Barnes, ND | 7.9 |
| 22 | Calhoun, IA | 7.9 |
| 23 | Woodbury, IA | 7.8 |
| 24 | Macoupin, IL | 7.7 |
County Soybean Production – 2002
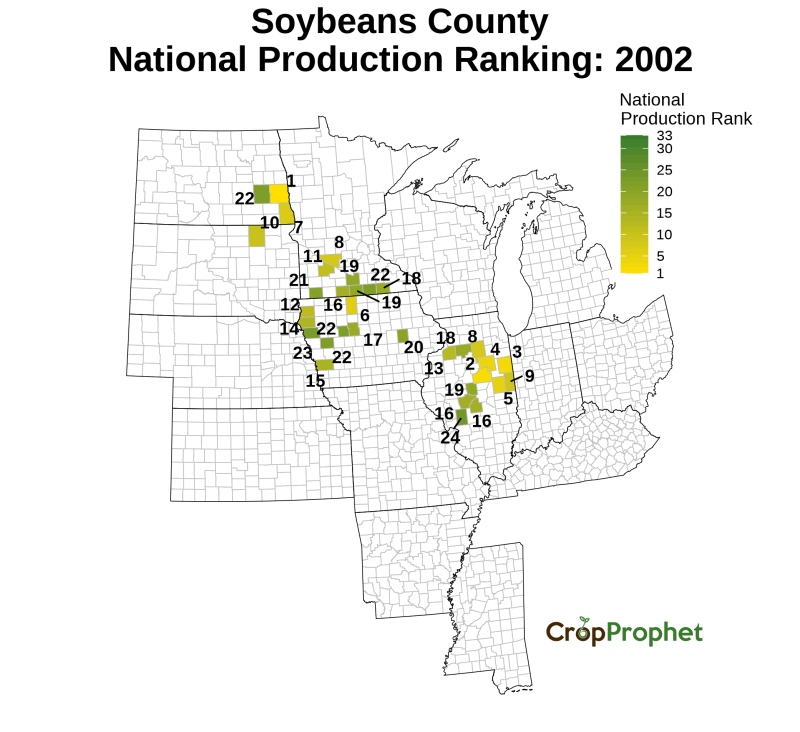
County Soybean County National Production Ranking – 2002
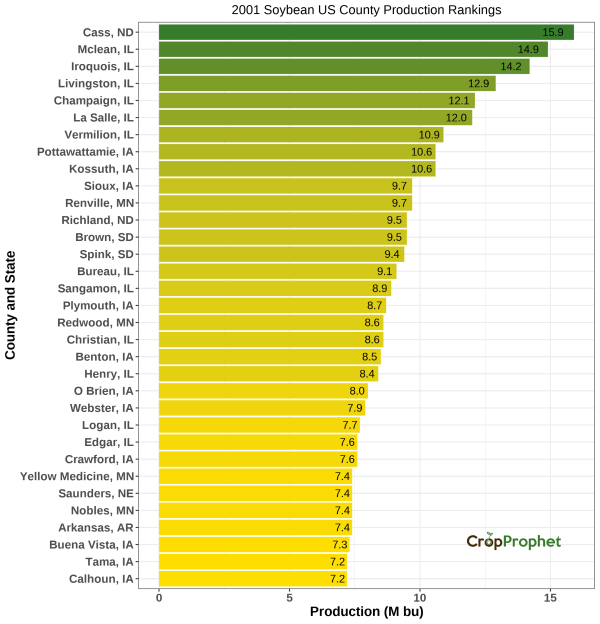
Soybean Production by County: Top 33 of 2001
The top 33 soybeans-producing counties (and their total production) of 2001 was:
| County Production Rankings: 2001 | ||
| Rank | County, State | Production (M bu) |
|---|---|---|
| 1 | Cass, ND | 15.9 |
| 2 | Mclean, IL | 14.9 |
| 3 | Iroquois, IL | 14.2 |
| 4 | Livingston, IL | 12.9 |
| 5 | Champaign, IL | 12.1 |
| 6 | La Salle, IL | 12.0 |
| 7 | Vermilion, IL | 10.9 |
| 8 | Kossuth, IA | 10.6 |
| 8 | Pottawattamie, IA | 10.6 |
| 9 | Renville, MN | 9.7 |
| 9 | Sioux, IA | 9.7 |
| 10 | Brown, SD | 9.5 |
| 10 | Richland, ND | 9.5 |
| 11 | Spink, SD | 9.4 |
| 12 | Bureau, IL | 9.1 |
| 13 | Sangamon, IL | 8.9 |
| 14 | Plymouth, IA | 8.7 |
| 15 | Redwood, MN | 8.6 |
| 15 | Christian, IL | 8.6 |
| 16 | Benton, IA | 8.5 |
| 17 | Henry, IL | 8.4 |
| 18 | O Brien, IA | 8.0 |
| 19 | Webster, IA | 7.9 |
| 20 | Logan, IL | 7.7 |
| 21 | Crawford, IA | 7.6 |
| 21 | Edgar, IL | 7.6 |
| 22 | Arkansas, AR | 7.4 |
| 22 | Saunders, NE | 7.4 |
| 22 | Nobles, MN | 7.4 |
| 22 | Yellow Medicine, MN | 7.4 |
| 23 | Buena Vista, IA | 7.3 |
| 24 | Calhoun, IA | 7.2 |
| 24 | Tama, IA | 7.2 |
County Soybean Production – 2001
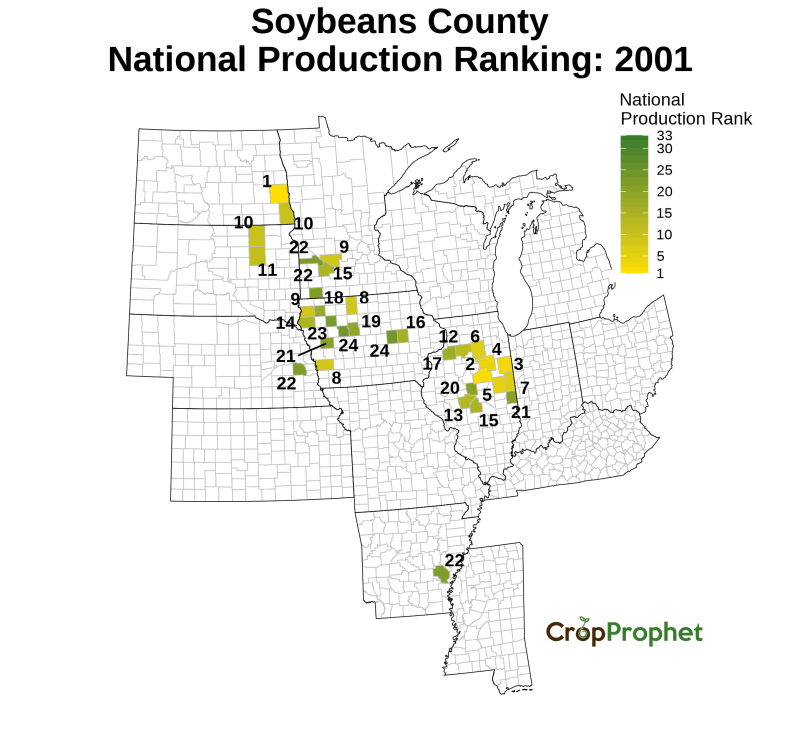
County Soybean County National Production Ranking – 2001
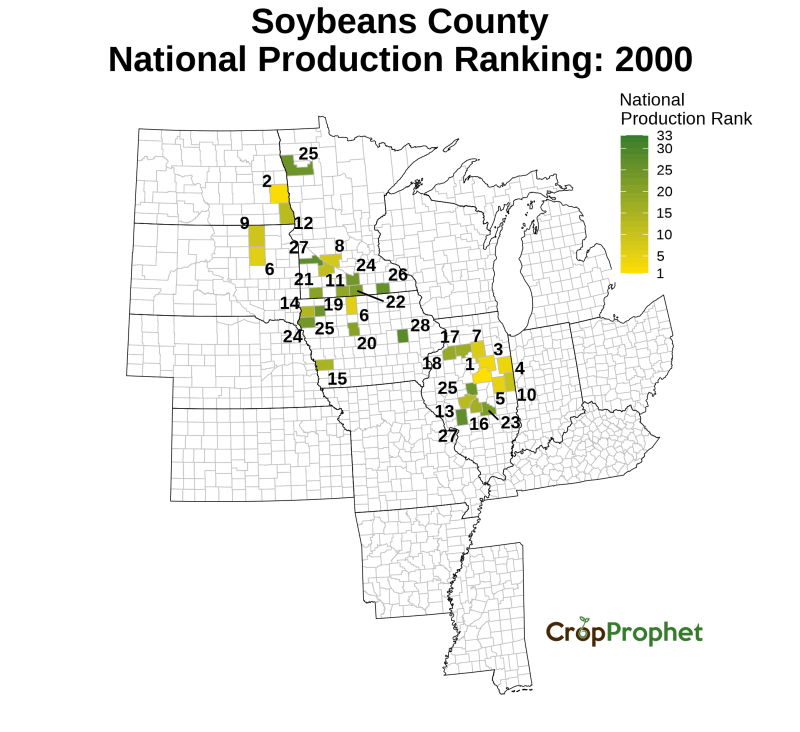
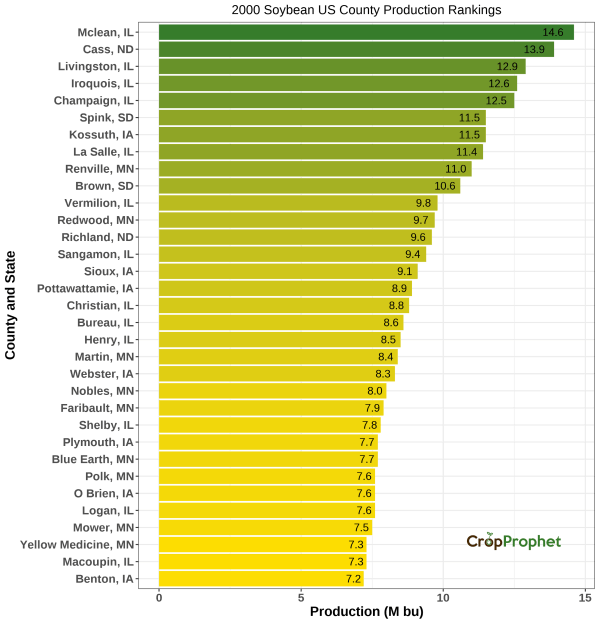
Soybean Production by County: Top 33 of 2000
The top 33 soybeans-producing counties (and their total production) of 2000 was:
| County Production Rankings: 2000 | ||
| Rank | County, State | Production (M bu) |
|---|---|---|
| 1 | Mclean, IL | 14.6 |
| 2 | Cass, ND | 13.9 |
| 3 | Livingston, IL | 12.9 |
| 4 | Iroquois, IL | 12.6 |
| 5 | Champaign, IL | 12.5 |
| 6 | Spink, SD | 11.5 |
| 6 | Kossuth, IA | 11.5 |
| 7 | La Salle, IL | 11.4 |
| 8 | Renville, MN | 11.0 |
| 9 | Brown, SD | 10.6 |
| 10 | Vermilion, IL | 9.8 |
| 11 | Redwood, MN | 9.7 |
| 12 | Richland, ND | 9.6 |
| 13 | Sangamon, IL | 9.4 |
| 14 | Sioux, IA | 9.1 |
| 15 | Pottawattamie, IA | 8.9 |
| 16 | Christian, IL | 8.8 |
| 17 | Bureau, IL | 8.6 |
| 18 | Henry, IL | 8.5 |
| 19 | Martin, MN | 8.4 |
| 20 | Webster, IA | 8.3 |
| 21 | Nobles, MN | 8.0 |
| 22 | Faribault, MN | 7.9 |
| 23 | Shelby, IL | 7.8 |
| 24 | Blue Earth, MN | 7.7 |
| 24 | Plymouth, IA | 7.7 |
| 25 | Logan, IL | 7.6 |
| 25 | O Brien, IA | 7.6 |
| 25 | Polk, MN | 7.6 |
| 26 | Mower, MN | 7.5 |
| 27 | Yellow Medicine, MN | 7.3 |
| 27 | Macoupin, IL | 7.3 |
| 28 | Benton, IA | 7.2 |
County Soybean Production – 2000
County Soybean County National Production Ranking – 2000