The Corn Crop and Drought
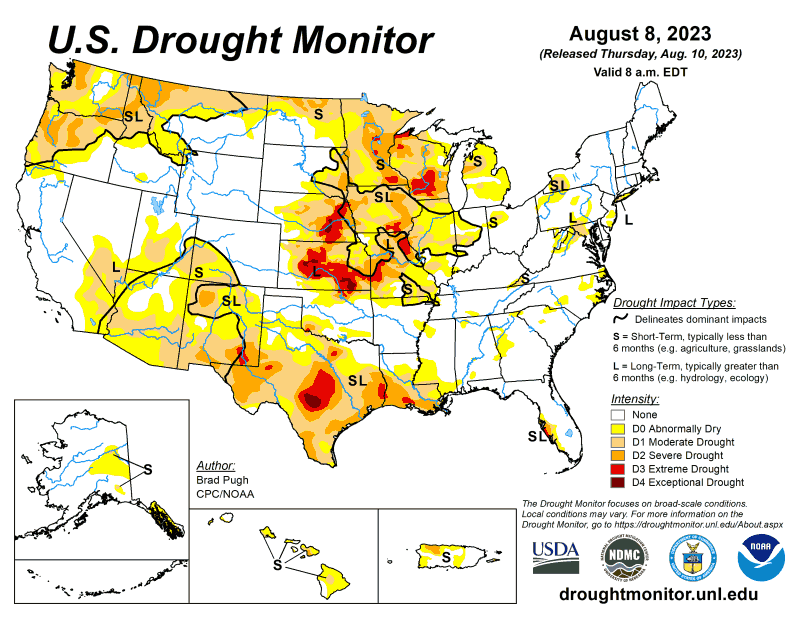
Droughts and their potential impact on the corn crop have recently been featured in agriculture news outlets. Growing corn drought conditions in the upper Midwest are stressing the crop early in the 2023 season because of low soil moisture due to a historic precipitation deficit. In fact, this drought caused the Mississippi River water level to drop to heights that negatively impacted Mississippi River shipment volumes. The August 8, 2023 US Drought Monitor update (released on August 10th) depicts broad areas of the midwestern US currently experiencing a range of drought conditions. As a result, grain market participants are monitoring for the possibility of drought-busting precipitation forecasts.
In this post, we highlight the impact of drought on corn yield at the national and state scale. To facilitate understanding the extent of drought impacts on the corn crop, we’ve transformed this drought data into a drought index.
Corn Drought Index
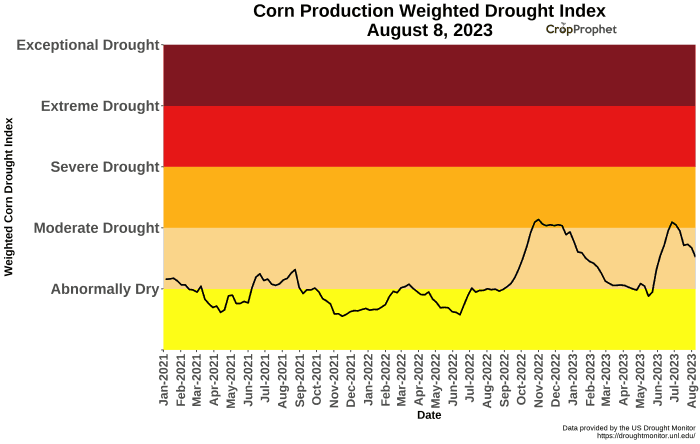
We’ve calculated a corn production weighted drought index using the US Drought Monitor county-level data. Considering the amount of corn each county in the US contributes to total national corn production allows us to reduce the map of data to a single number. In this case, the extent to which drought is impacting the US corn crop.

Corn Drought Index History
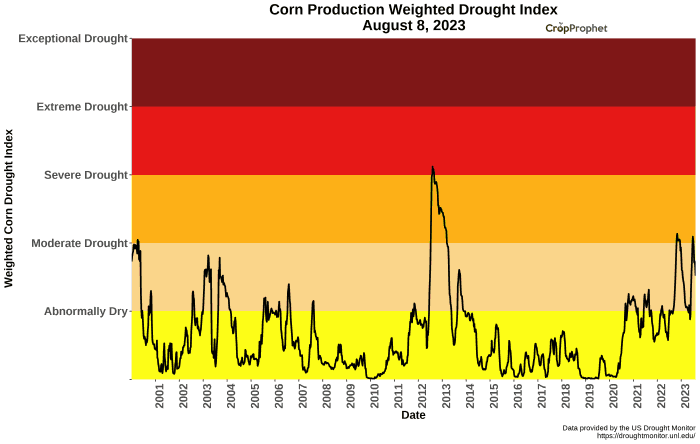
The drought monitor started in 2000 and has been produced each week since, which allows us to examine a 23-year history of drought data across the corn belt. A historical view of the US corn drought index suggests the current conditions are relatively mild compared to the drought of 2012. The current index value, while elevated, is not unusual in a historical context.
Drought Impact on the US Corn Crop
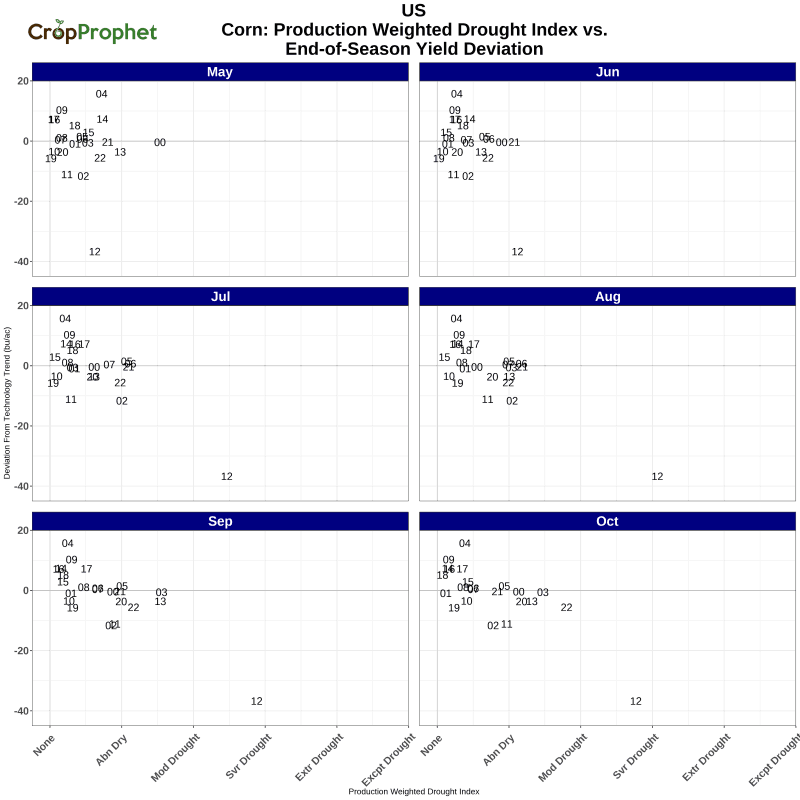
The weekly updated drought index can be averaged into monthly index values. We combine the monthly averaged drought index with the end-of-season USDA corn yield estimates, normalized to account for the impact of the technology trends. To better understand the corn crop’s sensitivity to drought, we calculate the deviation of the end-of-season corn yield from it’s technology trend.
The monthly averaged drought index by month vs. the end of seasonal yield deviation is shown below for each month of the crop season. The two-digit numbers indicate the year of the drought index, which facilitates examining the impact of drought conditions on the final crop yields. Clearly 2012 stick out as the most significant drought year with conditions approaching extreme drought in August.
Drought Impact on the Corn Crop: Key States
The same analysis can be applied to key corn-producing states. We use state-specific crop production weightings to calculate the drought index rather than the national crop production weighting.
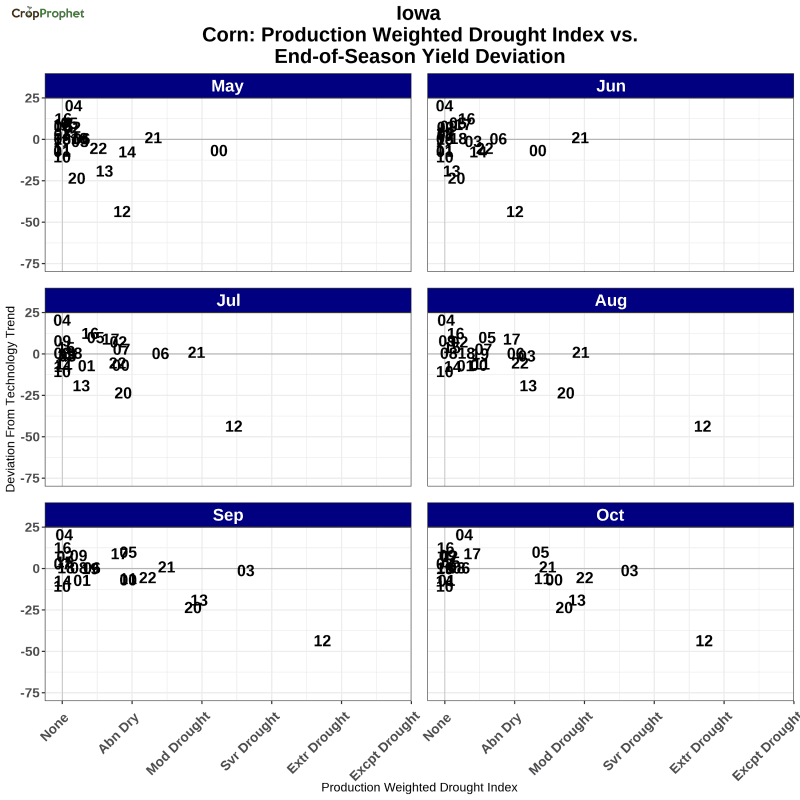
Corn Drought Stress: Impact on Iowa
Iowa is consistently the top US producer of corn. An extended drought in Iowa has the potential to materially impact the national corn yield and production. The graphic shows that 2012 and secondarily 2006 were the only droughts in the moderate category (index > 1) or above. In fact, 2000, 2007, and 2002 each had July drought index values just below the moderate conditions but the end of season yields are either near or greater than zero. In fact, the early months of the crop 2000 crop season experienced significant drought (index approximately equal to 2) but the crop recovered and only suffered a minor negative yield deviation. Mid-summer drought conditions must be quite significant to materially impact the crop.
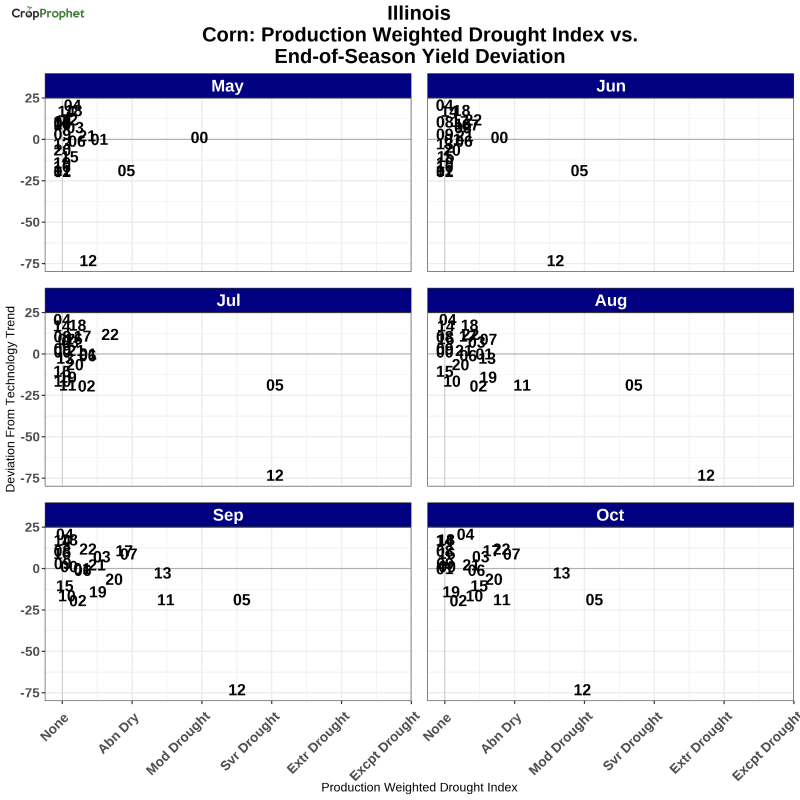
Corn Drought Stress: Impact on Illinois
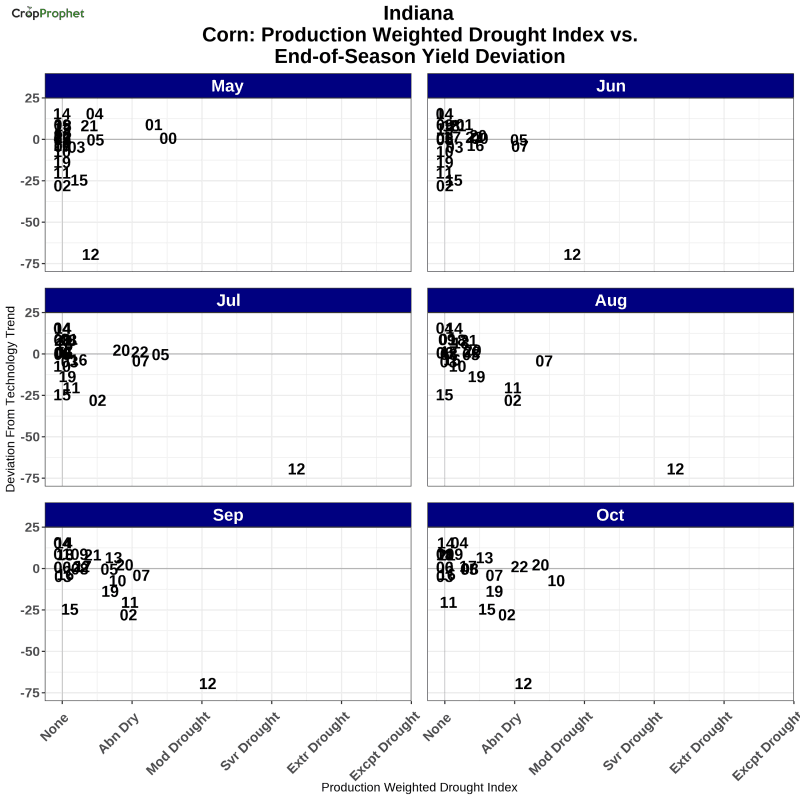
Corn Drought Stress: Impact on Indiana
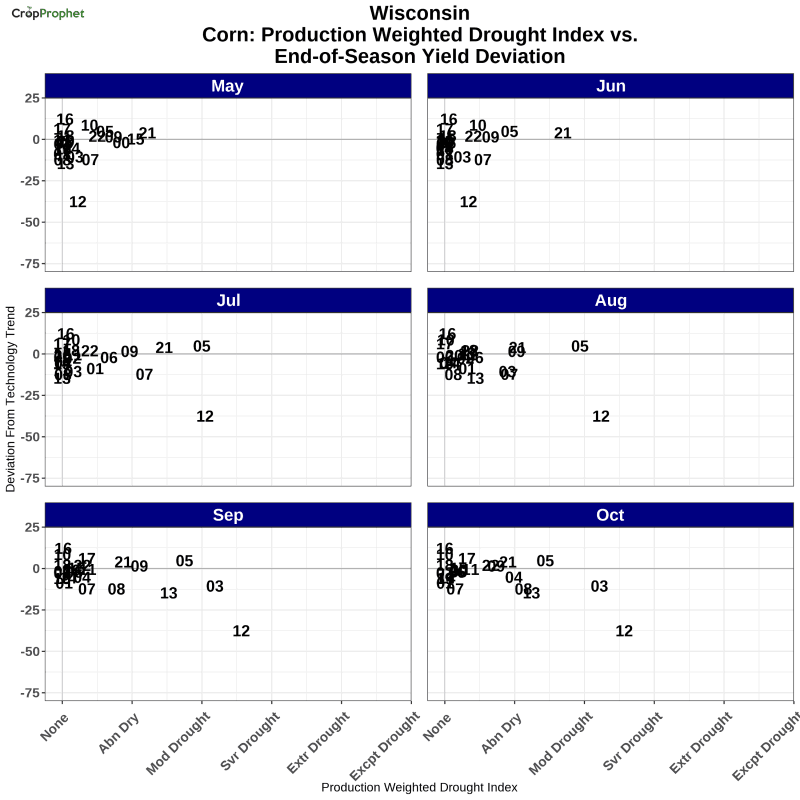
Corn Drought Stress: Impact on Wisconsin
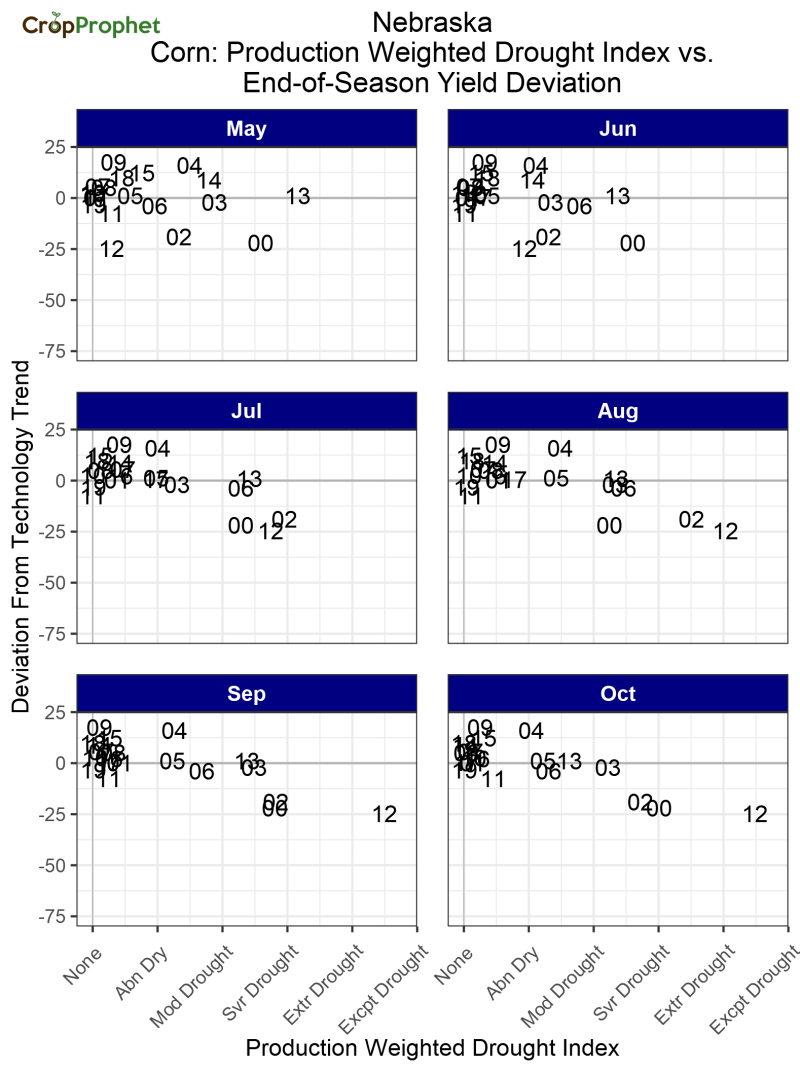
Corn Drought Stress: Impact on Nebraska
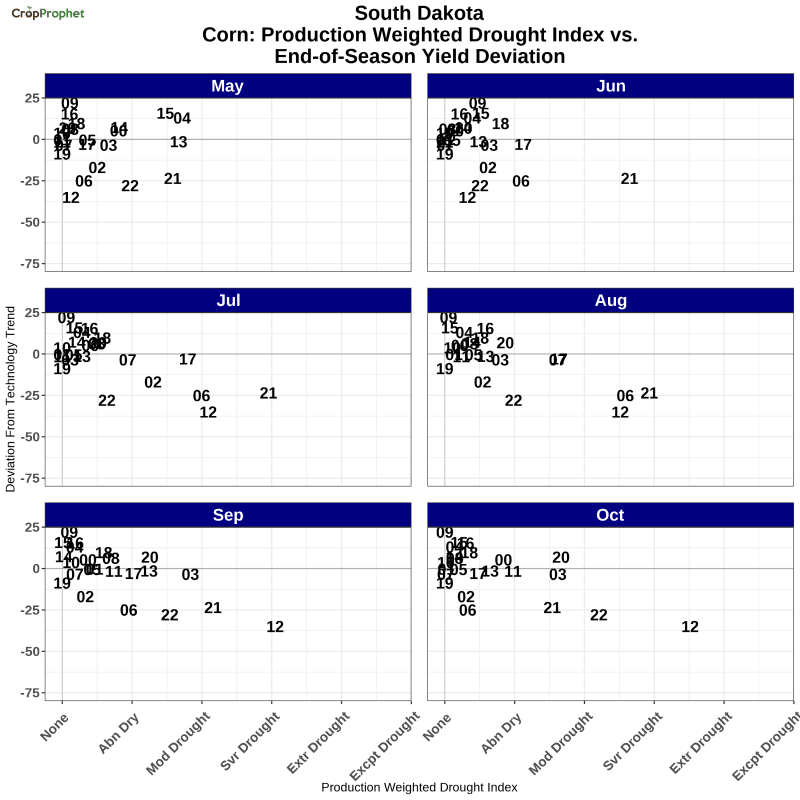
Corn Drought Stress: Impact on South Dakota
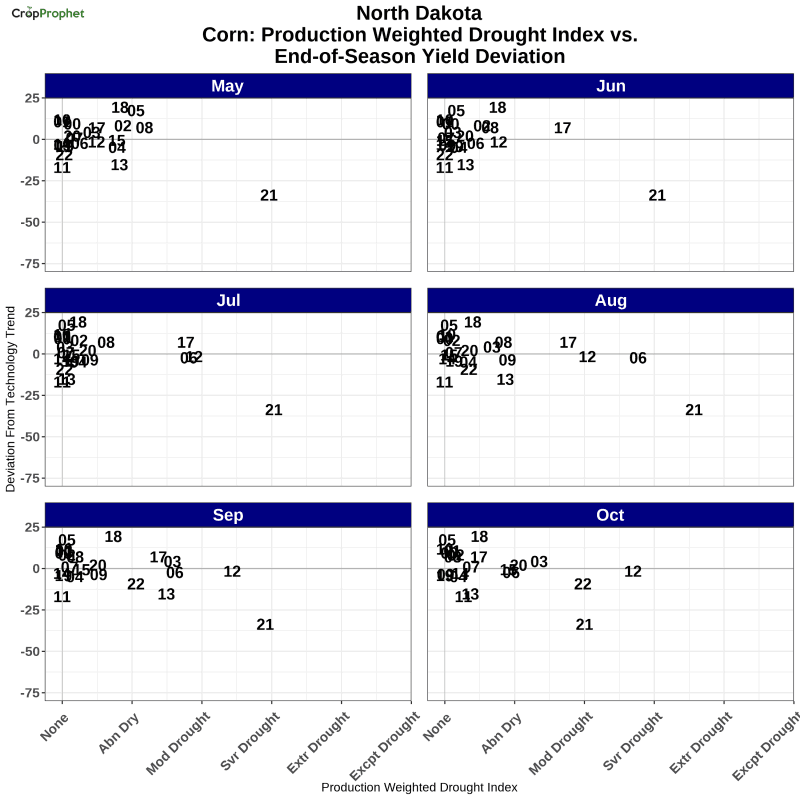
Corn Drought Stress: Impact on North Dakota
Corn Crop Drought: Conclusion
It comes as no surprise the effect of drought is to negatively impact corn yield potential and therefore corn production. However, the data suggest that drought conditions during the months of July and August are most important. For example, in 2017 North Dakota experienced a June drought index of approximately 1.5 but the corn yield ended the season above the technology trend. Recovery of the US corn crop is still possible in 2021, but only if the drought is broken.
CropProphet quantifies the impact of weather on grain crops. While drought conditions are not a direct input to our corn yield forecast model, the weather conditions that lead to drought are. CropProphet’s daily updating grain yield and production forecasts ensure your trade positions are not caught off guard by a rapidly developing drought.