Soybean Planted Acres by State
The USDA NASS makes a wealth of data available. CropProphet uses a wide range of historical USDA NASS data to create the CropProphet corn, soybean, and winter wheat yield and production forecasts.
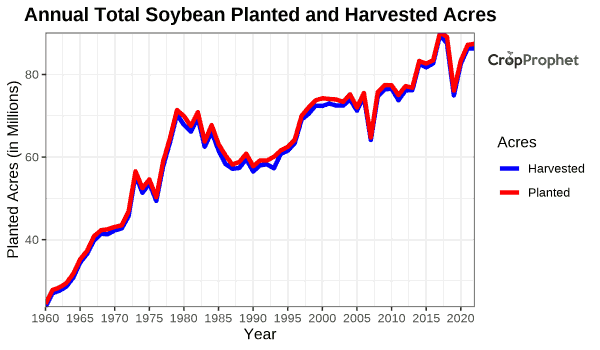
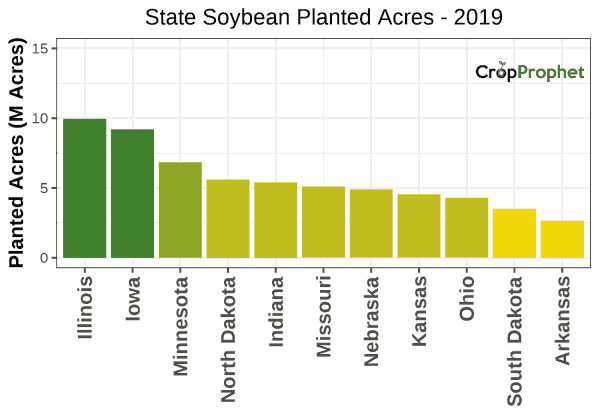
Our yield and production forecasting methodology is similar for both corn and soybeans. A recent post discussed the fact that forecasts corn production is a function of planted acres and yield. Soybeans are, of course, no different. In this post, we provide a history of the state rankings of soybean planted acres by state from 2000 to 2019. In 2019, 76.1 million acres of soybeans were planted in the United States, as shown below. Of that 67.1 million planted acres of soybean in 2019, Illinois planted the greatest acreage at just under 10 million acres or 13% of the national total.
The information below provides the ranking of soybean planted acres by state for each year from 2000 to 2019.

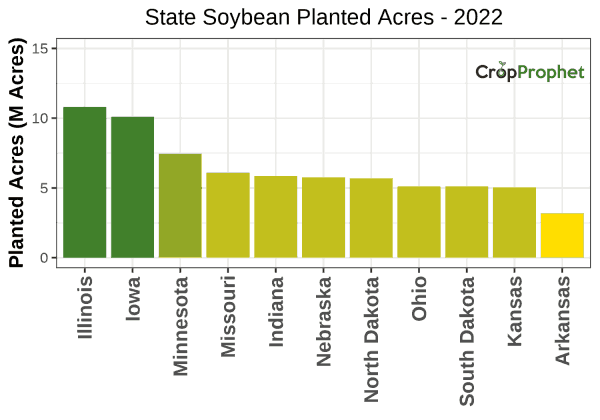
Soybean Planted Acres by State: Top 11 of 2022
The top 11 state soybean planted acres of 2022 were:
| Planted Acre Rankings: 2022 | ||
| Rank | State | Planted Acres (M Acres) |
|---|---|---|
| 1 | Illinois | 10.80 |
| 2 | Iowa | 10.10 |
| 3 | Minnesota | 7.45 |
| 4 | Missouri | 6.10 |
| 5 | Indiana | 5.85 |
| 6 | Nebraska | 5.75 |
| 7 | North Dakota | 5.70 |
| 8 | Ohio | 5.10 |
| 8 | South Dakota | 5.10 |
| 10 | Kansas | 5.05 |
| 11 | Arkansas | 3.18 |
State Soybean Planted Acres – 2022
Soybean Planted Acres by State: Top 11 of 2021
The top 11 state soybean planted acres of 2021 were:
| Planted Acre Rankings: 2021 | ||
| Rank | State | Planted Acres (M Acres) |
|---|---|---|
| 1 | Illinois | 10.60 |
| 2 | Iowa | 10.10 |
| 3 | Minnesota | 7.65 |
| 4 | North Dakota | 7.25 |
| 5 | Missouri | 5.70 |
| 6 | Indiana | 5.65 |
| 7 | Nebraska | 5.60 |
| 8 | South Dakota | 5.45 |
| 9 | Ohio | 4.90 |
| 10 | Kansas | 4.85 |
| 11 | Arkansas | 3.04 |
State Soybean Planted Acres – 2021

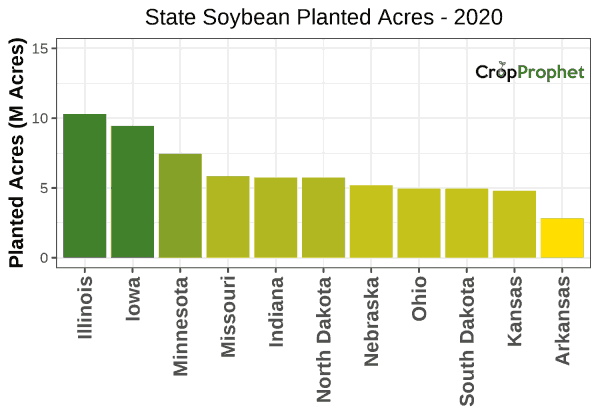
Soybean Planted Acres by State: Top 11 of 2020
The top 11 state soybean planted acres of 2020 were:
| Planted Acre Rankings: 2020 | ||
| Rank | State | Planted Acres (M Acres) |
|---|---|---|
| 1 | Illinois | 10.30 |
| 2 | Iowa | 9.45 |
| 3 | Minnesota | 7.45 |
| 4 | Missouri | 5.85 |
| 5 | Indiana | 5.75 |
| 5 | North Dakota | 5.75 |
| 7 | Nebraska | 5.20 |
| 8 | Ohio | 4.95 |
| 8 | South Dakota | 4.95 |
| 10 | Kansas | 4.80 |
| 11 | Arkansas | 2.82 |
State Soybean Planted Acres – 2020
Soybean Planted Acres by State: Top 11 of 2019
The top 11 state soybean planted acres of 2019 were:
| Planted Acre Rankings: 2019 | ||
| Rank | State | Planted Acres (M Acres) |
|---|---|---|
| 1 | Illinois | 9.95 |
| 2 | Iowa | 9.20 |
| 3 | Minnesota | 6.85 |
| 4 | North Dakota | 5.60 |
| 5 | Indiana | 5.40 |
| 6 | Missouri | 5.10 |
| 7 | Nebraska | 4.90 |
| 8 | Kansas | 4.55 |
| 9 | Ohio | 4.30 |
| 10 | South Dakota | 3.50 |
| 11 | Arkansas | 2.65 |
State Soybean Planted Acres – 2019
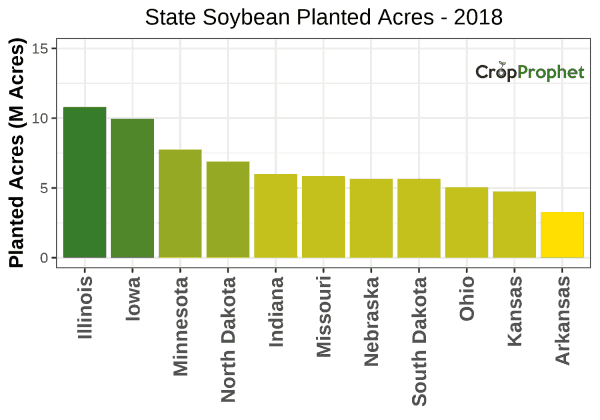
Soybean Planted Acres by State: Top 11 of 2018
The top 11 state soybean planted acres of 2018 were:
| Planted Acre Rankings: 2018 | ||
| Rank | State | Planted Acres (M Acres) |
|---|---|---|
| 1 | Illinois | 10.80 |
| 2 | Iowa | 9.95 |
| 3 | Minnesota | 7.75 |
| 4 | North Dakota | 6.90 |
| 5 | Indiana | 6.00 |
| 6 | Missouri | 5.85 |
| 7 | Nebraska | 5.65 |
| 7 | South Dakota | 5.65 |
| 9 | Ohio | 5.05 |
| 10 | Kansas | 4.75 |
| 11 | Arkansas | 3.27 |
State Soybean Planted Acres – 2018
Soybean Planted Acres by State: Top 11 of 2017
The top 11 state soybean planted acres of 2017 were:
| Planted Acre Rankings: 2017 | ||
| Rank | State | Planted Acres (M Acres) |
|---|---|---|
| 1 | Illinois | 10.60 |
| 2 | Iowa | 10.00 |
| 3 | Minnesota | 8.15 |
| 4 | North Dakota | 7.10 |
| 5 | Indiana | 5.95 |
| 5 | Missouri | 5.95 |
| 7 | Nebraska | 5.70 |
| 8 | South Dakota | 5.65 |
| 9 | Kansas | 5.15 |
| 10 | Ohio | 5.10 |
| 11 | Arkansas | 3.53 |
State Soybean Planted Acres – 2017

Soybean Planted Acres by State: Top 11 of 2016
The top 11 state soybean planted acres of 2016 were:
| Planted Acre Rankings: 2016 | ||
| Rank | State | Planted Acres (M Acres) |
|---|---|---|
| 1 | Illinois | 10.10 |
| 2 | Iowa | 9.50 |
| 3 | Minnesota | 7.55 |
| 4 | North Dakota | 6.05 |
| 5 | Indiana | 5.65 |
| 6 | Missouri | 5.60 |
| 7 | Nebraska | 5.20 |
| 7 | South Dakota | 5.20 |
| 9 | Ohio | 4.85 |
| 10 | Kansas | 4.05 |
| 11 | Arkansas | 3.13 |
State Soybean Planted Acres – 2016

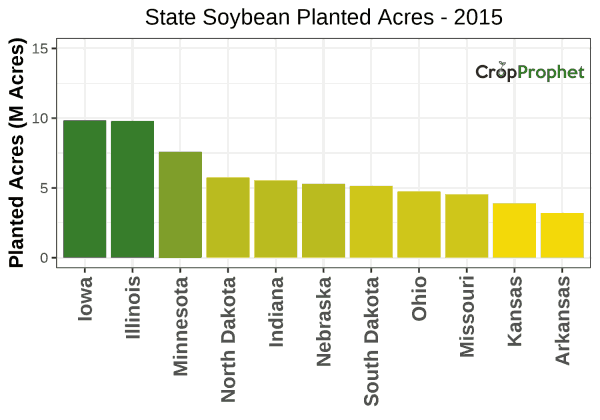
Soybean Planted Acres by State: Top 11 of 2015
The top 11 state soybean planted acres of 2015 were:
| Planted Acre Rankings: 2015 | ||
| Rank | State | Planted Acres (M Acres) |
|---|---|---|
| 1 | Iowa | 9.85 |
| 2 | Illinois | 9.80 |
| 3 | Minnesota | 7.60 |
| 4 | North Dakota | 5.75 |
| 5 | Indiana | 5.55 |
| 6 | Nebraska | 5.30 |
| 7 | South Dakota | 5.15 |
| 8 | Ohio | 4.75 |
| 9 | Missouri | 4.55 |
| 10 | Kansas | 3.90 |
| 11 | Arkansas | 3.20 |
State Soybean Planted Acres – 2015
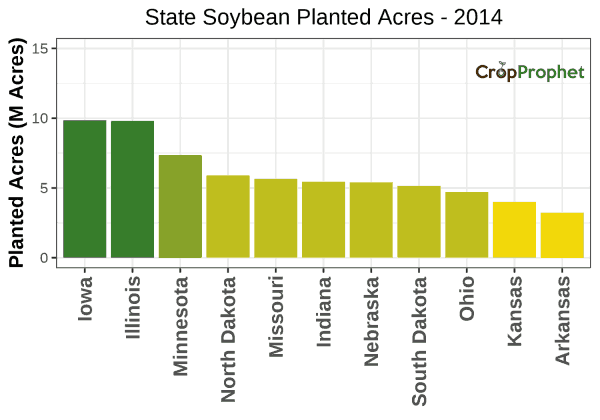
Soybean Planted Acres by State: Top 11 of 2014
The top 11 state soybean planted acres of 2014 were:
| Planted Acre Rankings: 2014 | ||
| Rank | State | Planted Acres (M Acres) |
|---|---|---|
| 1 | Iowa | 9.85 |
| 2 | Illinois | 9.80 |
| 3 | Minnesota | 7.35 |
| 4 | North Dakota | 5.90 |
| 5 | Missouri | 5.65 |
| 6 | Indiana | 5.45 |
| 7 | Nebraska | 5.40 |
| 8 | South Dakota | 5.15 |
| 9 | Ohio | 4.70 |
| 10 | Kansas | 4.00 |
| 11 | Arkansas | 3.23 |
State Soybean Planted Acres – 2014
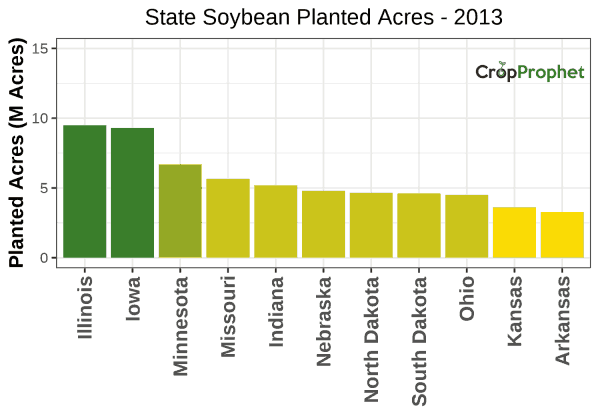
Soybean Planted Acres by State: Top 11 of 2013
The top 11 state soybean planted acres of 2013 were:
| Planted Acre Rankings: 2013 | ||
| Rank | State | Planted Acres (M Acres) |
|---|---|---|
| 1 | Illinois | 9.50 |
| 2 | Iowa | 9.30 |
| 3 | Minnesota | 6.70 |
| 4 | Missouri | 5.65 |
| 5 | Indiana | 5.20 |
| 6 | Nebraska | 4.80 |
| 7 | North Dakota | 4.65 |
| 8 | South Dakota | 4.60 |
| 9 | Ohio | 4.50 |
| 10 | Kansas | 3.60 |
| 11 | Arkansas | 3.27 |
State Soybean Planted Acres – 2013
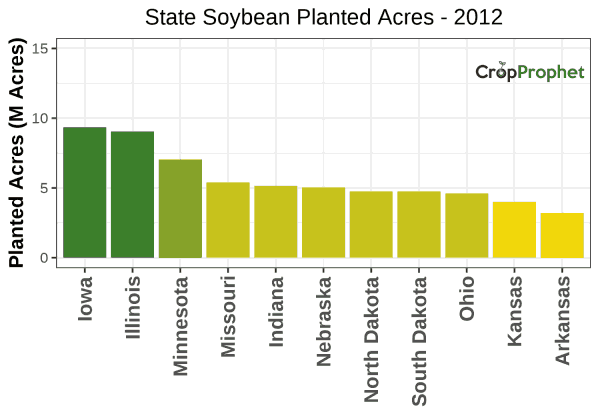
Soybean Planted Acres by State: Top 11 of 2012
The top 11 state soybean planted acres of 2012 were:
| Planted Acre Rankings: 2012 | ||
| Rank | State | Planted Acres (M Acres) |
|---|---|---|
| 1 | Iowa | 9.35 |
| 2 | Illinois | 9.05 |
| 3 | Minnesota | 7.05 |
| 4 | Missouri | 5.40 |
| 5 | Indiana | 5.15 |
| 6 | Nebraska | 5.05 |
| 7 | North Dakota | 4.75 |
| 7 | South Dakota | 4.75 |
| 9 | Ohio | 4.60 |
| 10 | Kansas | 4.00 |
| 11 | Arkansas | 3.20 |
State Soybean Planted Acres – 2012
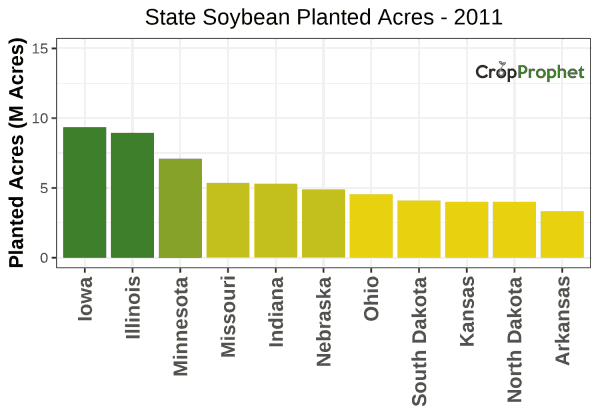
Soybean Planted Acres by State: Top 11 of 2011
The top 11 state soybean planted acres of 2011 were:
| Planted Acre Rankings: 2011 | ||
| Rank | State | Planted Acres (M Acres) |
|---|---|---|
| 1 | Iowa | 9.35 |
| 2 | Illinois | 8.95 |
| 3 | Minnesota | 7.10 |
| 4 | Missouri | 5.35 |
| 5 | Indiana | 5.30 |
| 6 | Nebraska | 4.90 |
| 7 | Ohio | 4.55 |
| 8 | South Dakota | 4.10 |
| 9 | Kansas | 4.00 |
| 9 | North Dakota | 4.00 |
| 11 | Arkansas | 3.33 |
State Soybean Planted Acres – 2011
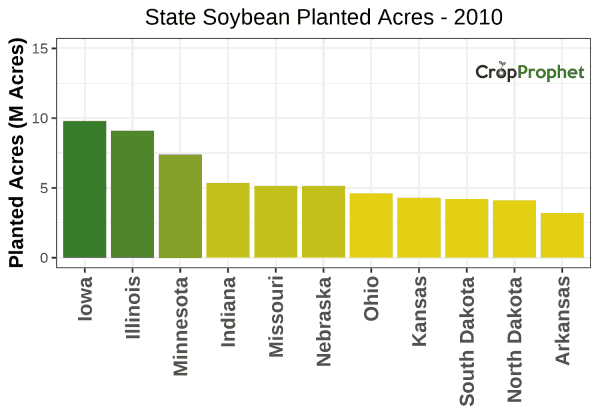
Soybean Planted Acres by State: Top 11 of 2010
The top 11 state soybean planted acres of 2010 were:
| Planted Acre Rankings: 2010 | ||
| Rank | State | Planted Acres (M Acres) |
|---|---|---|
| 1 | Iowa | 9.80 |
| 2 | Illinois | 9.10 |
| 3 | Minnesota | 7.40 |
| 4 | Indiana | 5.35 |
| 5 | Missouri | 5.15 |
| 5 | Nebraska | 5.15 |
| 7 | Ohio | 4.60 |
| 8 | Kansas | 4.30 |
| 9 | South Dakota | 4.20 |
| 10 | North Dakota | 4.10 |
| 11 | Arkansas | 3.19 |
State Soybean Planted Acres – 2010
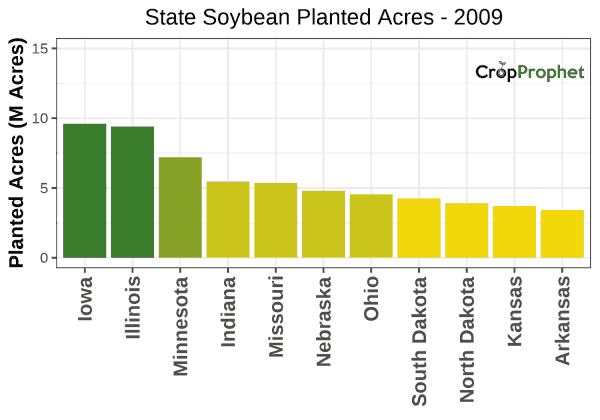
Soybean Planted Acres by State: Top 11 of 2009
The top 11 state soybean planted acres of 2009 were:
| Planted Acre Rankings: 2009 | ||
| Rank | State | Planted Acres (M Acres) |
|---|---|---|
| 1 | Iowa | 9.60 |
| 2 | Illinois | 9.40 |
| 3 | Minnesota | 7.20 |
| 4 | Indiana | 5.45 |
| 5 | Missouri | 5.35 |
| 6 | Nebraska | 4.80 |
| 7 | Ohio | 4.55 |
| 8 | South Dakota | 4.25 |
| 9 | North Dakota | 3.90 |
| 10 | Kansas | 3.70 |
| 11 | Arkansas | 3.42 |
State Soybean Planted Acres – 2009
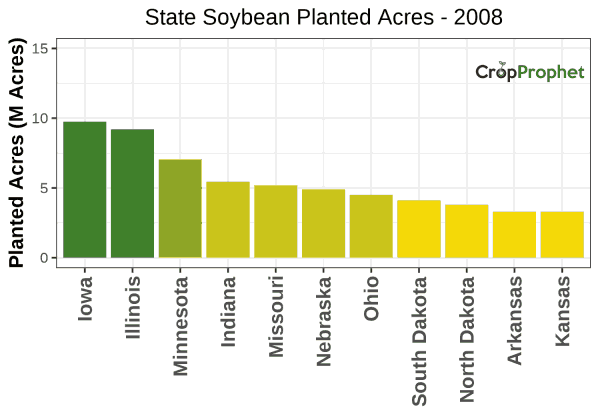
Soybean Planted Acres by State: Top 11 of 2008
The top 11 state soybean planted acres of 2008 were:
| Planted Acre Rankings: 2008 | ||
| Rank | State | Planted Acres (M Acres) |
|---|---|---|
| 1 | Iowa | 9.75 |
| 2 | Illinois | 9.20 |
| 3 | Minnesota | 7.05 |
| 4 | Indiana | 5.45 |
| 5 | Missouri | 5.20 |
| 6 | Nebraska | 4.90 |
| 7 | Ohio | 4.50 |
| 8 | South Dakota | 4.10 |
| 9 | North Dakota | 3.80 |
| 10 | Arkansas | 3.30 |
| 10 | Kansas | 3.30 |
State Soybean Planted Acres – 2008
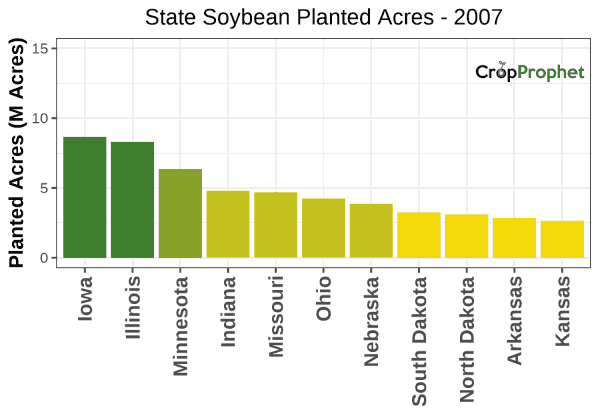
Soybean Planted Acres by State: Top 11 of 2007
The top 11 state soybean planted acres of 2007 were:
| Planted Acre Rankings: 2007 | ||
| Rank | State | Planted Acres (M Acres) |
|---|---|---|
| 1 | Iowa | 8.65 |
| 2 | Illinois | 8.30 |
| 3 | Minnesota | 6.35 |
| 4 | Indiana | 4.80 |
| 5 | Missouri | 4.70 |
| 6 | Ohio | 4.25 |
| 7 | Nebraska | 3.87 |
| 8 | South Dakota | 3.25 |
| 9 | North Dakota | 3.10 |
| 10 | Arkansas | 2.85 |
| 11 | Kansas | 2.65 |
State Soybean Planted Acres – 2007
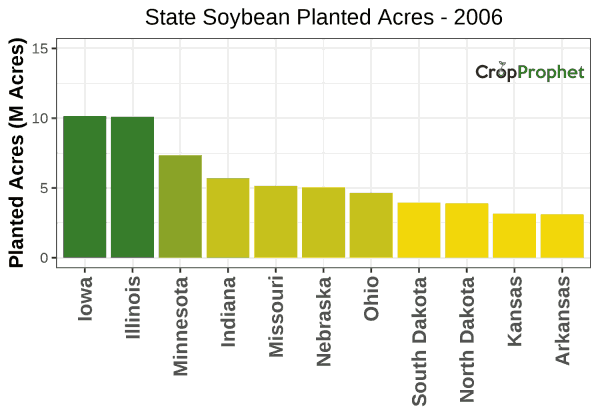
Soybean Planted Acres by State: Top 11 of 2006
The top 11 state soybean planted acres of 2006 were:
| Planted Acre Rankings: 2006 | ||
| Rank | State | Planted Acres (M Acres) |
|---|---|---|
| 1 | Iowa | 10.15 |
| 2 | Illinois | 10.10 |
| 3 | Minnesota | 7.35 |
| 4 | Indiana | 5.70 |
| 5 | Missouri | 5.15 |
| 6 | Nebraska | 5.05 |
| 7 | Ohio | 4.65 |
| 8 | South Dakota | 3.95 |
| 9 | North Dakota | 3.90 |
| 10 | Kansas | 3.15 |
| 11 | Arkansas | 3.11 |
State Soybean Planted Acres – 2006
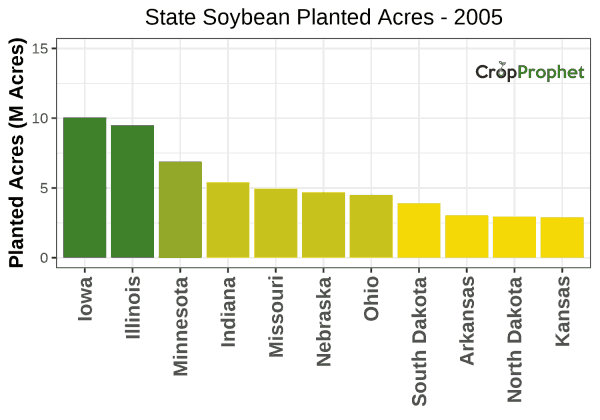
Soybean Planted Acres by State: Top 11 of 2005
The top 11 state soybean planted acres of 2005 were:
| Planted Acre Rankings: 2005 | ||
| Rank | State | Planted Acres (M Acres) |
|---|---|---|
| 1 | Iowa | 10.05 |
| 2 | Illinois | 9.50 |
| 3 | Minnesota | 6.90 |
| 4 | Indiana | 5.40 |
| 5 | Missouri | 4.95 |
| 6 | Nebraska | 4.70 |
| 7 | Ohio | 4.50 |
| 8 | South Dakota | 3.90 |
| 9 | Arkansas | 3.03 |
| 10 | North Dakota | 2.95 |
| 11 | Kansas | 2.90 |
State Soybean Planted Acres – 2005
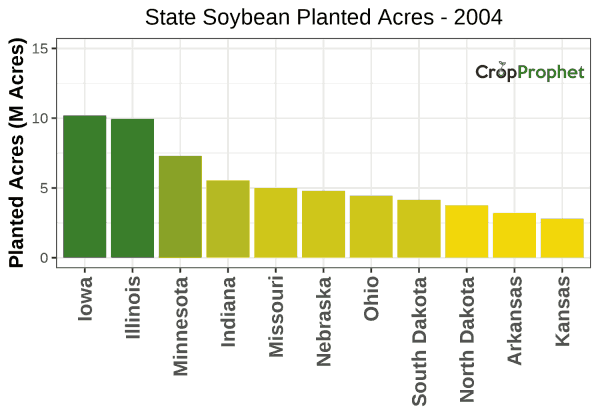
Soybean Planted Acres by State: Top 11 of 2004
The top 11 state soybean planted acres of 2004 were:
| Planted Acre Rankings: 2004 | ||
| Rank | State | Planted Acres (M Acres) |
|---|---|---|
| 1 | Iowa | 10.20 |
| 2 | Illinois | 9.95 |
| 3 | Minnesota | 7.30 |
| 4 | Indiana | 5.55 |
| 5 | Missouri | 5.00 |
| 6 | Nebraska | 4.80 |
| 7 | Ohio | 4.45 |
| 8 | South Dakota | 4.15 |
| 9 | North Dakota | 3.75 |
| 10 | Arkansas | 3.20 |
| 11 | Kansas | 2.80 |
State Soybean Planted Acres – 2004
Soybean Planted Acres by State: Top 11 of 2003
The top 11 state soybean planted acres of 2003 were:
| Planted Acre Rankings: 2003 | ||
| Rank | State | Planted Acres (M Acres) |
|---|---|---|
| 1 | Iowa | 10.60 |
| 2 | Illinois | 10.30 |
| 3 | Minnesota | 7.50 |
| 4 | Indiana | 5.45 |
| 5 | Missouri | 5.00 |
| 6 | Nebraska | 4.55 |
| 7 | Ohio | 4.30 |
| 8 | South Dakota | 4.25 |
| 9 | North Dakota | 3.15 |
| 10 | Arkansas | 2.92 |
| 11 | Kansas | 2.60 |
State Soybean Planted Acres – 2003

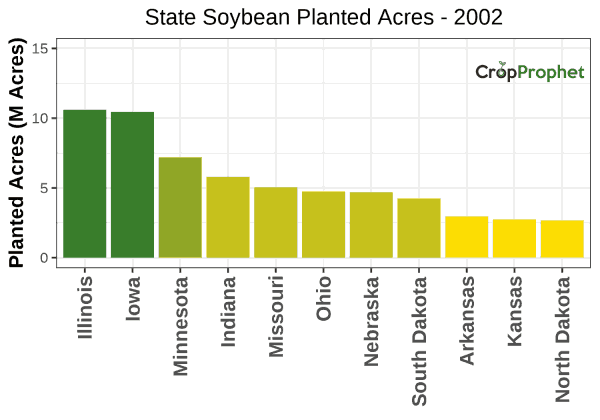
Soybean Planted Acres by State: Top 11 of 2002
The top 11 state soybean planted acres of 2002 were:
| Planted Acre Rankings: 2002 | ||
| Rank | State | Planted Acres (M Acres) |
|---|---|---|
| 1 | Illinois | 10.60 |
| 2 | Iowa | 10.45 |
| 3 | Minnesota | 7.20 |
| 4 | Indiana | 5.80 |
| 5 | Missouri | 5.05 |
| 6 | Ohio | 4.75 |
| 7 | Nebraska | 4.70 |
| 8 | South Dakota | 4.25 |
| 9 | Arkansas | 2.95 |
| 10 | Kansas | 2.75 |
| 11 | North Dakota | 2.67 |
State Soybean Planted Acres – 2002
Soybean Planted Acres by State: Top 11 of 2001
The top 11 state soybean planted acres of 2001 were:
| Planted Acre Rankings: 2001 | ||
| Rank | State | Planted Acres (M Acres) |
|---|---|---|
| 1 | Iowa | 11.00 |
| 2 | Illinois | 10.70 |
| 3 | Minnesota | 7.30 |
| 4 | Indiana | 5.60 |
| 5 | Missouri | 4.95 |
| 5 | Nebraska | 4.95 |
| 7 | Ohio | 4.60 |
| 8 | South Dakota | 4.50 |
| 9 | Arkansas | 2.90 |
| 10 | Kansas | 2.85 |
| 11 | Michigan | 2.15 |
| 11 | North Dakota | 2.15 |
State Soybean Planted Acres – 2001

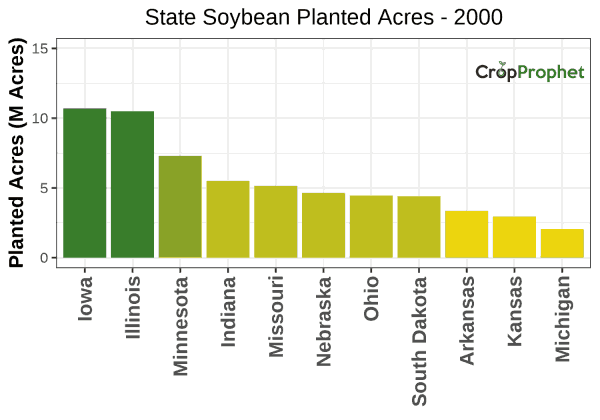
Soybean Planted Acres by State: Top 11 of 2000
The top 11 state soybean planted acres of 2000 were:
| Planted Acre Rankings: 2000 | ||
| Rank | State | Planted Acres (M Acres) |
|---|---|---|
| 1 | Iowa | 10.70 |
| 2 | Illinois | 10.50 |
| 3 | Minnesota | 7.30 |
| 4 | Indiana | 5.50 |
| 5 | Missouri | 5.15 |
| 6 | Nebraska | 4.65 |
| 7 | Ohio | 4.45 |
| 8 | South Dakota | 4.40 |
| 9 | Arkansas | 3.35 |
| 10 | Kansas | 2.95 |
| 11 | Michigan | 2.05 |
State Soybean Planted Acres – 2000
A review of US grain production statistics is also available.