Systematic Grain Trading: An Example Using CropProphet Modeler
Efficient markets theory suggests that grain futures prices represent the instantaneous market perception of the balance between grain supply and demand. A grain trader with advanced knowledge of supply and/or demand changes could profitably trade with that information. The trader can take positions ahead of supply and/or demand-induced price changes. For instance, weather conditions affecting transportation along the Mississippi River could influence supply prices. This type of trading decision-making becomes increasingly possible as alternative data methodologies creep into grain trading.
What is Systematic Grain Trading?
Broadly speaking, there are two types of grain trading. The first is discretionary trading. This type of trading is conducted by a human who is continuously reviewing a wide range of fundamental and technical information and decides to take or exit positions at their discretion. The second type is systematic (or algorithmic) trading. Hedge fund portfolio managers use alternative data to build systematic trading strategies. In this type of trading, a computer algorithm is trained to execute trades based on incoming fundamental or technical market information.
Systematic Grain Trading Strategies
There are many possible grain trading strategies that can be employed to generate a grain trading profit. These include:
- Spread Trading: Buying one grain future (e.g., corn) and selling another (e.g., soybeans) to profit from price differentials.
- Weather-Based Trading: Using weather forecasts to anticipate crop yields and market movements.
- Trend Following: Identifying and trading in the direction of long-term market trends.
- Seasonal Trading: Exploiting recurring seasonal patterns in crop prices.
- Arbitrage: Taking advantage of price discrepancies between different exchanges or markets.
- Hedging: Using futures to protect against price risk in physical grain sales or purchases.
Weather-Based Systematic Grain Trading
CropProphet focuses on providing data to enable weather-based systematic grain trading. For example, CropProphet Modeler provides histories of daily updated, weather-driven corn, soybean, and winter wheat yield forecasts, enabling the development of systematic trading algorithms. It is designed to enable the creation of systematic grain trading algorithms.
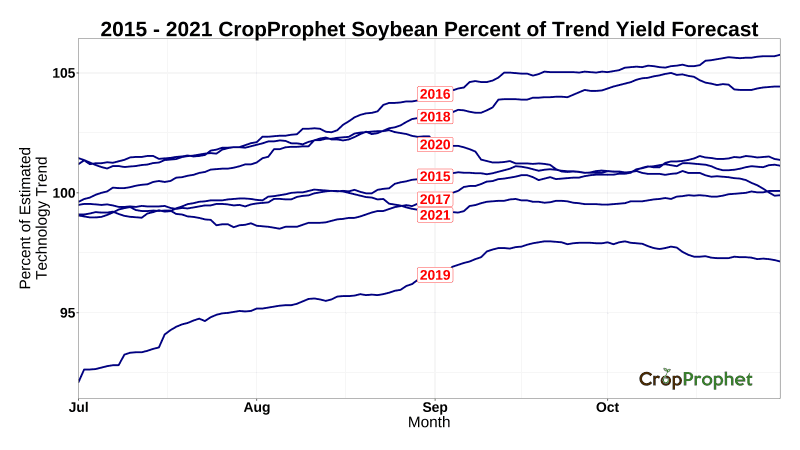
This study provides an example of testing grain trading strategies using CropProphet Modeler. Figure 1 shows a subset of the 38-year history of CropProphet soybean cross-validated yield forecasts. This data, used in conjunction with USDA publicly reported data, is used to explore the trading strategy.
The Systematic Grain Trade
From July to December, the USDA releases estimates of its end-of-season corn and soybean yields near the middle of each month. These estimates are an important indicator of the current market perception of grain supply.
The estimates, however, are not perfect. For example, the September USDA corn yield estimate had a mean average error of 4.7 bu/ac from 1986 to 2021. Corn and soybean market futures prices can react if market participants perceive the USDA estimates are incorrect. The potential error of the USDA forecasts and the market reaction forms the basis of the trade.
The analysis here compares a history of CropProphet corn and soybean yield forecasts relative to the USDA mid-month estimates. If the CropProphet forecast is greater than the USDA estimate, then we assume that the USDA underestimated crop yield and production. We hypothesize that prices will fall because the market will eventually perceive greater crop production. We would short corn futures to profit from the expected price change in this scenario.
Likewise, suppose the CropProphet forecast is less than the USDA estimate. In that case, we assume the USDA has overestimated crop production, and we hypothesize that futures prices will rise because the market will eventually realize that the USDA has overestimated production. In this scenario, we would be long the futures prices.
Figure 2 below shows an example of the yield forecast comparison for 2020. In each case, the USDA estimated yield is greater than the CropProphet yield.
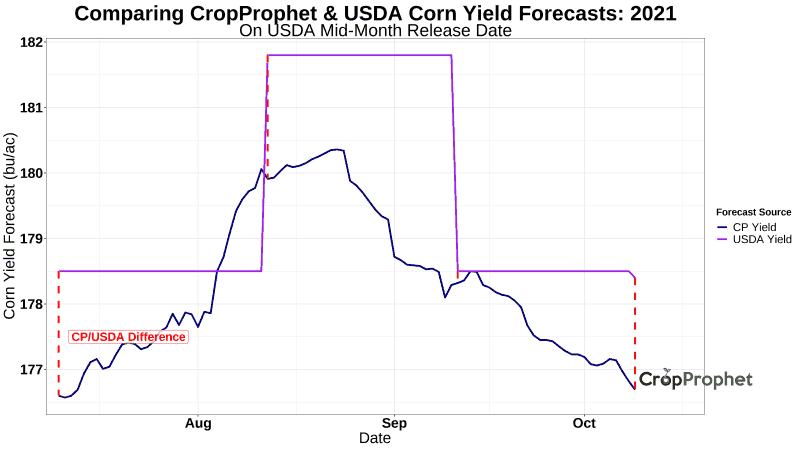
Our hypothetical trade also includes a rule that the difference between the CropProphet and USDA estimates must be +/- 1% of the USDA estimated crop yield. If the threshold is not met, a breakeven return is recorded.
In both the long and short trade scenarios, the position is entered into on the day of the USDA crop yield forecast and closed out on December 1 or the first open market day in December. No leverage is assumed.
In summary, the criteria of the yield forecast-based grain trade are summarized as:
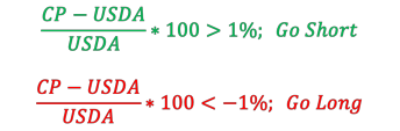
CP and USDA represent their respective yield forecasts on the USDA estimates for the in-season release date.

CropProphet and USDA Corn Yield Forecast Differences
Our model examines the full history of available history of CropProphet corn and soybean yield forecasts from 1986 to 2021. Figure 3, below, shows the history of CropProphet vs. USDA August corn yield forecast differences on the release date of the UDSA August corn yield estimates.
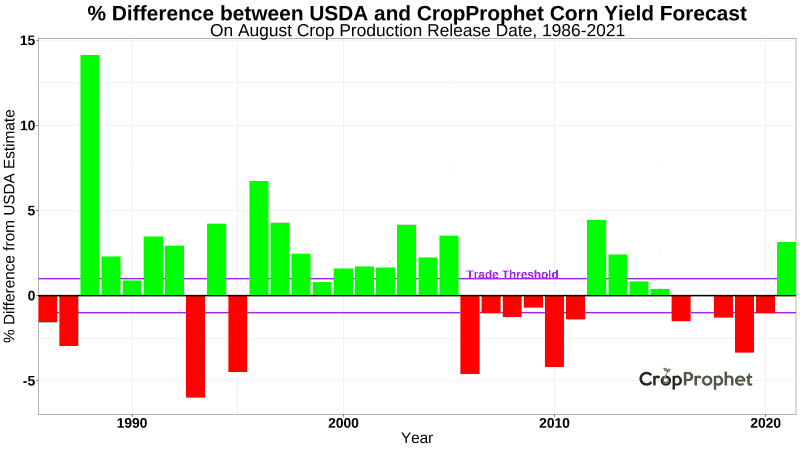
The systematic grain trading algorithm is implemented to estimate the annual return of the August trade strategy for corn and soybeans. The results of the trade are shown below in Figure 4. The results show that the strategy generated an average positive return, even though some years experienced a negative return. The average annual return (not the compound return) is 6.7% and 3.8% for corn and soybeans, respectively.
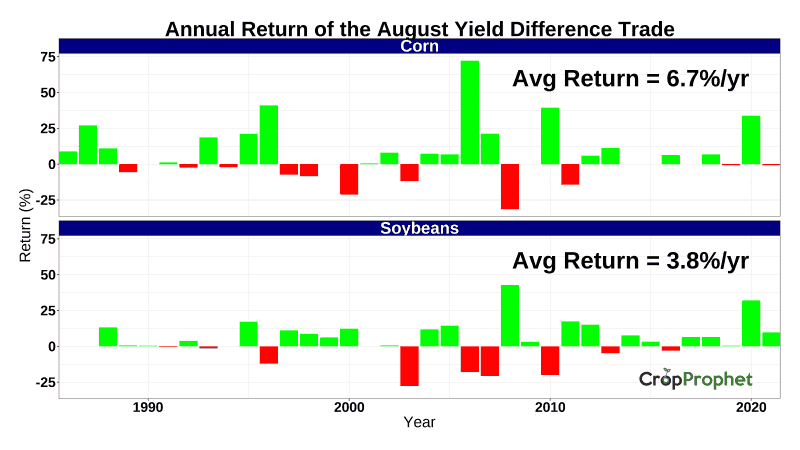
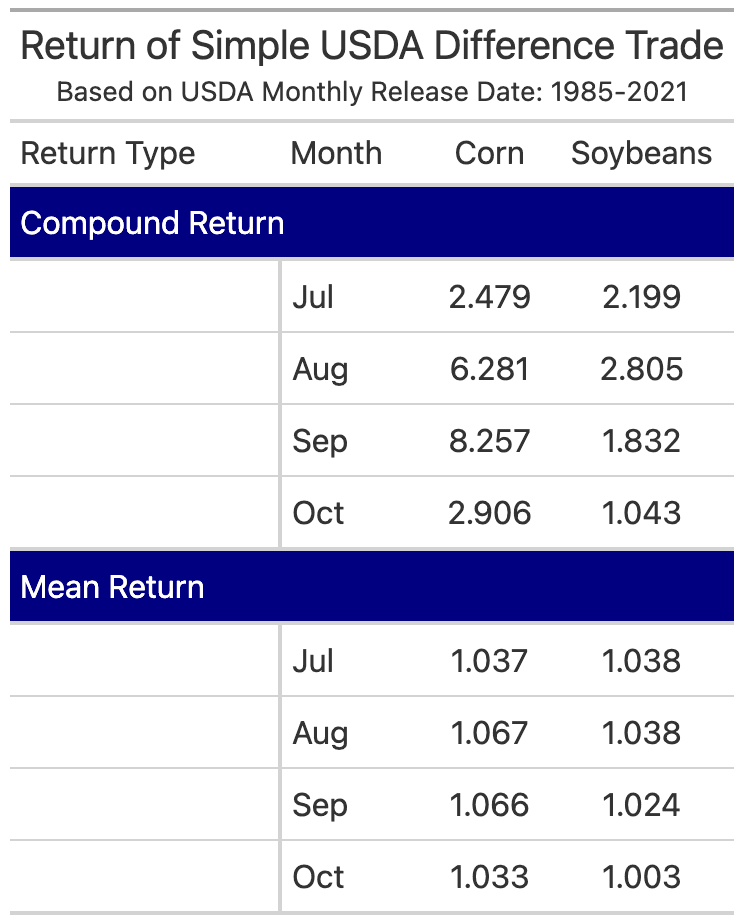
Figure 4 highlights only the August systematic grain trade model results. The model can easily be expanded to include July, September, and October USDA yield forecast release dates. The results for the mean and compound returns (over the 36 years) from 1986 to 2021 are shown in Table 1 below.
Systematic Trade Model Modifications
While not implemented here, modifications to the systematic grain trading model could be examined to optimize profitability. For example, our strategy arbitrarily assumes the position is closed on the first trading day of December. Exploring a wider range of position closing dates could further optimize this decision.
Another strategy modification could optimize the investment allocation weight within a portfolio of corn and soybean trades to maximize return while minimizing downside risk.
Grain Yield and Price Data
The data used for this grain trading study include:
1) USDA Corn and Soybean mid-month yield forecasts (available in the CropProphet Modeler data set),
2) CropProphet Modeler cross-validated historical corn and soybean yield forecasts
3) A continuous corn and soybeans futures price history provided by Macrotrends.net at https://www.macrotrends.net/2532/corn-prices-historical-chart-data and
https://www.macrotrends.net/2531/soybean-prices-historical-chart-data
Systematic Grain Trading: Other Options
This study uses CropProphet’s cross-validated historical data set to examine the profitability of a simple grain trading strategy. Other trade strategy possibilities include examining the returns associated with:
• daily and/or weekly updated crop yield forecast changes
• predicting the direction of the change of the USDA mid-month yield forecasts
• impacts of the ECMWF and GEFS weather forecast impacted crop yield forecasts
• advanced information associated with the ensemble spread of the ECMWF and GEFS weather forecast impacted crop yield forecasts
Conclusion
The purpose of this case study is not to demonstrate the most profitable grain strategy possible. Rather, our goal is to demonstrate how CropProphet can be used to explore the profitability of a systematic grain trading strategy. The CropProphet Modeler solution provides a wealth of crop yield and crop yield forecast data to enable systematic grain trading.