US Soybean Production by State: Ranking the Top 11
Weather conditions, such as temperature, rainfall, and extreme events (droughts, floods, and frosts), directly affect soybean crop health and yield. Poor weather can lead to lower yields, reducing the supply of soybeans, which typically causes prices to rise. Conversely, ideal growing conditions can result in bumper crops, like we have in 2024, leading to an increase in supply and potential price drops.
Any soybean trading strategy requires tracking weather conditions and their impact on soybean yield and production because soybean prices are highly sensitive to changes in supply. By tracking weather patterns, traders can anticipate market movements and make more informed trading decisions to capitalize on price fluctuations. Weather analytics can inform a grain futures market trading strategy.
In this post, we review the top rankings of soybean production by state, a statistic closely followed by grain traders. An overview of US crop production statistics is also available.
What state produces the most soybeans?
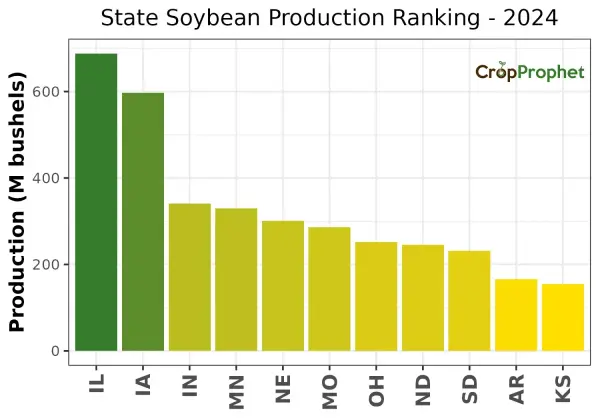
In 2024, Illinois produced 688 million bushels of soybeans, slightly higher than 2023’s total of 649 Mbu. Illinois is the number one state soybean producer in the United States.

Where are soybeans grown in the United States?
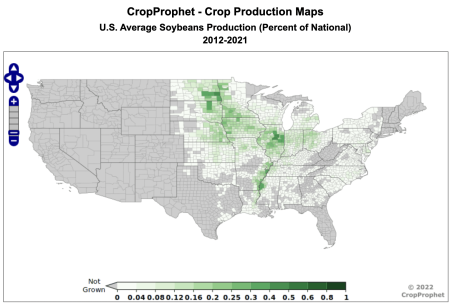
Illinois, Iowa, Minnesota, and Indiana are the top four soybean-producing states. These four states collectively grow 49% of the nation’s soybeans. The graphic below shows the regions where soybean production is most concentrated. Like corn production, Soybeans are primarily grown in the Midwest of the United States.
What is the primary cause of year-to-year variations in soybean production?
The primary cause of year-to-year variation in soybean production from state to state is year-to-year variations in:
- The number of acres planted by producers to grow soybeans and
- The weather conditions that occur during the soybean growing season.
CropProphet uses daily weather conditions to forecast the estimated end-of-season USDA report. yield and production .
CropProphet provides weather-based corn yield (and soybean) production forecasts. In other words, we help grain traders, grain merchandisers, and discretionary and systematic commodity traders manage weather risk. A wide range of grain commodity traders seize grain market trading opportunities using CropProphet by knowing the differences between market perceptions of corn production and our forecast. As the market perception corrects toward the CropProphet forecasts, corn prices change. Our customers have an information advantage in the grain market.
In addition to weather and other factors, variations also occur in the timing of soybean planting.
Discover the benefits of CropProphet now.

Follow this link if you are interested in state corn yield per acre rankings.
Table of Contents
| 2000-2004 | 2005-2009 | 2010-2014 | 2015-2019 | 2020-2024 |
|---|---|---|---|---|
Soybean Production by State: Top 11 of 2024
The top 11 soybeans-producing states (and their total production) of 2024 was:
| Production Rankings: 2024 | ||
| Rank | State | Production (M bu) |
|---|---|---|
| 1 | IL | 688.0 |
| 2 | IA | 597.6 |
| 3 | IN | 341.0 |
| 4 | MN | 329.4 |
| 5 | NE | 301.3 |
| 6 | MO | 286.2 |
| 7 | OH | 251.5 |
| 8 | ND | 245.6 |
| 9 | SD | 231.3 |
| 10 | AR | 166.1 |
| 11 | KS | 154.7 |
State Soybean Production – 2024
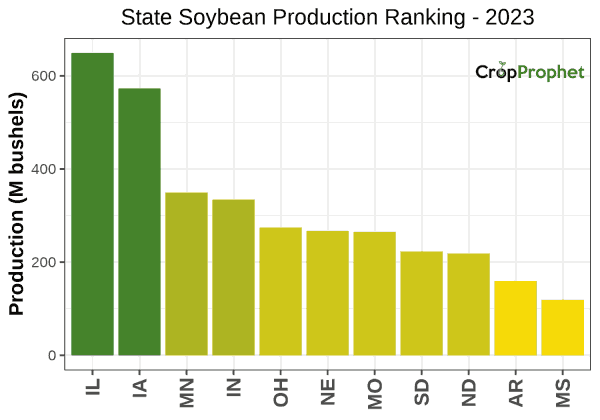
Soybean Production by State: Top 11 of 2023
The top 11 soybeans-producing states (and their total production) of 2023 was:
| Production Rankings: 2023 | ||
| Rank | State | Production (M bu) |
|---|---|---|
| 1 | IL | 648.9 |
| 2 | IA | 573.0 |
| 3 | MN | 349.4 |
| 4 | IN | 334.3 |
| 5 | OH | 274.3 |
| 6 | NE | 266.8 |
| 7 | MO | 265.0 |
| 8 | SD | 223.1 |
| 9 | ND | 218.7 |
| 10 | AR | 159.3 |
| 11 | MS | 119.3 |
State Soybean Production – 2023
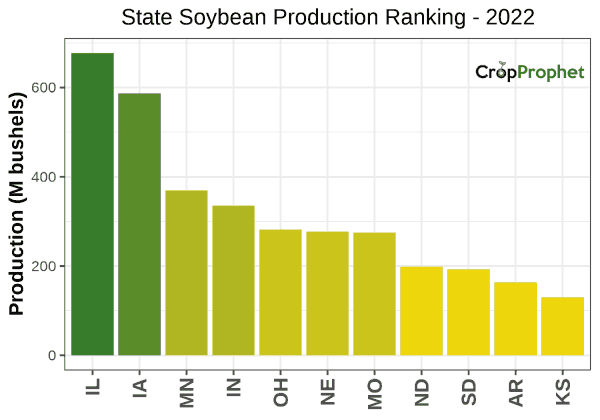
Soybean Production by State: Top 11 of 2022
The top 11 soybeans-producing states (and their total production) of 2022 was:
| Production Rankings: 2022 | ||
| Rank | State | Production (M bu) |
|---|---|---|
| 1 | IL | 677.2 |
| 2 | IA | 586.8 |
| 3 | MN | 369.5 |
| 4 | IN | 335.2 |
| 5 | OH | 281.9 |
| 6 | NE | 276.9 |
| 7 | MO | 274.8 |
| 8 | ND | 198.4 |
| 9 | SD | 192.7 |
| 10 | AR | 163.3 |
| 11 | KS | 129.8 |
State Soybean Production – 2022
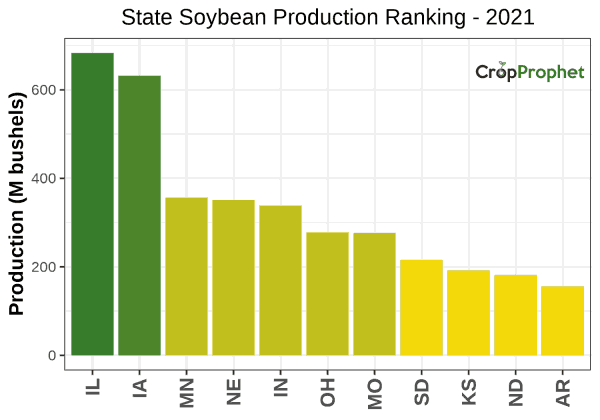
Soybean Production by State: Top 11 of 2021
The top 11 soybeans-producing states (and their total production) of 2021 was:
| Production Rankings: 2021 | ||
| Rank | State | Production (M bu) |
|---|---|---|
| 1 | IL | 683.1 |
| 2 | IA | 631.9 |
| 3 | MN | 356.3 |
| 4 | NE | 350.9 |
| 5 | IN | 338.4 |
| 6 | OH | 278.2 |
| 7 | MO | 276.4 |
| 8 | SD | 215.6 |
| 9 | KS | 192.0 |
| 10 | ND | 181.6 |
| 11 | AR | 156.0 |
State Soybean Production – 2021
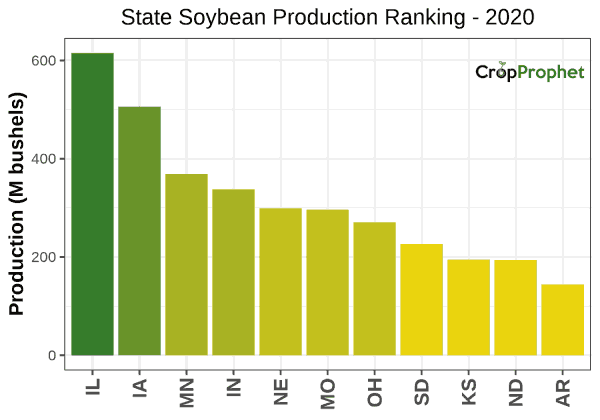
Soybean Production by State: Top 11 of 2020
The top 11 soybeans-producing states (and their total production) of 2020 was:
| Production Rankings: 2020 | ||
| Rank | State | Production (M bu) |
|---|---|---|
| 1 | IL | 615.0 |
| 2 | IA | 506.0 |
| 3 | MN | 369.0 |
| 4 | IN | 338.1 |
| 5 | NE | 299.3 |
| 6 | MO | 296.3 |
| 7 | OH | 270.6 |
| 8 | SD | 226.3 |
| 9 | KS | 194.8 |
| 10 | ND | 193.8 |
| 11 | AR | 144.2 |
State Soybean Production – 2020
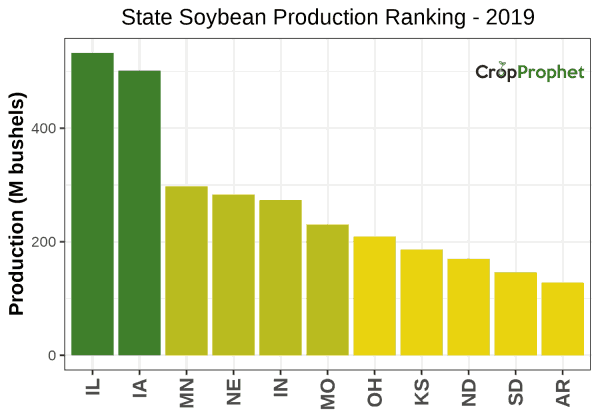
Soybean Production by State: Top 11 of 2019
The top 11 soybeans-producing states (and their total production) of 2019 was:
| Production Rankings: 2019 | ||
| Rank | State | Production (M bu) |
|---|---|---|
| 1 | IL | 532.4 |
| 2 | IA | 501.6 |
| 3 | MN | 297.9 |
| 4 | NE | 283.1 |
| 5 | IN | 273.4 |
| 6 | MO | 230.5 |
| 7 | OH | 209.2 |
| 8 | KS | 186.3 |
| 9 | ND | 170.1 |
| 10 | SD | 146.2 |
| 11 | AR | 127.9 |
State Soybean Production – 2019
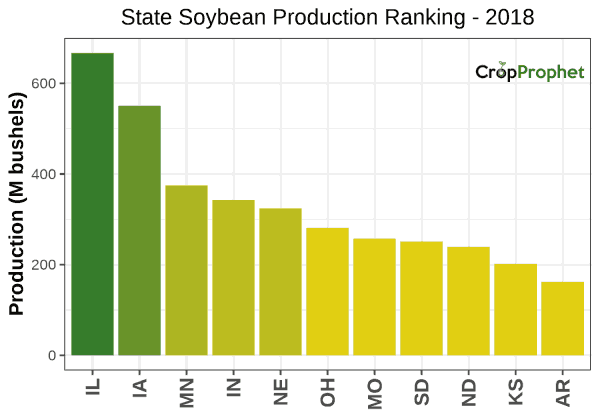
Soybean Production by State: Top 11 of 2018
The top 11 soybeans-producing states (and their total production) of 2018 was:
| Production Rankings: 2018 | ||
| Rank | State | Production (M bu) |
|---|---|---|
| 1 | IL | 666.8 |
| 2 | IA | 550.5 |
| 3 | MN | 374.9 |
| 4 | IN | 342.7 |
| 5 | NE | 324.2 |
| 6 | OH | 281.1 |
| 7 | MO | 257.2 |
| 8 | SD | 251.1 |
| 9 | ND | 239.4 |
| 10 | KS | 201.7 |
| 11 | AR | 162.1 |
State Soybean Production – 2018
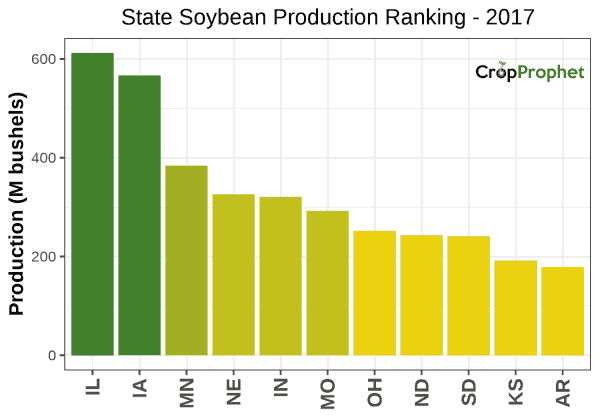
Soybean Production by State: Top 11 of 2017
The top 11 soybeans-producing states (and their total production) of 2017 was:
| Production Rankings: 2017 | ||
| Rank | State | Production (M bu) |
|---|---|---|
| 1 | IL | 611.9 |
| 2 | IA | 566.6 |
| 3 | MN | 384.3 |
| 4 | NE | 326.0 |
| 5 | IN | 320.8 |
| 6 | MO | 292.5 |
| 7 | OH | 252.0 |
| 8 | ND | 243.2 |
| 9 | SD | 241.2 |
| 10 | KS | 191.6 |
| 11 | AR | 178.5 |
State Soybean Production – 2017
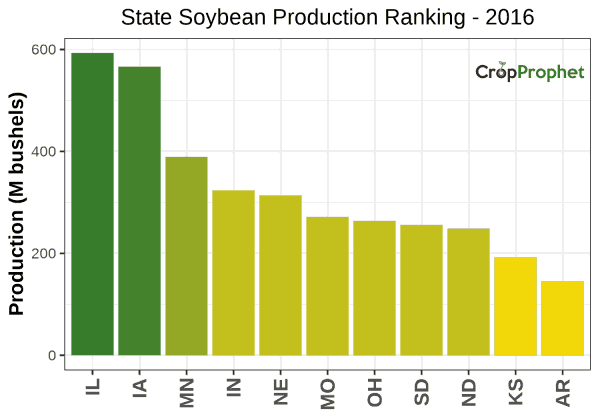
Soybean Production by State: Top 11 of 2016
The top 11 soybeans-producing states (and their total production) of 2016 was:
| Production Rankings: 2016 | ||
| Rank | State | Production (M bu) |
|---|---|---|
| 1 | IL | 593.0 |
| 2 | IA | 566.4 |
| 3 | MN | 389.5 |
| 4 | IN | 323.7 |
| 5 | NE | 314.1 |
| 6 | MO | 271.5 |
| 7 | OH | 263.8 |
| 8 | SD | 255.9 |
| 9 | ND | 248.6 |
| 10 | KS | 192.5 |
| 11 | AR | 145.2 |
State Soybean Production – 2016
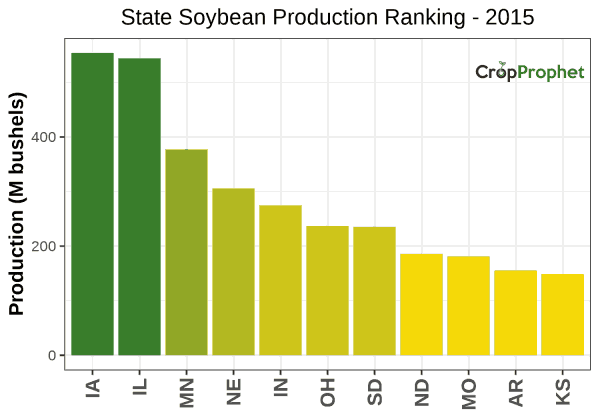
Soybean Production by State: Top 11 of 2015
The top 11 soybeans-producing states (and their total production) of 2015 was:
| Production Rankings: 2015 | ||
| Rank | State | Production (M bu) |
|---|---|---|
| 1 | IA | 553.7 |
| 2 | IL | 544.3 |
| 3 | MN | 377.5 |
| 4 | NE | 305.7 |
| 5 | IN | 275.0 |
| 6 | OH | 237.0 |
| 7 | SD | 235.5 |
| 8 | ND | 185.9 |
| 9 | MO | 181.0 |
| 10 | AR | 155.3 |
| 11 | KS | 148.6 |
State Soybean Production – 2015
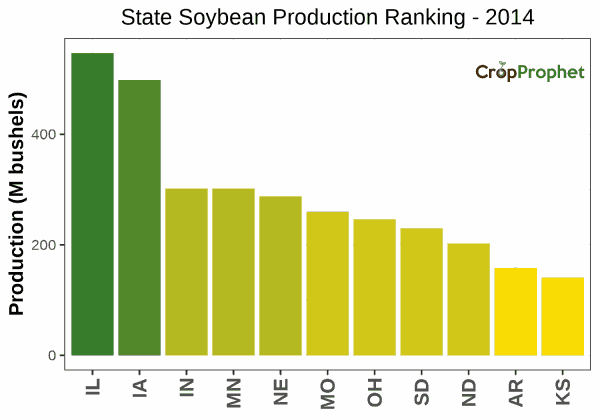
Soybean Production by State: Top 11 of 2014
The top 11 soybeans-producing states (and their total production) of 2014 was:
| Production Rankings: 2014 | ||
| Rank | State | Production (M bu) |
|---|---|---|
| 1 | IL | 547.1 |
| 2 | IA | 498.3 |
| 3 | IN | 301.9 |
| 4 | MN | 301.7 |
| 5 | NE | 287.8 |
| 6 | MO | 259.9 |
| 7 | OH | 246.2 |
| 8 | SD | 229.9 |
| 9 | ND | 202.5 |
| 10 | AR | 158.4 |
| 11 | KS | 140.6 |
State Soybean Production – 2014
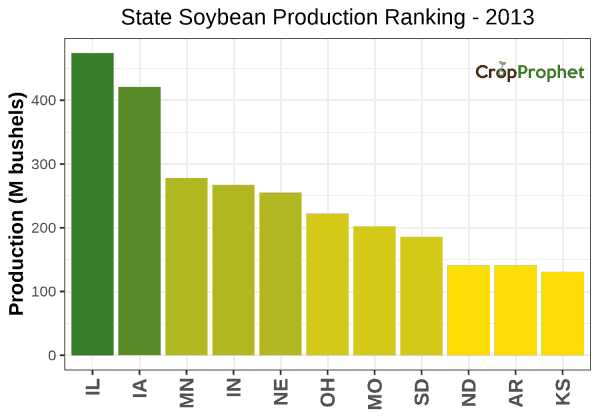
Soybean Production by State: Top 11 of 2013
The top 11 soybeans-producing states (and their total production) of 2013 was:
| Production Rankings: 2013 | ||
| Rank | State | Production (M bu) |
|---|---|---|
| 1 | IL | 474.0 |
| 2 | IA | 420.9 |
| 3 | MN | 278.0 |
| 4 | IN | 267.3 |
| 5 | NE | 255.2 |
| 6 | OH | 222.3 |
| 7 | MO | 202.0 |
| 8 | SD | 185.5 |
| 9 | ND | 141.2 |
| 10 | AR | 140.9 |
| 11 | KS | 131.0 |
State Soybean Production – 2013
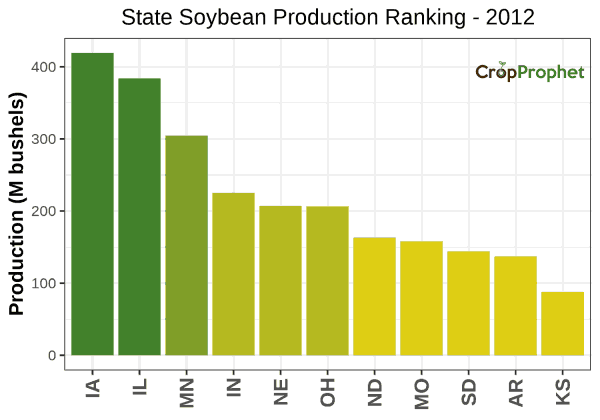
Soybean Production by State: Top 11 of 2012
The top 11 soybeans-producing states (and their total production) of 2012 was:
| Production Rankings: 2012 | ||
| Rank | State | Production (M bu) |
|---|---|---|
| 1 | IA | 419.0 |
| 2 | IL | 384.0 |
| 3 | MN | 304.5 |
| 4 | IN | 225.3 |
| 5 | NE | 207.1 |
| 6 | OH | 206.6 |
| 7 | ND | 163.2 |
| 8 | MO | 158.1 |
| 9 | SD | 144.0 |
| 10 | AR | 137.0 |
| 11 | KS | 87.9 |
State Soybean Production – 2012
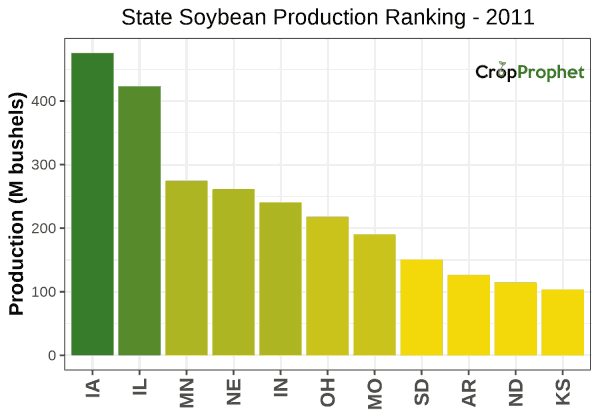
Soybean Production by State: Top 11 of 2011
The top 11 soybeans-producing states (and their total production) of 2011 was:
| Production Rankings: 2011 | ||
| Rank | State | Production (M bu) |
|---|---|---|
| 1 | IA | 475.3 |
| 2 | IL | 423.2 |
| 3 | MN | 274.6 |
| 4 | NE | 261.4 |
| 5 | IN | 240.7 |
| 6 | OH | 217.9 |
| 7 | MO | 190.2 |
| 8 | SD | 150.6 |
| 9 | AR | 126.3 |
| 10 | ND | 114.8 |
| 11 | KS | 103.4 |
State Soybean Production – 2011
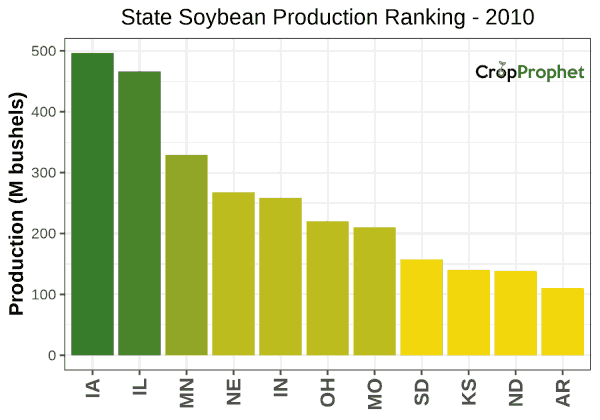
Soybean Production by State: Top 11 of 2010
The top 11 soybeans-producing states (and their total production) of 2010 was:
| Production Rankings: 2010 | ||
| Rank | State | Production (M bu) |
|---|---|---|
| 1 | IA | 496.2 |
| 2 | IL | 466.1 |
| 3 | MN | 329.0 |
| 4 | NE | 267.8 |
| 5 | IN | 258.5 |
| 6 | OH | 220.3 |
| 7 | MO | 210.4 |
| 8 | SD | 157.3 |
| 9 | KS | 140.2 |
| 10 | ND | 138.4 |
| 11 | AR | 110.2 |
State Soybean Production – 2010
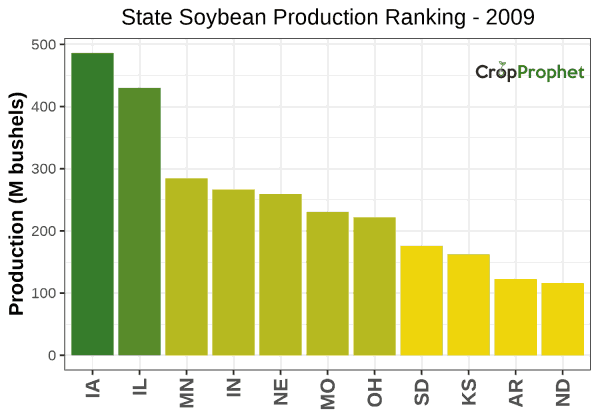
Soybean Production by State: Top 11 of 2009
The top 11 soybeans-producing states (and their total production) of 2009 was:
| Production Rankings: 2009 | ||
| Rank | State | Production (M bu) |
|---|---|---|
| 1 | IA | 486.0 |
| 2 | IL | 430.1 |
| 3 | MN | 284.8 |
| 4 | IN | 266.6 |
| 5 | NE | 259.4 |
| 6 | MO | 230.6 |
| 7 | OH | 222.0 |
| 8 | SD | 176.0 |
| 9 | KS | 162.4 |
| 10 | AR | 122.6 |
| 11 | ND | 116.1 |
State Soybean Production – 2009
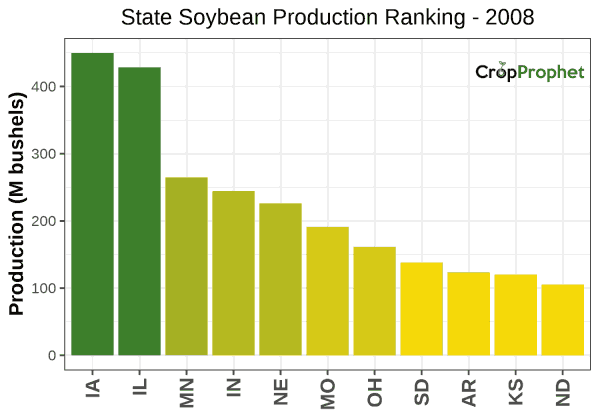
Soybean Production by State: Top 11 of 2008
The top 11 soybeans-producing states (and their total production) of 2008 was:
| Production Rankings: 2008 | ||
| Rank | State | Production (M bu) |
|---|---|---|
| 1 | IA | 449.7 |
| 2 | IL | 428.6 |
| 3 | MN | 264.9 |
| 4 | IN | 244.3 |
| 5 | NE | 226.0 |
| 6 | MO | 191.1 |
| 7 | OH | 161.3 |
| 8 | SD | 138.0 |
| 9 | AR | 123.5 |
| 10 | KS | 120.2 |
| 11 | ND | 105.3 |
State Soybean Production – 2008
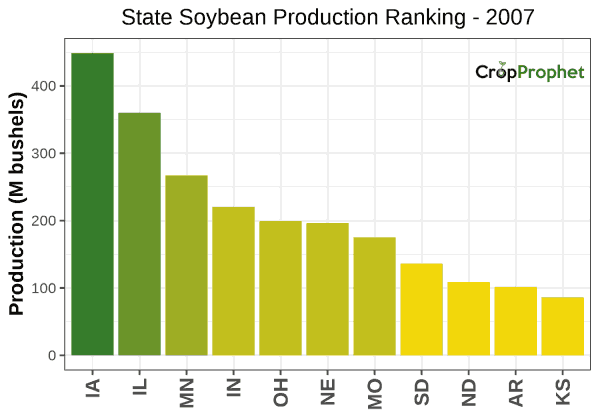
Soybean Production by State: Top 11 of 2007
The top 11 soybeans-producing states (and their total production) of 2007 was:
| Production Rankings: 2007 | ||
| Rank | State | Production (M bu) |
|---|---|---|
| 1 | IA | 448.8 |
| 2 | IL | 360.2 |
| 3 | MN | 267.3 |
| 4 | IN | 220.3 |
| 5 | OH | 199.3 |
| 6 | NE | 196.3 |
| 7 | MO | 175.1 |
| 8 | SD | 136.1 |
| 9 | ND | 108.6 |
| 10 | AR | 101.5 |
| 11 | KS | 86.1 |
State Soybean Production – 2007
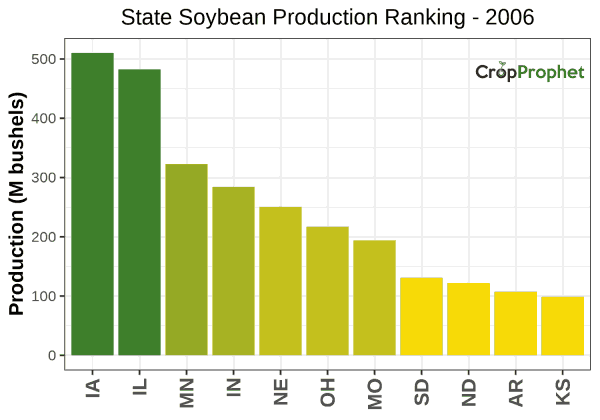
Soybean Production by State: Top 11 of 2006
The top 11 soybeans-producing states (and their total production) of 2006 was:
| Production Rankings: 2006 | ||
| Rank | State | Production (M bu) |
|---|---|---|
| 1 | IA | 510.0 |
| 2 | IL | 482.4 |
| 3 | MN | 322.6 |
| 4 | IN | 284.0 |
| 5 | NE | 250.5 |
| 6 | OH | 217.1 |
| 7 | MO | 194.2 |
| 8 | SD | 130.9 |
| 9 | ND | 121.9 |
| 10 | AR | 107.4 |
| 11 | KS | 98.6 |
State Soybean Production – 2006
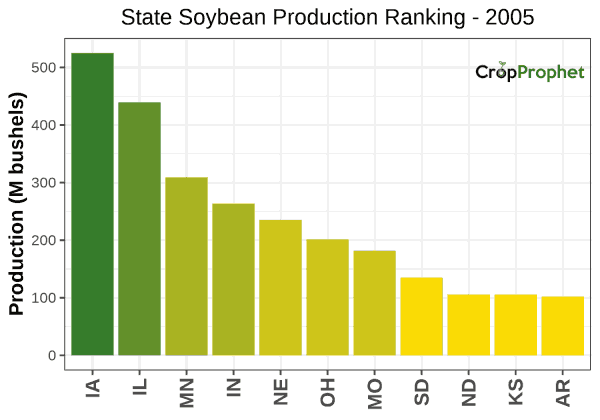
Soybean Production by State: Top 11 of 2005
The top 11 soybeans-producing states (and their total production) of 2005 was:
| Production Rankings: 2005 | ||
| Rank | State | Production (M bu) |
|---|---|---|
| 1 | IA | 525.0 |
| 2 | IL | 439.4 |
| 3 | MN | 309.4 |
| 4 | IN | 263.6 |
| 5 | NE | 235.3 |
| 6 | OH | 201.6 |
| 7 | MO | 181.7 |
| 8 | SD | 134.8 |
| 9 | ND | 105.8 |
| 10 | KS | 105.4 |
| 11 | AR | 102.0 |
State Soybean Production – 2005
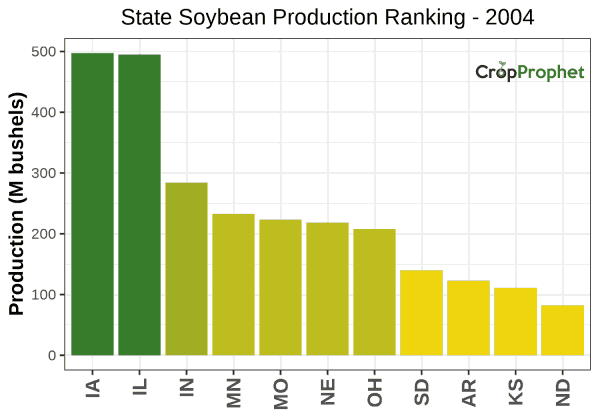
Soybean Production by State: Top 11 of 2004
The top 11 soybeans-producing states (and their total production) of 2004 was:
| Production Rankings: 2004 | ||
| Rank | State | Production (M bu) |
|---|---|---|
| 1 | IA | 497.4 |
| 2 | IL | 495.0 |
| 3 | IN | 284.3 |
| 4 | MN | 232.7 |
| 5 | MO | 223.2 |
| 6 | NE | 218.5 |
| 7 | OH | 207.7 |
| 8 | SD | 140.1 |
| 9 | AR | 122.8 |
| 10 | KS | 111.1 |
| 11 | ND | 82.1 |
State Soybean Production – 2004
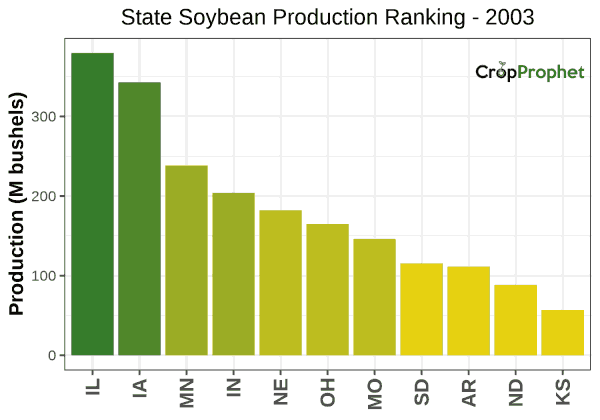
Soybean Production by State: Top 11 of 2003
The top 11 soybeans-producing states (and their total production) of 2003 was:
| Production Rankings: 2003 | ||
| Rank | State | Production (M bu) |
|---|---|---|
| 1 | IL | 379.6 |
| 2 | IA | 342.9 |
| 3 | MN | 238.4 |
| 4 | IN | 204.1 |
| 5 | NE | 182.2 |
| 6 | OH | 164.8 |
| 7 | MO | 146.0 |
| 8 | SD | 115.5 |
| 9 | AR | 111.3 |
| 10 | ND | 88.4 |
| 11 | KS | 57.0 |
State Soybean Production – 2003
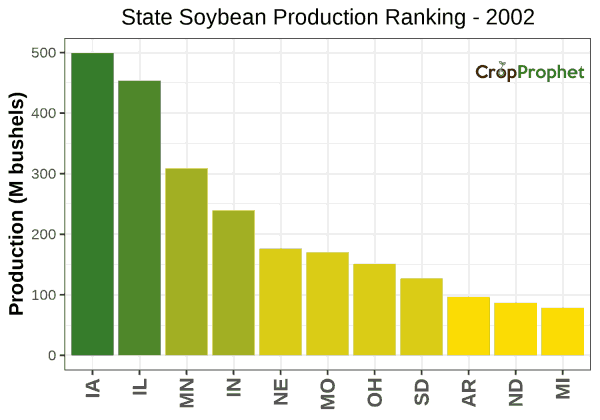
Soybean Production by State: Top 11 of 2002
The top 11 soybeans-producing states (and their total production) of 2002 was:
| Production Rankings: 2002 | ||
| Rank | State | Production (M bu) |
|---|---|---|
| 1 | IA | 499.2 |
| 2 | IL | 453.6 |
| 3 | MN | 308.9 |
| 4 | IN | 239.5 |
| 5 | NE | 176.3 |
| 6 | MO | 170.0 |
| 7 | OH | 151.0 |
| 8 | SD | 126.8 |
| 9 | AR | 96.5 |
| 10 | ND | 86.8 |
| 11 | MI | 78.5 |
State Soybean Production – 2002
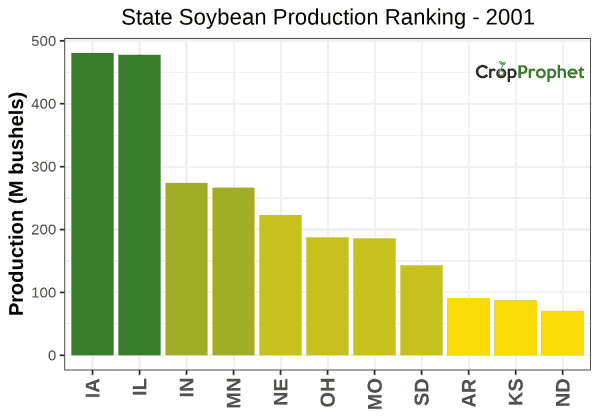
Soybean Production by State: Top 11 of 2001
The top 11 soybeans-producing states (and their total production) of 2001 was:
| Production Rankings: 2001 | ||
| Rank | State | Production (M bu) |
|---|---|---|
| 1 | IA | 480.5 |
| 2 | IL | 477.9 |
| 3 | IN | 273.9 |
| 4 | MN | 266.4 |
| 5 | NE | 222.9 |
| 6 | OH | 187.8 |
| 7 | MO | 186.2 |
| 8 | SD | 143.0 |
| 9 | AR | 91.2 |
| 10 | KS | 87.4 |
| 11 | ND | 70.7 |
State Soybean Production – 2001
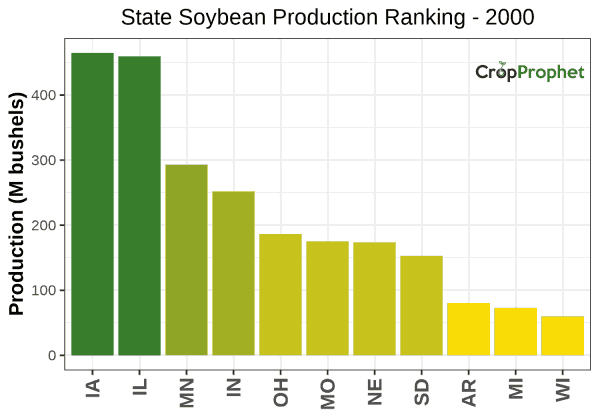
Soybean Production by State: Top 11 of 2000
The top 11 soybeans-producing states (and their total production) of 2000 was:
| Production Rankings: 2000 | ||
| Rank | State | Production (M bu) |
|---|---|---|
| 1 | IA | 464.6 |
| 2 | IL | 459.8 |
| 3 | MN | 293.1 |
| 4 | IN | 252.1 |
| 5 | OH | 186.5 |
| 6 | MO | 175.0 |
| 7 | NE | 173.8 |
| 8 | SD | 152.9 |
| 9 | AR | 80.3 |
| 10 | MI | 73.1 |
| 11 | WI | 60.0 |
State Soybean Production – 2000
CropProphet provides daily updated, weather-based forecasts of county, state, and soybean production. Request a trial of CropProphet today.