What State Produces the Most Winter Wheat?
The USDA NASS provides data regarding historical winter wheat (among many other crops) planted and harvest acres, yield, and production. CropProphet uses the data made available by the USDA along with weather information to forecast yield and production for corn, soybeans, and winter wheat.
The information presented here documents the 11 top winter wheat producing states each year from 2019 back to 2000.
Table of Contents
| 2000-2004 | 2005-2009 | 2010-2014 | 2015-2019 | 2020-2022 |
|---|---|---|---|---|
Winter Production by State: Top 11 of 2023
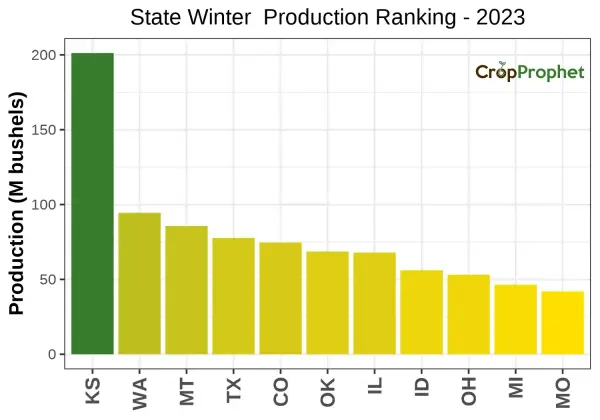
The top 11 winter wheat-producing states (and their total production) of 2023 was:
| Production Rankings: 2023 | ||
| Rank | State | Production (M bu) |
|---|---|---|
| 1 | KS | 201.2 |
| 2 | WA | 94.5 |
| 3 | MT | 85.7 |
| 4 | TX | 77.7 |
| 5 | CO | 74.6 |
| 6 | OK | 68.6 |
| 7 | IL | 67.9 |
| 8 | ID | 56.1 |
| 9 | OH | 53.1 |
| 10 | MI | 46.5 |
| 11 | MO | 42.0 |
State Winter Production – 2023

Winter Production by State: Top 11 of 2022
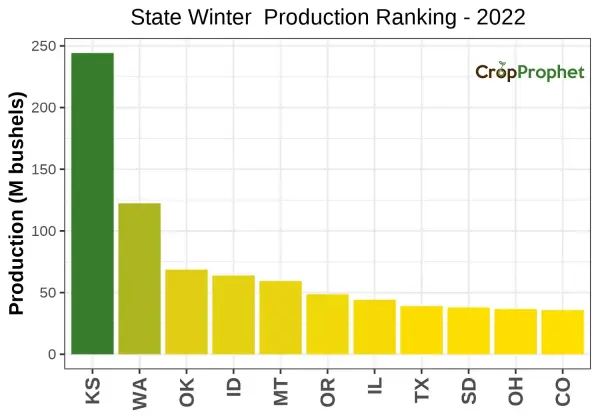
The top 11 winter wheat-producing states (and their total production) of 2022 was:
| Production Rankings: 2022 | ||
| Rank | State | Production (M bu) |
|---|---|---|
| 1 | KS | 244.2 |
| 2 | WA | 122.4 |
| 3 | OK | 68.6 |
| 4 | ID | 63.9 |
| 5 | MT | 59.4 |
| 6 | OR | 48.6 |
| 7 | IL | 44.2 |
| 8 | TX | 39.0 |
| 9 | SD | 38.0 |
| 10 | OH | 36.7 |
| 11 | CO | 35.8 |
State Winter Production – 2022
Winter Production by State: Top 11 of 2021
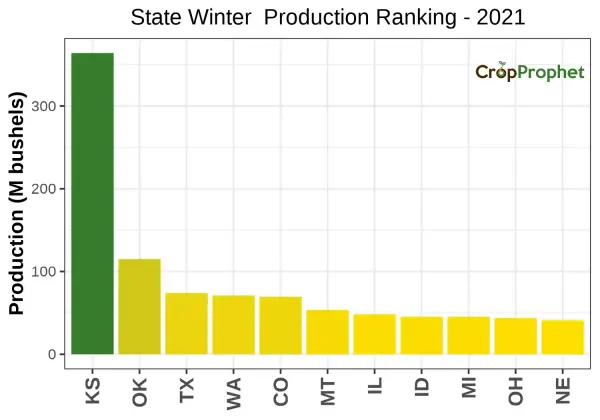
The top 11 winter wheat-producing states (and their total production) of 2021 was:
| Production Rankings: 2021 | ||
| Rank | State | Production (M bu) |
|---|---|---|
| 1 | KS | 364.0 |
| 2 | OK | 115.0 |
| 3 | TX | 74.0 |
| 4 | WA | 71.0 |
| 5 | CO | 69.6 |
| 6 | MT | 53.6 |
| 7 | IL | 48.2 |
| 8 | ID | 45.4 |
| 9 | MI | 45.4 |
| 10 | OH | 43.8 |
| 11 | NE | 41.2 |
State Winter Production – 2021
Winter Production by State: Top 11 of 2020
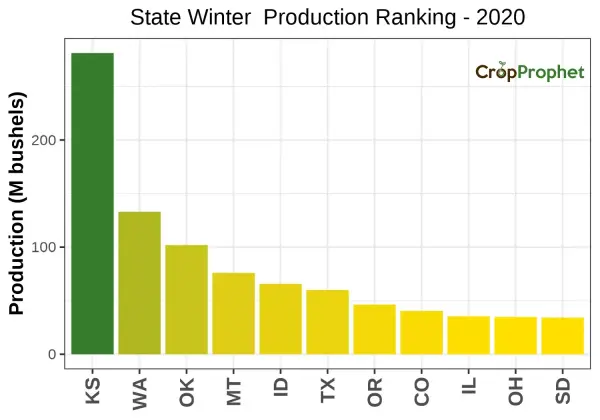
The top 11 winter wheat-producing states (and their total production) of 2020 was:
| Production Rankings: 2020 | ||
| Rank | State | Production (M bu) |
|---|---|---|
| 1 | KS | 281.2 |
| 2 | WA | 133.0 |
| 3 | OK | 102.0 |
| 4 | MT | 76.0 |
| 5 | ID | 65.7 |
| 6 | TX | 60.0 |
| 7 | OR | 46.4 |
| 8 | CO | 40.5 |
| 9 | IL | 35.4 |
| 10 | OH | 34.8 |
| 11 | SD | 34.2 |
State Winter Production – 2020
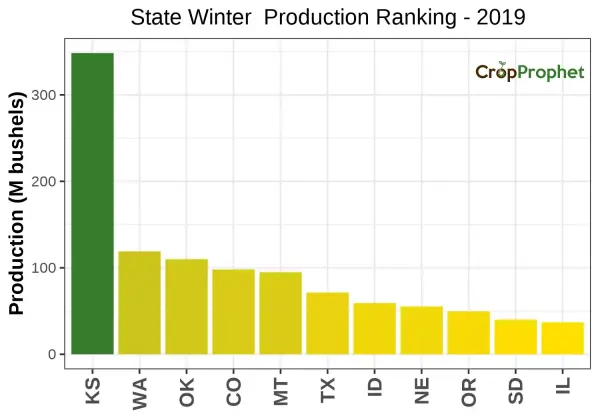
Winter Production by State: Top 11 of 2019
The top 11 winter wheat-producing states (and their total production) of 2019 was:
| Production Rankings: 2019 | ||
| Rank | State | Production (M bu) |
|---|---|---|
| 1 | KS | 348.4 |
| 2 | WA | 119.0 |
| 3 | OK | 110.0 |
| 4 | CO | 98.0 |
| 5 | MT | 95.0 |
| 6 | TX | 71.4 |
| 7 | ID | 59.2 |
| 8 | NE | 55.3 |
| 9 | OR | 49.6 |
| 10 | SD | 40.0 |
| 11 | IL | 36.9 |
State Winter Production – 2019
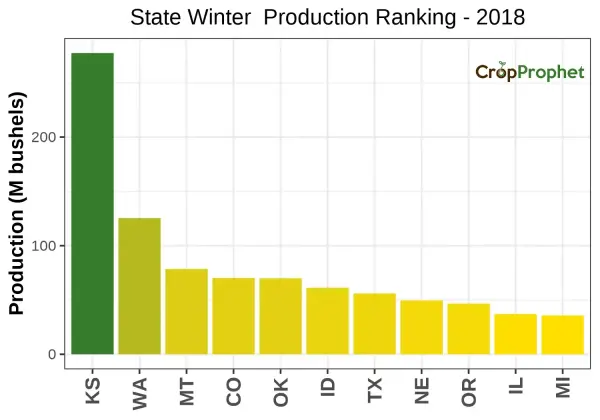
Winter Production by State: Top 11 of 2018
The top 11 winter wheat-producing states (and their total production) of 2018 was:
| Production Rankings: 2018 | ||
| Rank | State | Production (M bu) |
|---|---|---|
| 1 | KS | 277.4 |
| 2 | WA | 125.4 |
| 3 | MT | 78.5 |
| 4 | CO | 70.2 |
| 5 | OK | 70.0 |
| 6 | ID | 61.2 |
| 7 | TX | 56.0 |
| 8 | NE | 49.5 |
| 9 | OR | 46.6 |
| 10 | IL | 37.0 |
| 11 | MI | 35.7 |
State Winter Production – 2018
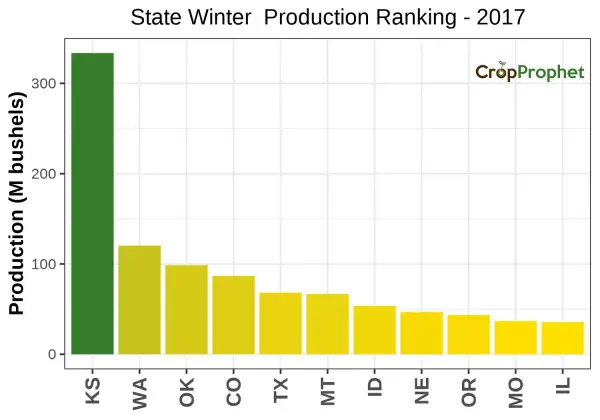
Winter Production by State: Top 11 of 2017
The top 11 winter wheat-producing states (and their total production) of 2017 was:
| Production Rankings: 2017 | ||
| Rank | State | Production (M bu) |
|---|---|---|
| 1 | KS | 333.6 |
| 2 | WA | 120.4 |
| 3 | OK | 98.6 |
| 4 | CO | 86.9 |
| 5 | TX | 68.2 |
| 6 | MT | 66.8 |
| 7 | ID | 53.6 |
| 8 | NE | 46.9 |
| 9 | OR | 43.5 |
| 10 | MO | 36.7 |
| 11 | IL | 35.7 |
State Winter Production – 2017
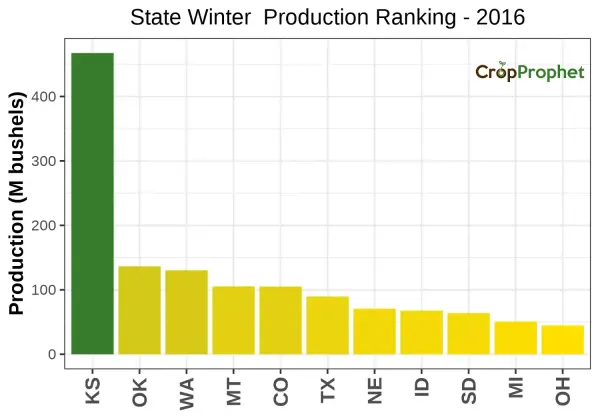
Winter Production by State: Top 11 of 2016
The top 11 winter wheat-producing states (and their total production) of 2016 was:
| Production Rankings: 2016 | ||
| Rank | State | Production (M bu) |
|---|---|---|
| 1 | KS | 467.4 |
| 2 | OK | 136.5 |
| 3 | WA | 130.3 |
| 4 | MT | 105.3 |
| 5 | CO | 105.1 |
| 6 | TX | 89.6 |
| 7 | NE | 70.7 |
| 8 | ID | 67.7 |
| 9 | SD | 63.8 |
| 10 | MI | 50.7 |
| 11 | OH | 44.8 |
State Winter Production – 2016
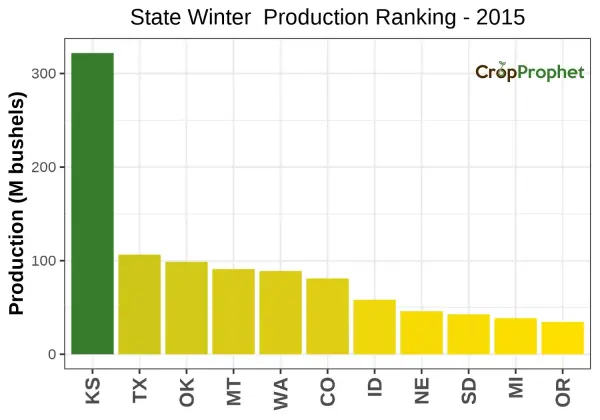
Winter Production by State: Top 11 of 2015
The top 11 winter wheat-producing states (and their total production) of 2015 was:
| Production Rankings: 2015 | ||
| Rank | State | Production (M bu) |
|---|---|---|
| 1 | KS | 321.9 |
| 2 | TX | 106.5 |
| 3 | OK | 98.8 |
| 4 | MT | 91.0 |
| 5 | WA | 89.0 |
| 6 | CO | 81.0 |
| 7 | ID | 58.2 |
| 8 | NE | 46.0 |
| 9 | SD | 42.7 |
| 10 | MI | 38.5 |
| 11 | OR | 34.5 |
State Winter Production – 2015
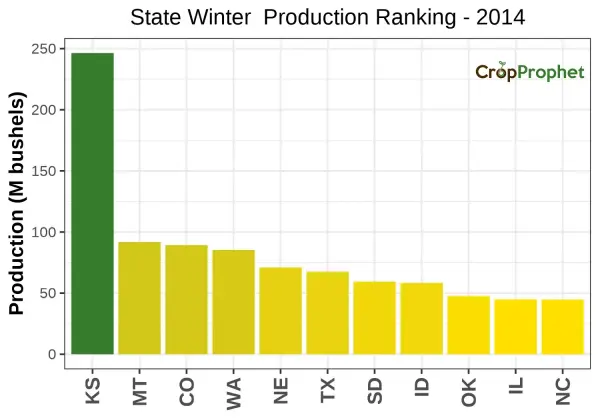
Winter Production by State: Top 11 of 2014
The top 11 winter wheat-producing states (and their total production) of 2014 was:
| Production Rankings: 2014 | ||
| Rank | State | Production (M bu) |
|---|---|---|
| 1 | KS | 246.4 |
| 2 | MT | 91.8 |
| 3 | CO | 89.3 |
| 4 | WA | 85.3 |
| 5 | NE | 71.0 |
| 6 | TX | 67.5 |
| 7 | SD | 59.4 |
| 8 | ID | 58.4 |
| 9 | OK | 47.6 |
| 10 | IL | 44.9 |
| 11 | NC | 44.7 |
State Winter Production – 2014
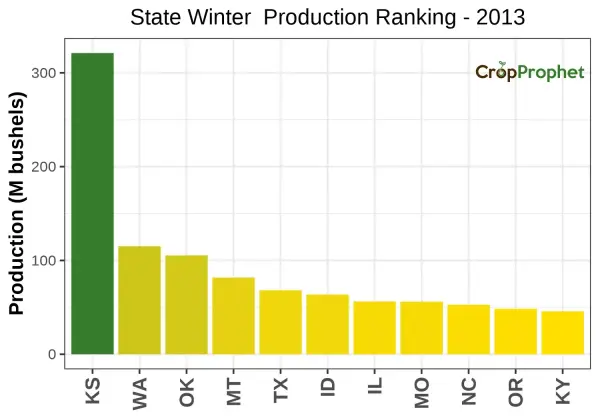
Winter Production by State: Top 11 of 2013
The top 11 winter wheat-producing states (and their total production) of 2013 was:
| Production Rankings: 2013 | ||
| Rank | State | Production (M bu) |
|---|---|---|
| 1 | KS | 321.1 |
| 2 | WA | 115.2 |
| 3 | OK | 105.4 |
| 4 | MT | 81.7 |
| 5 | TX | 68.2 |
| 6 | ID | 63.6 |
| 7 | IL | 56.3 |
| 8 | MO | 56.1 |
| 9 | NC | 52.7 |
| 10 | OR | 48.4 |
| 11 | KY | 45.8 |
State Winter Production – 2013
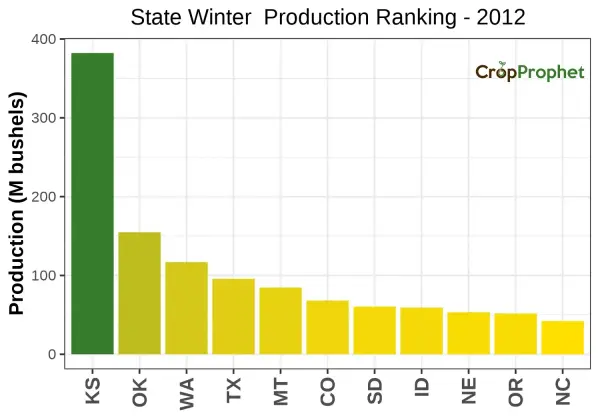
Winter Production by State: Top 11 of 2012
The top 11 winter wheat-producing states (and their total production) of 2012 was:
| Production Rankings: 2012 | ||
| Rank | State | Production (M bu) |
|---|---|---|
| 1 | KS | 382.2 |
| 2 | OK | 154.8 |
| 3 | WA | 116.9 |
| 4 | TX | 95.7 |
| 5 | MT | 84.6 |
| 6 | CO | 68.2 |
| 7 | SD | 60.5 |
| 8 | ID | 59.2 |
| 9 | NE | 53.3 |
| 10 | OR | 51.8 |
| 11 | NC | 42.2 |
State Winter Production – 2012
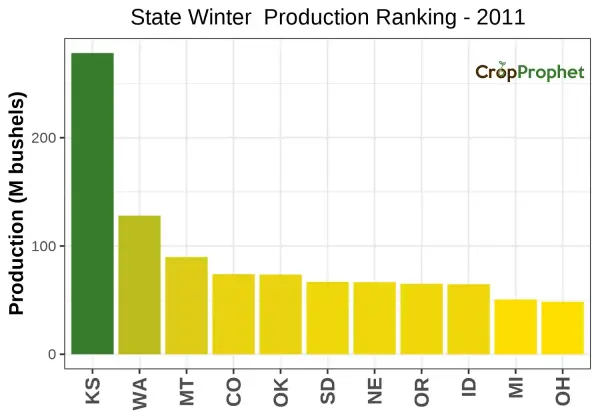
Winter Production by State: Top 11 of 2011
The top 11 winter wheat-producing states (and their total production) of 2011 was:
| Production Rankings: 2011 | ||
| Rank | State | Production (M bu) |
|---|---|---|
| 1 | KS | 278.2 |
| 2 | WA | 128.0 |
| 3 | MT | 89.8 |
| 4 | CO | 74.0 |
| 5 | OK | 73.6 |
| 6 | SD | 66.8 |
| 7 | NE | 66.6 |
| 8 | OR | 65.1 |
| 9 | ID | 64.7 |
| 10 | MI | 50.6 |
| 11 | OH | 48.5 |
State Winter Production – 2011
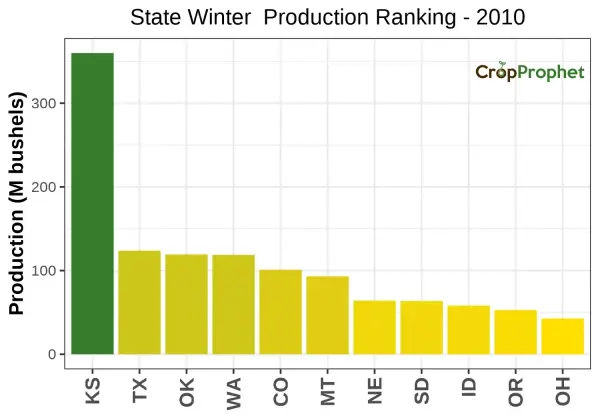
Winter Production by State: Top 11 of 2010
The top 11 winter wheat-producing states (and their total production) of 2010 was:
| Production Rankings: 2010 | ||
| Rank | State | Production (M bu) |
|---|---|---|
| 1 | KS | 360.0 |
| 2 | TX | 123.8 |
| 3 | OK | 119.3 |
| 4 | WA | 118.7 |
| 5 | CO | 101.0 |
| 6 | MT | 93.1 |
| 7 | NE | 64.1 |
| 8 | SD | 63.7 |
| 9 | ID | 58.2 |
| 10 | OR | 52.9 |
| 11 | OH | 42.7 |
State Winter Production – 2010
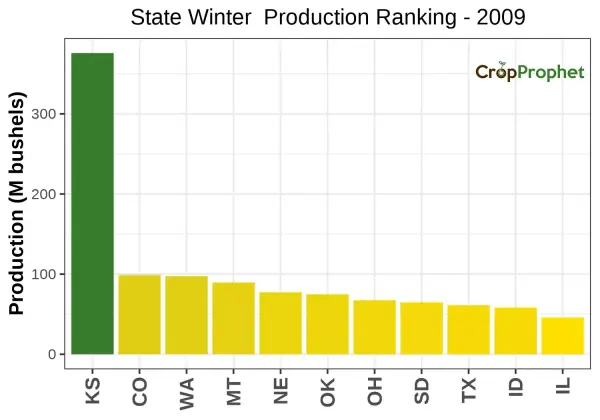
Winter Production by State: Top 11 of 2009
The top 11 winter wheat-producing states (and their total production) of 2009 was:
| Production Rankings: 2009 | ||
| Rank | State | Production (M bu) |
|---|---|---|
| 1 | KS | 375.9 |
| 2 | CO | 98.8 |
| 3 | WA | 97.4 |
| 4 | MT | 89.5 |
| 5 | NE | 77.3 |
| 6 | OK | 74.8 |
| 7 | OH | 67.4 |
| 8 | SD | 64.8 |
| 9 | TX | 61.2 |
| 10 | ID | 58.3 |
| 11 | IL | 45.9 |
State Winter Production – 2009
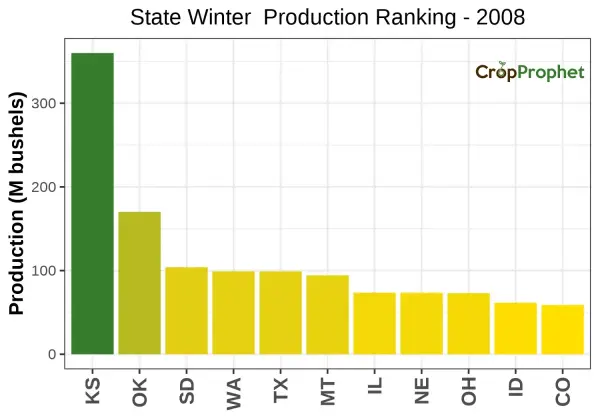
Winter Production by State: Top 11 of 2008
The top 11 winter wheat-producing states (and their total production) of 2008 was:
| Production Rankings: 2008 | ||
| Rank | State | Production (M bu) |
|---|---|---|
| 1 | KS | 360.0 |
| 2 | OK | 170.2 |
| 3 | SD | 104.0 |
| 4 | WA | 99.1 |
| 5 | TX | 99.0 |
| 6 | MT | 94.4 |
| 7 | IL | 73.6 |
| 8 | NE | 73.5 |
| 9 | OH | 73.0 |
| 10 | ID | 61.5 |
| 11 | CO | 58.9 |
State Winter Production – 2008
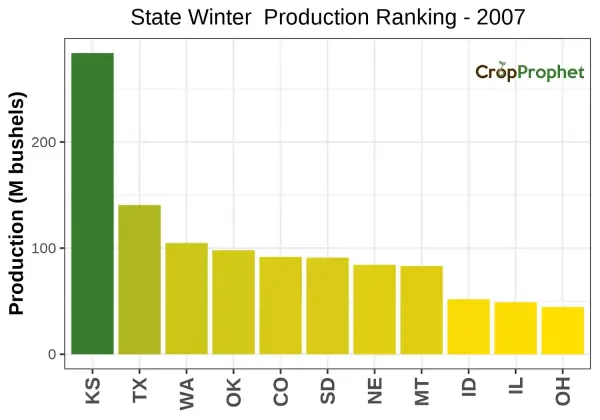
Winter Production by State: Top 11 of 2007
The top 11 winter wheat-producing states (and their total production) of 2007 was:
| Production Rankings: 2007 | ||
| Rank | State | Production (M bu) |
|---|---|---|
| 1 | KS | 283.8 |
| 2 | TX | 140.6 |
| 3 | WA | 104.8 |
| 4 | OK | 98.0 |
| 5 | CO | 91.7 |
| 6 | SD | 91.1 |
| 7 | NE | 84.3 |
| 8 | MT | 83.2 |
| 9 | ID | 51.8 |
| 10 | IL | 49.0 |
| 11 | OH | 44.5 |
State Winter Production – 2007
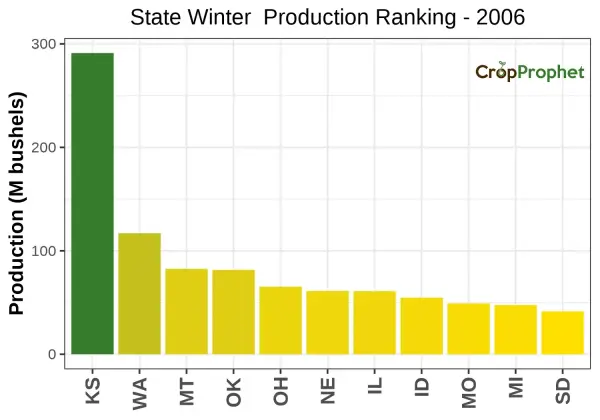
Winter Production by State: Top 11 of 2006
The top 11 winter wheat-producing states (and their total production) of 2006 was:
| Production Rankings: 2006 | ||
| Rank | State | Production (M bu) |
|---|---|---|
| 1 | KS | 291.2 |
| 2 | WA | 117.0 |
| 3 | MT | 82.6 |
| 4 | OK | 81.6 |
| 5 | OH | 65.3 |
| 6 | NE | 61.2 |
| 7 | IL | 61.0 |
| 8 | ID | 54.7 |
| 9 | MO | 49.1 |
| 10 | MI | 47.5 |
| 11 | SD | 41.4 |
State Winter Production – 2006
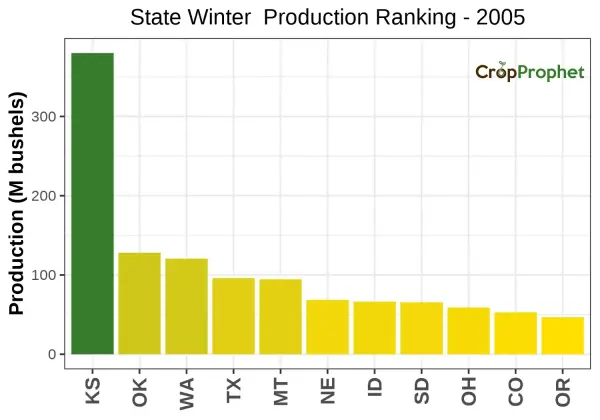
Winter Production by State: Top 11 of 2005
The top 11 winter wheat-producing states (and their total production) of 2005 was:
| Production Rankings: 2005 | ||
| Rank | State | Production (M bu) |
|---|---|---|
| 1 | KS | 380.0 |
| 2 | OK | 128.0 |
| 3 | WA | 120.6 |
| 4 | TX | 96.0 |
| 5 | MT | 94.5 |
| 6 | NE | 68.6 |
| 7 | ID | 66.4 |
| 8 | SD | 65.6 |
| 9 | OH | 58.9 |
| 10 | CO | 52.8 |
| 11 | OR | 46.7 |
State Winter Production – 2005
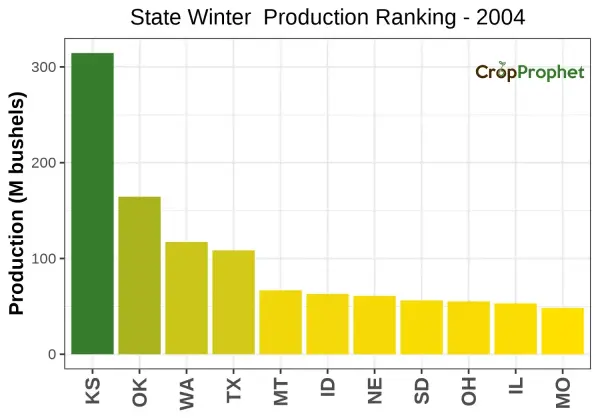
Winter Production by State: Top 11 of 2004
The top 11 winter wheat-producing states (and their total production) of 2004 was:
| Production Rankings: 2004 | ||
| Rank | State | Production (M bu) |
|---|---|---|
| 1 | KS | 314.5 |
| 2 | OK | 164.5 |
| 3 | WA | 117.2 |
| 4 | TX | 108.5 |
| 5 | MT | 66.8 |
| 6 | ID | 63.0 |
| 7 | NE | 61.0 |
| 8 | SD | 56.2 |
| 9 | OH | 55.2 |
| 10 | IL | 53.1 |
| 11 | MO | 48.4 |
State Winter Production – 2004
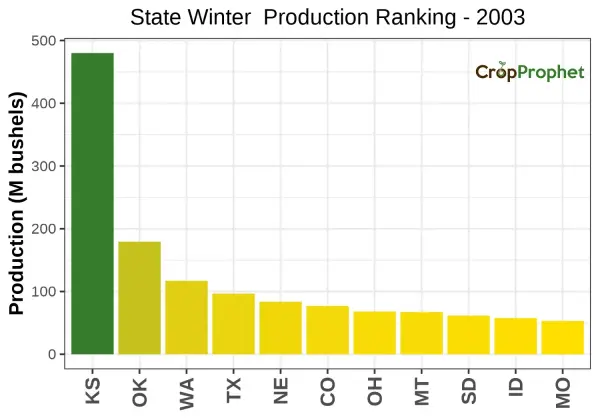
Winter Production by State: Top 11 of 2003
The top 11 winter wheat-producing states (and their total production) of 2003 was:
| Production Rankings: 2003 | ||
| Rank | State | Production (M bu) |
|---|---|---|
| 1 | KS | 480.0 |
| 2 | OK | 179.4 |
| 3 | WA | 117.0 |
| 4 | TX | 96.6 |
| 5 | NE | 83.7 |
| 6 | CO | 77.0 |
| 7 | OH | 68.0 |
| 8 | MT | 67.3 |
| 9 | SD | 61.5 |
| 10 | ID | 57.6 |
| 11 | MO | 53.1 |
State Winter Production – 2003
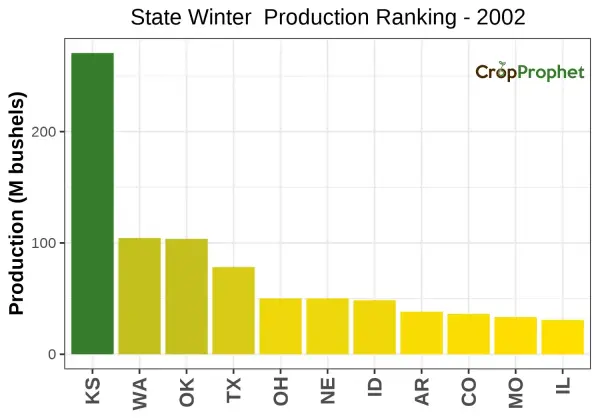
Winter Production by State: Top 11 of 2002
The top 11 winter wheat-producing states (and their total production) of 2002 was:
| Production Rankings: 2002 | ||
| Rank | State | Production (M bu) |
|---|---|---|
| 1 | KS | 270.6 |
| 2 | WA | 104.4 |
| 3 | OK | 103.6 |
| 4 | TX | 78.3 |
| 5 | OH | 50.2 |
| 6 | NE | 50.2 |
| 7 | ID | 48.5 |
| 8 | AR | 38.2 |
| 9 | CO | 36.3 |
| 10 | MO | 33.4 |
| 11 | IL | 30.9 |
State Winter Production – 2002
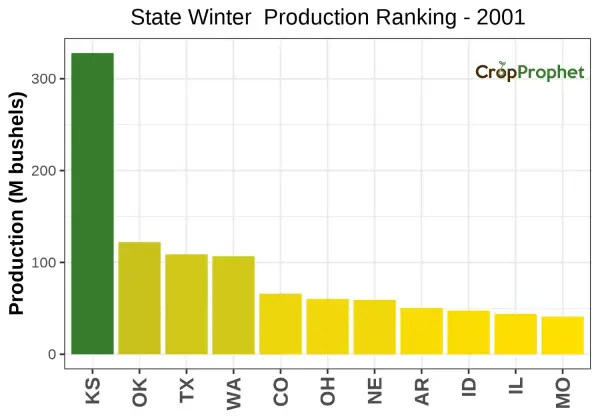
Winter Production by State: Top 11 of 2001
The top 11 winter wheat-producing states (and their total production) of 2001 was:
| Production Rankings: 2001 | ||
| Rank | State | Production (M bu) |
|---|---|---|
| 1 | KS | 328.0 |
| 2 | OK | 122.1 |
| 3 | TX | 108.8 |
| 4 | WA | 106.8 |
| 5 | CO | 66.0 |
| 6 | OH | 60.3 |
| 7 | NE | 59.2 |
| 8 | AR | 50.4 |
| 9 | ID | 47.5 |
| 10 | IL | 43.9 |
| 11 | MO | 41.0 |
State Winter Production – 2001
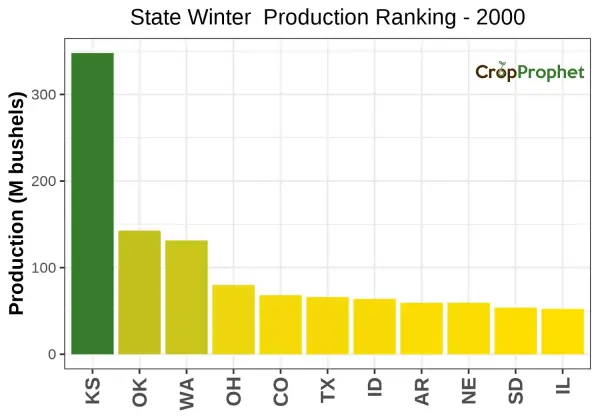
Winter Production by State: Top 11 of 2000
The top 11 winter wheat-producing states (and their total production) of 2000 was:
| Production Rankings: 2000 | ||
| Rank | State | Production (M bu) |
|---|---|---|
| 1 | KS | 347.8 |
| 2 | OK | 142.8 |
| 3 | WA | 131.4 |
| 4 | OH | 79.9 |
| 5 | CO | 68.2 |
| 6 | TX | 66.0 |
| 7 | ID | 63.9 |
| 8 | AR | 59.4 |
| 8 | NE | 59.4 |
| 10 | SD | 53.8 |
| 11 | IL | 52.4 |
State Winter Production – 2000
Winter Production by State: Top 11 of 2023
The top 11 winter wheat-producing states (and their total production) of 2023 was:
| Production Rankings: 2023 | ||
| Rank | State | Production (M bu) |
|---|---|---|
| 1 | KS | 201.2 |
| 2 | WA | 94.5 |
| 3 | MT | 85.7 |
| 4 | TX | 77.7 |
| 5 | CO | 74.6 |
| 6 | OK | 68.6 |
| 7 | IL | 67.9 |
| 8 | ID | 56.1 |
| 9 | OH | 53.1 |
| 10 | MI | 46.5 |
| 11 | MO | 42.0 |
State Winter Production – 2023

Winter Production by State: Top 11 of 2022
The top 11 winter wheat-producing states (and their total production) of 2022 was:
| Production Rankings: 2022 | ||
| Rank | State | Production (M bu) |
|---|---|---|
| 1 | KS | 244.2 |
| 2 | WA | 122.4 |
| 3 | OK | 68.6 |
| 4 | ID | 63.9 |
| 5 | MT | 59.4 |
| 6 | OR | 48.6 |
| 7 | IL | 44.2 |
| 8 | TX | 39.0 |
| 9 | SD | 38.0 |
| 10 | OH | 36.7 |
| 11 | CO | 35.8 |
State Winter Production – 2022

Winter Production by State: Top 11 of 2021
The top 11 winter wheat-producing states (and their total production) of 2021 was:
| Production Rankings: 2021 | ||
| Rank | State | Production (M bu) |
|---|---|---|
| 1 | KS | 364.0 |
| 2 | OK | 115.0 |
| 3 | TX | 74.0 |
| 4 | WA | 71.0 |
| 5 | CO | 69.6 |
| 6 | MT | 53.6 |
| 7 | IL | 48.2 |
| 8 | ID | 45.4 |
| 9 | MI | 45.4 |
| 10 | OH | 43.8 |
| 11 | NE | 41.2 |
State Winter Production – 2021

Winter Production by State: Top 11 of 2020
The top 11 winter wheat-producing states (and their total production) of 2020 was:
| Production Rankings: 2020 | ||
| Rank | State | Production (M bu) |
|---|---|---|
| 1 | KS | 281.2 |
| 2 | WA | 133.0 |
| 3 | OK | 102.0 |
| 4 | MT | 76.0 |
| 5 | ID | 65.7 |
| 6 | TX | 60.0 |
| 7 | OR | 46.4 |
| 8 | CO | 40.5 |
| 9 | IL | 35.4 |
| 10 | OH | 34.8 |
| 11 | SD | 34.2 |
State Winter Production – 2020

Winter Production by State: Top 11 of 2019
The top 11 winter wheat-producing states (and their total production) of 2019 was:
| Production Rankings: 2019 | ||
| Rank | State | Production (M bu) |
|---|---|---|
| 1 | KS | 348.4 |
| 2 | WA | 119.0 |
| 3 | OK | 110.0 |
| 4 | CO | 98.0 |
| 5 | MT | 95.0 |
| 6 | TX | 71.4 |
| 7 | ID | 59.2 |
| 8 | NE | 55.3 |
| 9 | OR | 49.6 |
| 10 | SD | 40.0 |
| 11 | IL | 36.9 |
State Winter Production – 2019

Winter Production by State: Top 11 of 2018
The top 11 winter wheat-producing states (and their total production) of 2018 was:
| Production Rankings: 2018 | ||
| Rank | State | Production (M bu) |
|---|---|---|
| 1 | KS | 277.4 |
| 2 | WA | 125.4 |
| 3 | MT | 78.5 |
| 4 | CO | 70.2 |
| 5 | OK | 70.0 |
| 6 | ID | 61.2 |
| 7 | TX | 56.0 |
| 8 | NE | 49.5 |
| 9 | OR | 46.6 |
| 10 | IL | 37.0 |
| 11 | MI | 35.7 |
State Winter Production – 2018

Winter Production by State: Top 11 of 2017
The top 11 winter wheat-producing states (and their total production) of 2017 was:
| Production Rankings: 2017 | ||
| Rank | State | Production (M bu) |
|---|---|---|
| 1 | KS | 333.6 |
| 2 | WA | 120.4 |
| 3 | OK | 98.6 |
| 4 | CO | 86.9 |
| 5 | TX | 68.2 |
| 6 | MT | 66.8 |
| 7 | ID | 53.6 |
| 8 | NE | 46.9 |
| 9 | OR | 43.5 |
| 10 | MO | 36.7 |
| 11 | IL | 35.7 |
State Winter Production – 2017

Winter Production by State: Top 11 of 2016
The top 11 winter wheat-producing states (and their total production) of 2016 was:
| Production Rankings: 2016 | ||
| Rank | State | Production (M bu) |
|---|---|---|
| 1 | KS | 467.4 |
| 2 | OK | 136.5 |
| 3 | WA | 130.3 |
| 4 | MT | 105.3 |
| 5 | CO | 105.1 |
| 6 | TX | 89.6 |
| 7 | NE | 70.7 |
| 8 | ID | 67.7 |
| 9 | SD | 63.8 |
| 10 | MI | 50.7 |
| 11 | OH | 44.8 |
State Winter Production – 2016

Winter Production by State: Top 11 of 2015
The top 11 winter wheat-producing states (and their total production) of 2015 was:
| Production Rankings: 2015 | ||
| Rank | State | Production (M bu) |
|---|---|---|
| 1 | KS | 321.9 |
| 2 | TX | 106.5 |
| 3 | OK | 98.8 |
| 4 | MT | 91.0 |
| 5 | WA | 89.0 |
| 6 | CO | 81.0 |
| 7 | ID | 58.2 |
| 8 | NE | 46.0 |
| 9 | SD | 42.7 |
| 10 | MI | 38.5 |
| 11 | OR | 34.5 |
State Winter Production – 2015

Winter Production by State: Top 11 of 2014
The top 11 winter wheat-producing states (and their total production) of 2014 was:
| Production Rankings: 2014 | ||
| Rank | State | Production (M bu) |
|---|---|---|
| 1 | KS | 246.4 |
| 2 | MT | 91.8 |
| 3 | CO | 89.3 |
| 4 | WA | 85.3 |
| 5 | NE | 71.0 |
| 6 | TX | 67.5 |
| 7 | SD | 59.4 |
| 8 | ID | 58.4 |
| 9 | OK | 47.6 |
| 10 | IL | 44.9 |
| 11 | NC | 44.7 |
State Winter Production – 2014

Winter Production by State: Top 11 of 2013
The top 11 winter wheat-producing states (and their total production) of 2013 was:
| Production Rankings: 2013 | ||
| Rank | State | Production (M bu) |
|---|---|---|
| 1 | KS | 321.1 |
| 2 | WA | 115.2 |
| 3 | OK | 105.4 |
| 4 | MT | 81.7 |
| 5 | TX | 68.2 |
| 6 | ID | 63.6 |
| 7 | IL | 56.3 |
| 8 | MO | 56.1 |
| 9 | NC | 52.7 |
| 10 | OR | 48.4 |
| 11 | KY | 45.8 |
State Winter Production – 2013

Winter Production by State: Top 11 of 2012
The top 11 winter wheat-producing states (and their total production) of 2012 was:
| Production Rankings: 2012 | ||
| Rank | State | Production (M bu) |
|---|---|---|
| 1 | KS | 382.2 |
| 2 | OK | 154.8 |
| 3 | WA | 116.9 |
| 4 | TX | 95.7 |
| 5 | MT | 84.6 |
| 6 | CO | 68.2 |
| 7 | SD | 60.5 |
| 8 | ID | 59.2 |
| 9 | NE | 53.3 |
| 10 | OR | 51.8 |
| 11 | NC | 42.2 |
State Winter Production – 2012

Winter Production by State: Top 11 of 2011
The top 11 winter wheat-producing states (and their total production) of 2011 was:
| Production Rankings: 2011 | ||
| Rank | State | Production (M bu) |
|---|---|---|
| 1 | KS | 278.2 |
| 2 | WA | 128.0 |
| 3 | MT | 89.8 |
| 4 | CO | 74.0 |
| 5 | OK | 73.6 |
| 6 | SD | 66.8 |
| 7 | NE | 66.6 |
| 8 | OR | 65.1 |
| 9 | ID | 64.7 |
| 10 | MI | 50.6 |
| 11 | OH | 48.5 |
State Winter Production – 2011

Winter Production by State: Top 11 of 2010
The top 11 winter wheat-producing states (and their total production) of 2010 was:
| Production Rankings: 2010 | ||
| Rank | State | Production (M bu) |
|---|---|---|
| 1 | KS | 360.0 |
| 2 | TX | 123.8 |
| 3 | OK | 119.3 |
| 4 | WA | 118.7 |
| 5 | CO | 101.0 |
| 6 | MT | 93.1 |
| 7 | NE | 64.1 |
| 8 | SD | 63.7 |
| 9 | ID | 58.2 |
| 10 | OR | 52.9 |
| 11 | OH | 42.7 |
State Winter Production – 2010

Winter Production by State: Top 11 of 2009
The top 11 winter wheat-producing states (and their total production) of 2009 was:
| Production Rankings: 2009 | ||
| Rank | State | Production (M bu) |
|---|---|---|
| 1 | KS | 375.9 |
| 2 | CO | 98.8 |
| 3 | WA | 97.4 |
| 4 | MT | 89.5 |
| 5 | NE | 77.3 |
| 6 | OK | 74.8 |
| 7 | OH | 67.4 |
| 8 | SD | 64.8 |
| 9 | TX | 61.2 |
| 10 | ID | 58.3 |
| 11 | IL | 45.9 |
State Winter Production – 2009

Winter Production by State: Top 11 of 2008
The top 11 winter wheat-producing states (and their total production) of 2008 was:
| Production Rankings: 2008 | ||
| Rank | State | Production (M bu) |
|---|---|---|
| 1 | KS | 360.0 |
| 2 | OK | 170.2 |
| 3 | SD | 104.0 |
| 4 | WA | 99.1 |
| 5 | TX | 99.0 |
| 6 | MT | 94.4 |
| 7 | IL | 73.6 |
| 8 | NE | 73.5 |
| 9 | OH | 73.0 |
| 10 | ID | 61.5 |
| 11 | CO | 58.9 |
State Winter Production – 2008

Winter Production by State: Top 11 of 2007
The top 11 winter wheat-producing states (and their total production) of 2007 was:
| Production Rankings: 2007 | ||
| Rank | State | Production (M bu) |
|---|---|---|
| 1 | KS | 283.8 |
| 2 | TX | 140.6 |
| 3 | WA | 104.8 |
| 4 | OK | 98.0 |
| 5 | CO | 91.7 |
| 6 | SD | 91.1 |
| 7 | NE | 84.3 |
| 8 | MT | 83.2 |
| 9 | ID | 51.8 |
| 10 | IL | 49.0 |
| 11 | OH | 44.5 |
State Winter Production – 2007

Winter Production by State: Top 11 of 2006
The top 11 winter wheat-producing states (and their total production) of 2006 was:
| Production Rankings: 2006 | ||
| Rank | State | Production (M bu) |
|---|---|---|
| 1 | KS | 291.2 |
| 2 | WA | 117.0 |
| 3 | MT | 82.6 |
| 4 | OK | 81.6 |
| 5 | OH | 65.3 |
| 6 | NE | 61.2 |
| 7 | IL | 61.0 |
| 8 | ID | 54.7 |
| 9 | MO | 49.1 |
| 10 | MI | 47.5 |
| 11 | SD | 41.4 |
State Winter Production – 2006

Winter Production by State: Top 11 of 2005
The top 11 winter wheat-producing states (and their total production) of 2005 was:
| Production Rankings: 2005 | ||
| Rank | State | Production (M bu) |
|---|---|---|
| 1 | KS | 380.0 |
| 2 | OK | 128.0 |
| 3 | WA | 120.6 |
| 4 | TX | 96.0 |
| 5 | MT | 94.5 |
| 6 | NE | 68.6 |
| 7 | ID | 66.4 |
| 8 | SD | 65.6 |
| 9 | OH | 58.9 |
| 10 | CO | 52.8 |
| 11 | OR | 46.7 |
State Winter Production – 2005

Winter Production by State: Top 11 of 2004
The top 11 winter wheat-producing states (and their total production) of 2004 was:
| Production Rankings: 2004 | ||
| Rank | State | Production (M bu) |
|---|---|---|
| 1 | KS | 314.5 |
| 2 | OK | 164.5 |
| 3 | WA | 117.2 |
| 4 | TX | 108.5 |
| 5 | MT | 66.8 |
| 6 | ID | 63.0 |
| 7 | NE | 61.0 |
| 8 | SD | 56.2 |
| 9 | OH | 55.2 |
| 10 | IL | 53.1 |
| 11 | MO | 48.4 |
State Winter Production – 2004

Winter Production by State: Top 11 of 2003
The top 11 winter wheat-producing states (and their total production) of 2003 was:
| Production Rankings: 2003 | ||
| Rank | State | Production (M bu) |
|---|---|---|
| 1 | KS | 480.0 |
| 2 | OK | 179.4 |
| 3 | WA | 117.0 |
| 4 | TX | 96.6 |
| 5 | NE | 83.7 |
| 6 | CO | 77.0 |
| 7 | OH | 68.0 |
| 8 | MT | 67.3 |
| 9 | SD | 61.5 |
| 10 | ID | 57.6 |
| 11 | MO | 53.1 |
State Winter Production – 2003

Winter Production by State: Top 11 of 2002
The top 11 winter wheat-producing states (and their total production) of 2002 was:
| Production Rankings: 2002 | ||
| Rank | State | Production (M bu) |
|---|---|---|
| 1 | KS | 270.6 |
| 2 | WA | 104.4 |
| 3 | OK | 103.6 |
| 4 | TX | 78.3 |
| 5 | OH | 50.2 |
| 6 | NE | 50.2 |
| 7 | ID | 48.5 |
| 8 | AR | 38.2 |
| 9 | CO | 36.3 |
| 10 | MO | 33.4 |
| 11 | IL | 30.9 |
State Winter Production – 2002

Winter Production by State: Top 11 of 2001
The top 11 winter wheat-producing states (and their total production) of 2001 was:
| Production Rankings: 2001 | ||
| Rank | State | Production (M bu) |
|---|---|---|
| 1 | KS | 328.0 |
| 2 | OK | 122.1 |
| 3 | TX | 108.8 |
| 4 | WA | 106.8 |
| 5 | CO | 66.0 |
| 6 | OH | 60.3 |
| 7 | NE | 59.2 |
| 8 | AR | 50.4 |
| 9 | ID | 47.5 |
| 10 | IL | 43.9 |
| 11 | MO | 41.0 |
State Winter Production – 2001

Winter Production by State: Top 11 of 2000
The top 11 winter wheat-producing states (and their total production) of 2000 was:
| Production Rankings: 2000 | ||
| Rank | State | Production (M bu) |
|---|---|---|
| 1 | KS | 347.8 |
| 2 | OK | 142.8 |
| 3 | WA | 131.4 |
| 4 | OH | 79.9 |
| 5 | CO | 68.2 |
| 6 | TX | 66.0 |
| 7 | ID | 63.9 |
| 8 | AR | 59.4 |
| 8 | NE | 59.4 |
| 10 | SD | 53.8 |
| 11 | IL | 52.4 |
State Winter Production – 2000
