Yield Impact of an Emerging Drought
The US grain belt has experienced below-normal precipitation as Spring 2023 has evolved, as shown in the CropProphet-generated graphic below. The grain market is closely watching for drought-busting precipitation forecasts.
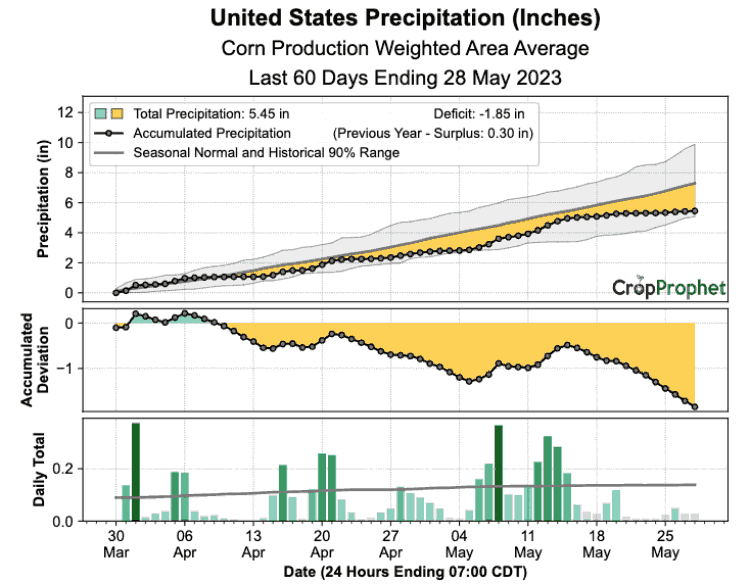
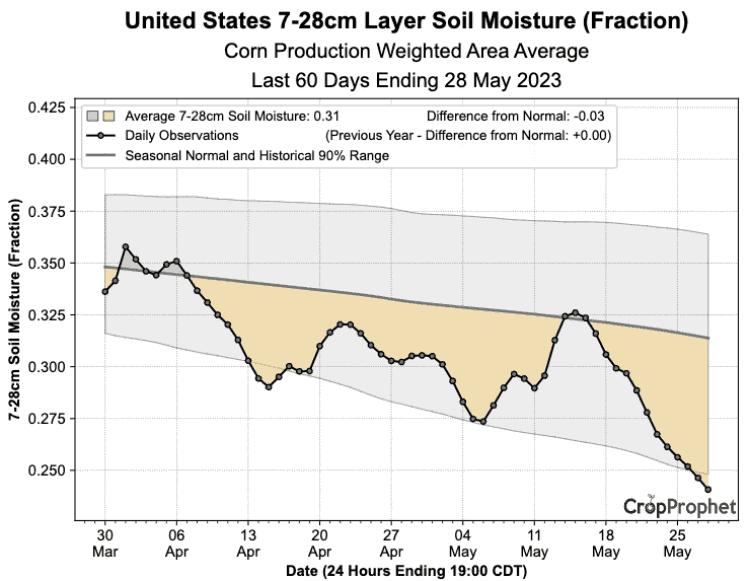
While relatively dry conditions enable rapid crop planting, it also reduces soil moisture across the grain belt and eventually stresses the corn and soybean crop. This could eventually affect 2023 end-of-season corn and soybean yields. The graphic below shows the rapid decrease in soil moisture in recent days, which will continue if normal to above-normal amounts of precipitation do not fall in the coming weeks.
When do dry conditions impact yield?
Over the past week, in the face of continued drier-than-normal precipitation conditions and weather forecasts across the US grain belt, several CropProphet customers and prospects asked, “When do the dry conditions start to impact corn yield?” As grain traders, they want to ensure they are on top of important weather events that may impact corn and soybean yield and production.
We seek to answer that question using data from CropProphet Modeler (which supports discretionary and systematic grain traders).

Crop Weather Data
To answer the question, we start with US county-level daily precipitation as a percent of normal data from CropProphet. Next, the county-level data is reduced to a single national corn and soybean production weighted daily statistic for each year from 1986 to 2022. We then calculate the rolling 90-day average and pull out one value per week between May and August.
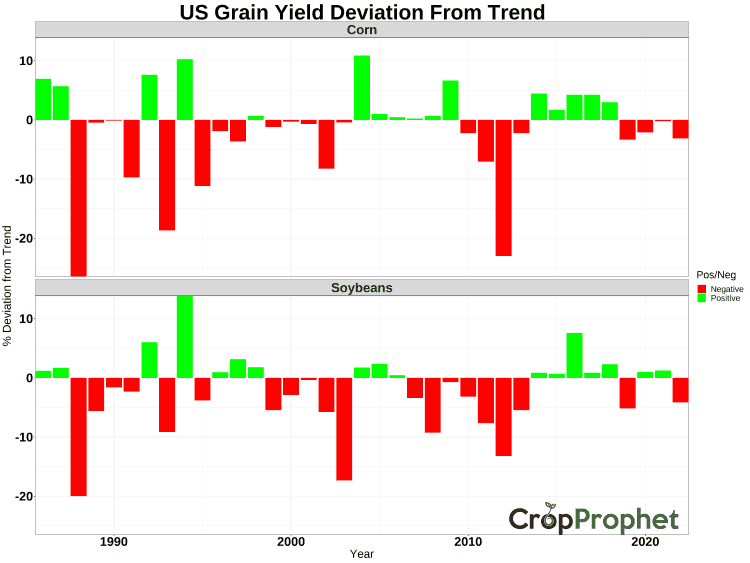
We also calculate each crop’s percent deviation from corn and soybean trend yield. CropProphet includes a proprietary calculation of trend yield. By removing the trend estimate and normalizing by the trend yield estimate, we can compare between years in the historical crop yield data. The history of corn and soybean yield trends is shown below.
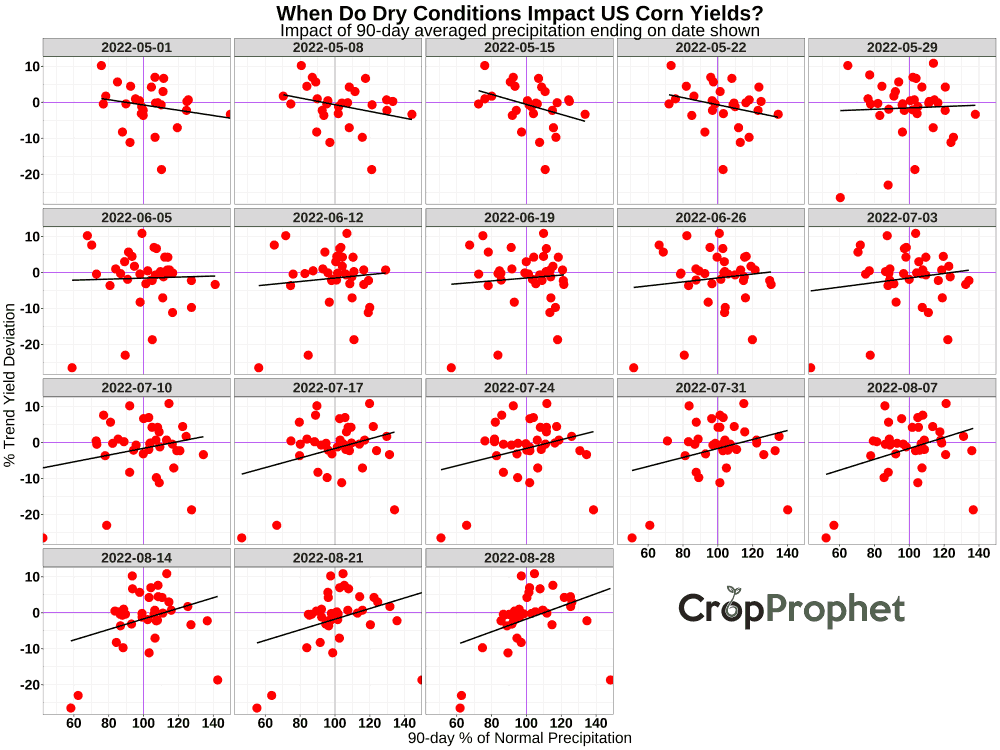
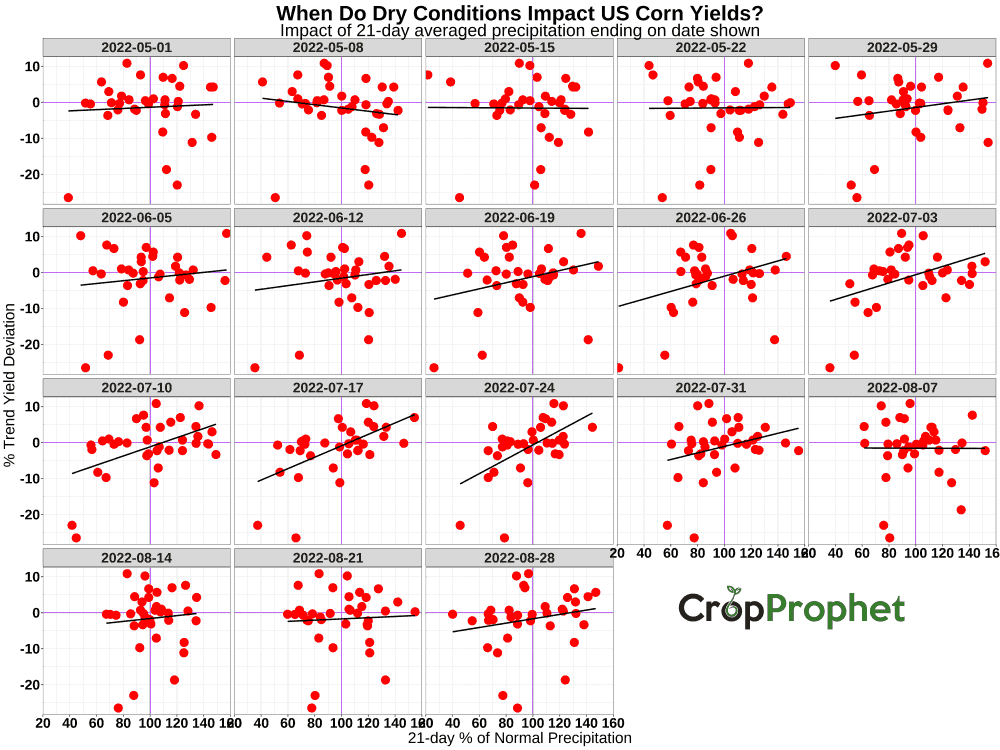
Corn: When do drought conditions impact yield?
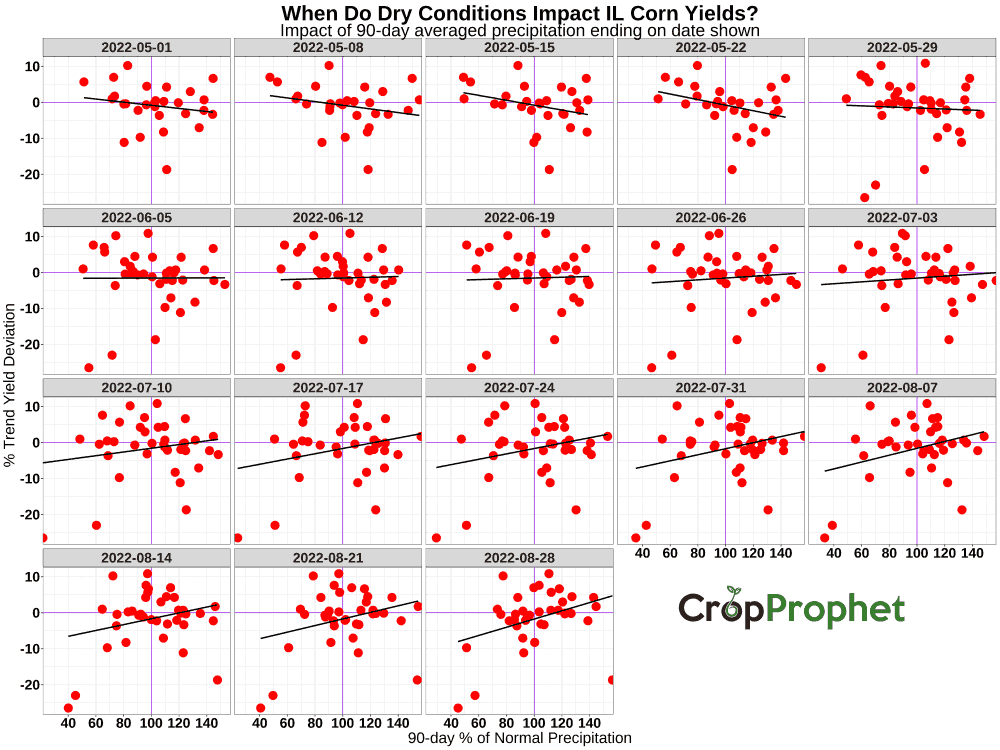
The results for corn are shown below. Both 90-day and 21-day average precipitation as a percent of normal ending on the date shown in each square is shown. The negative slope of a linear fit line (the black line descending from left to right) during May indicates that dry conditions in May tends to increase the end-of-season corn yield. Corn yield forecasts during a dry May should be increasing.
By the end of May and into June, the slope of the line is near zero or positive, suggesting low precipitation impacts end-of-season yields by this point in the growing season. By mid-July and into August, the slope of the line is negative, meaning the reduced rainfall prior to this time of the growing season negatively negatively impacting corn yields.
So, the answer to the question “When do dry conditions impact US corn yield?” is “by the start of June to early June.”
90-day Average Precipitation Deviation From Normal
21-day Average Precipitation Deviation From Normal
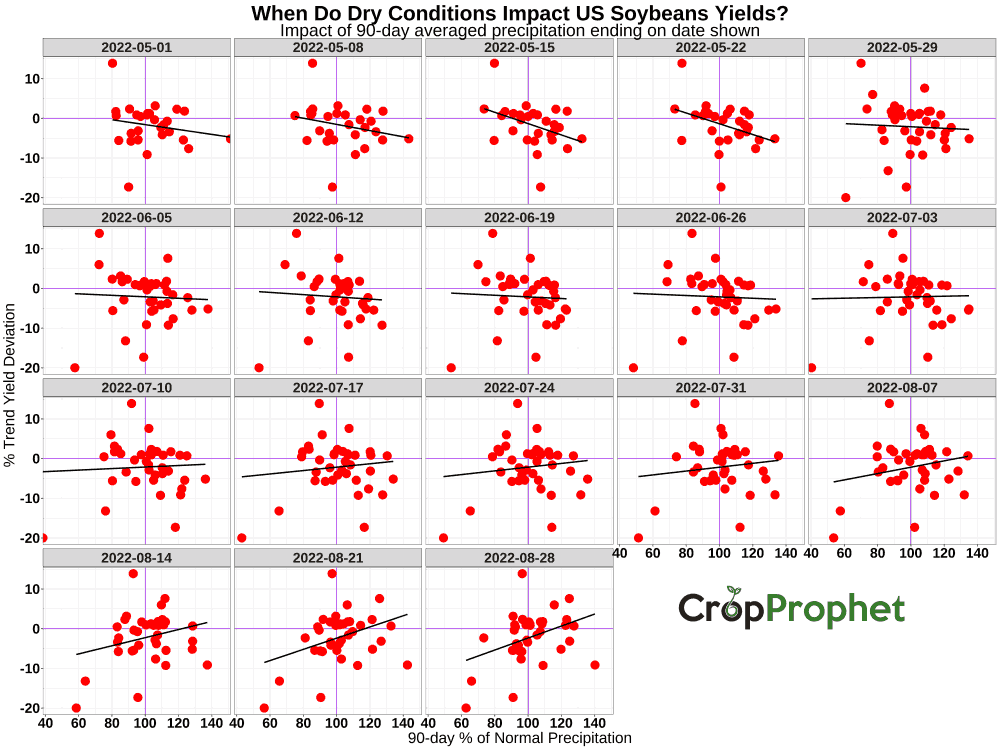
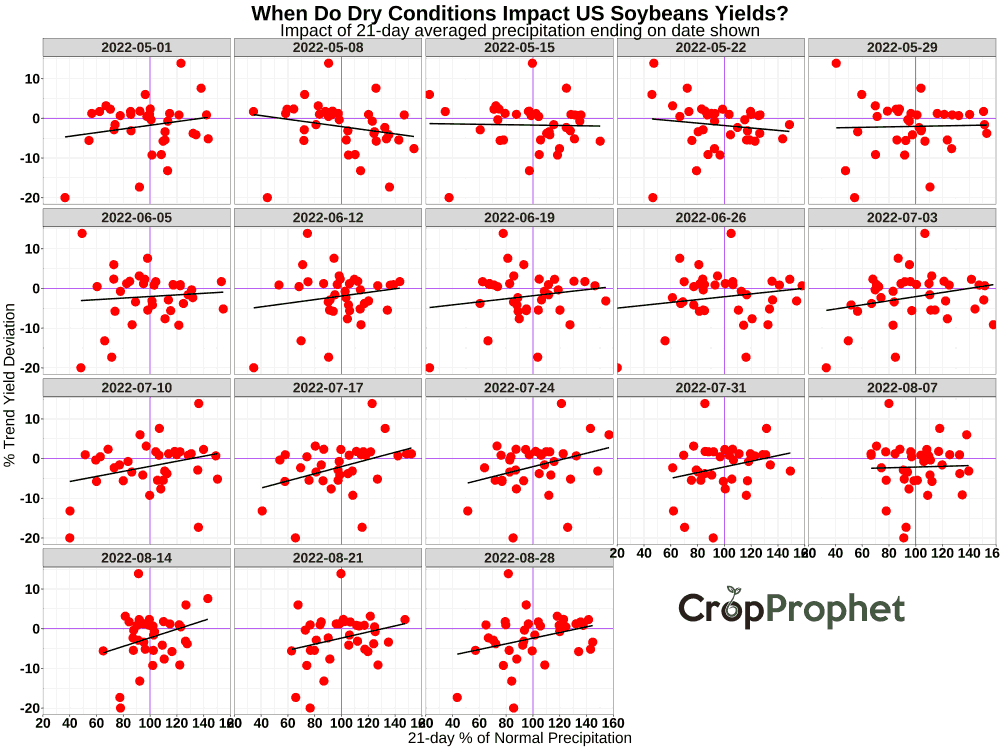
Soybeans: When do dry conditions impact yield?
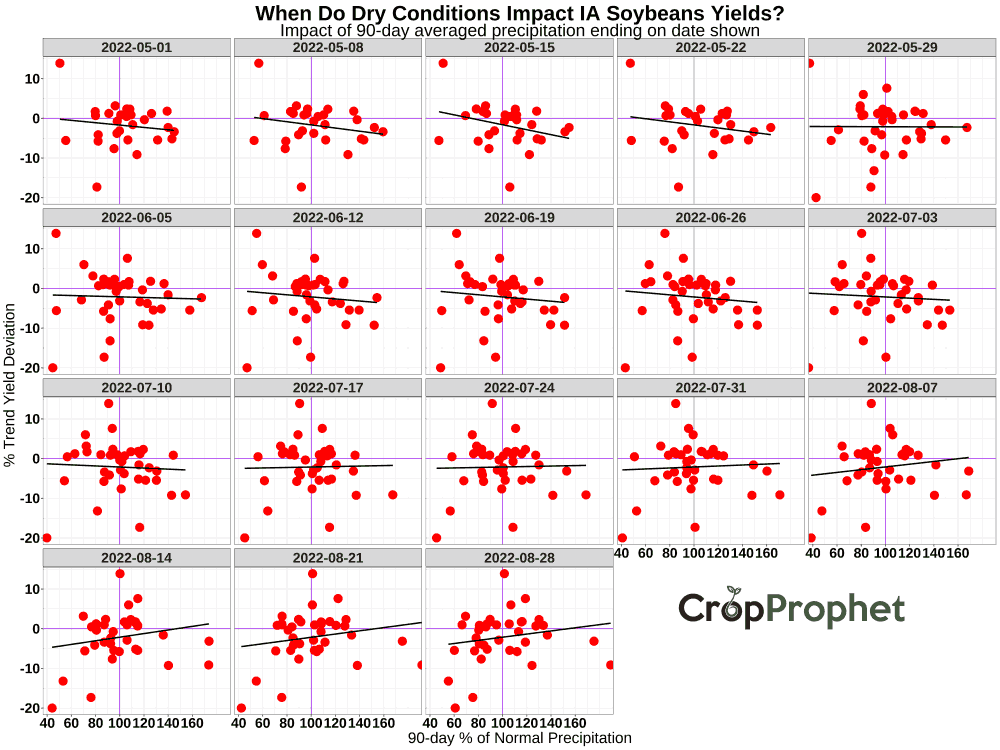
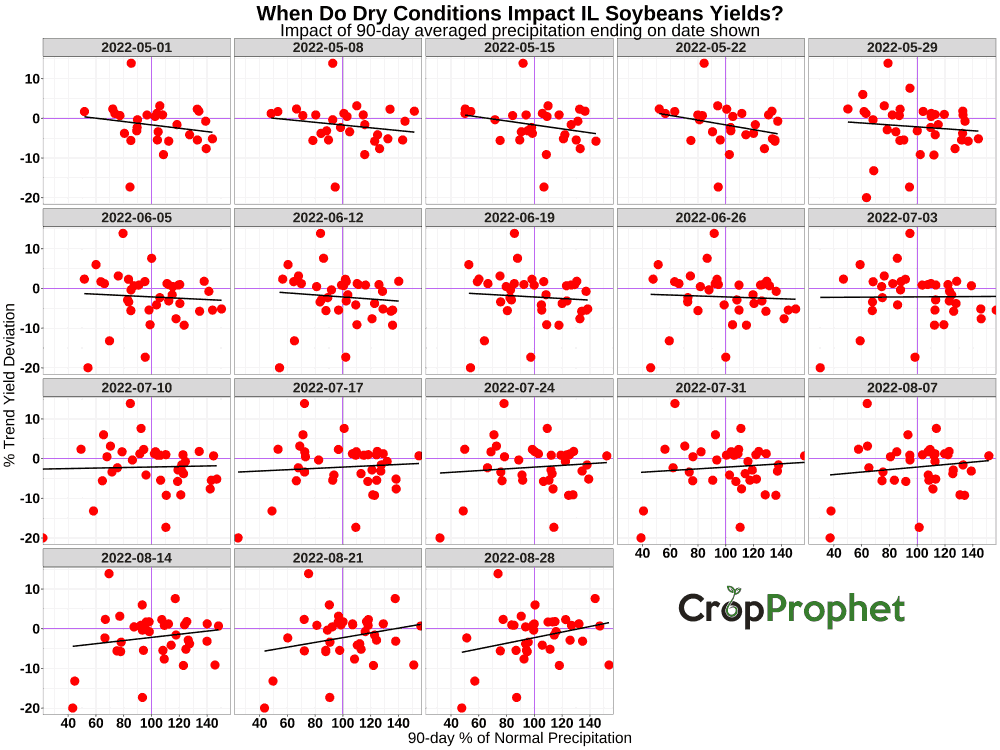
The results are not as clear for soybeans. Early season 90-day averaged below-normal US soybean precipitation is associated with positive yield development, especially in mid-May. However, by mid-July, the slope of the linear fit line has turned positive, indicating dry conditions negatively impact soybean yields.
90-day Average Precipitation Deviation From Normal
21-day Average Precipitation Deviation From Normal
The 21-day averaged results show impacts occurring earlier in the season as compared to the 90-day precip average. However, by mid-June the slope of the regression line is clearly positive and the soybean yield is being negative impacted by the lack of precipitation.
So, the 21-day average precipitation results suggest the answer to the question for soybeans is also “by mid-June.”
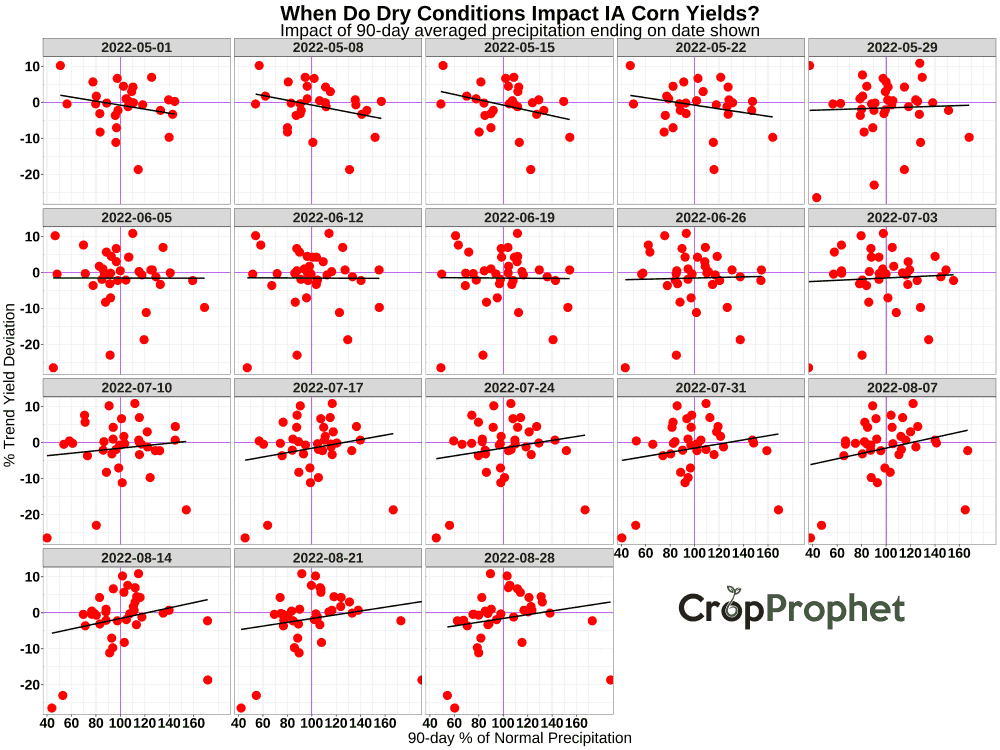
State Level Analysis
The same analysis is provided below for two of the most important corn and soybean-growing states. Again, the results are consistent with the national-level research.
Iowa – Corn
Iowa – Soybeans
Illinois – Corn
Illinois – Soybeans
Weather-based Grain Yield Forecasts
CropProphet provides weather-based grain yield forecasts for grain traders. Our objective yield forecasting process is based on repeatable statistical processes and is not subject to human influences or market hype. As a result, our customers use CropProphet to trade more profitably by understanding the weather’s impact on crop production.