Drought Busting Rainfall
Recent US forecasts have elicited questions in places like YouTube and Twitter regarding whether or not enough precipitation will fall in the Midwestern US to “bust the drought.”
The questions usually come with an opinion about whether or not enough rain will fall to impact existing drought conditions materially.
The grain market is aware that drought negative impacts crop production, but has “the market” ever quantified how much precipitation is required to actually change drought conditions?
Current Drought Conditions in the United States
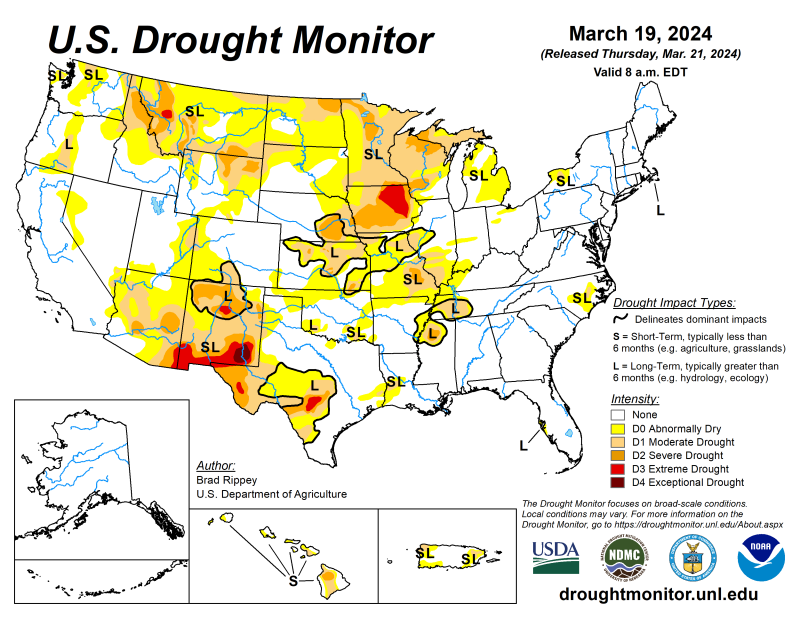
The US Drought Monitor (USDM) indicates drought conditions as of March 19, 2023 exist in parts of the Midwestern US, with a focus on Iowa, the second-most corn-productive state.
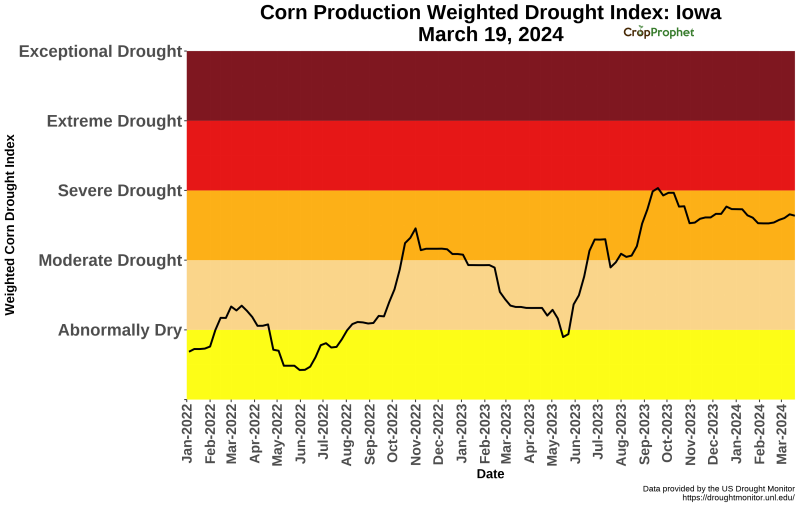
Our Iowa corn-production weighted drought index indicates the Iowa corn crop is in severe drought conditions overall.
What is Drought Busting Precipitation?
At CropProphet, we believe grain trading decisions are best made with objective information based on repeatable, unbiased analysis of available data. In light of the questions regarding whether or not the current precipitation forecast is drought-busting or not, we ask, “How much rain is necessary to bust a drought?”
Data for Drought Busting Analysis
We use two data sources to analyze how much rainfall is required to bust a drought. They are:
1) The USDM history of county drought conditions. The USDM publishes the county-level full history of weekly drought monitor releases, which started in 2000. The data provided indicates the percentage of each county experiencing one of five different drought categories, from no impact to exceptional drought. The data is transformed into the drought index described in an earlier post.
Finally, the weekly change of the index for each county is calculated. Weeks with no change in the drought category are removed.
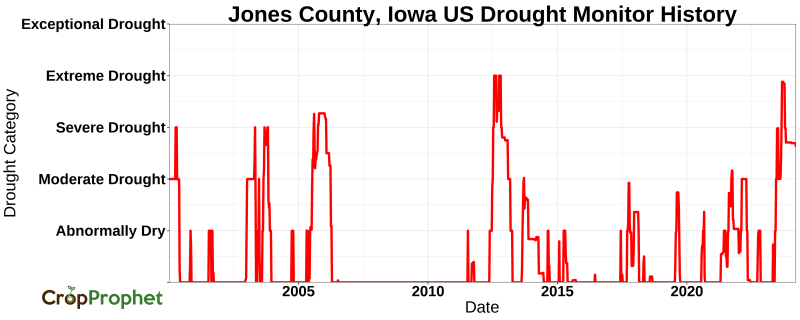
An example history of the drought index from Jones County, Iowa is shown below.
2) The CropProphet Modeler history of daily, US county-level precipitation. We calculated the 7, 14, 21, and 28-day rolling accumulated precipitation for each county as the drought data is available for the same years.
The accumulated precipitation data is aligned with the drought data, so precipitation accumulation ends on the day before each drought monitor “valid date,” which is the first day of the seven-day weekly update.
This facilitates comparing the amount of rain that fell when the drought monitor changed the category from one week to the next.
Drought Busting in Jones County, Iowa
We focus on Iowa because the grain market’s current concern focuses on drought in this important grain producing state.
The figure below shows the logarithm of the seven, 14, 21, and 28-day accumulated precipitation vs the weekly drought category change since 2000 for Jones County, Iowa.
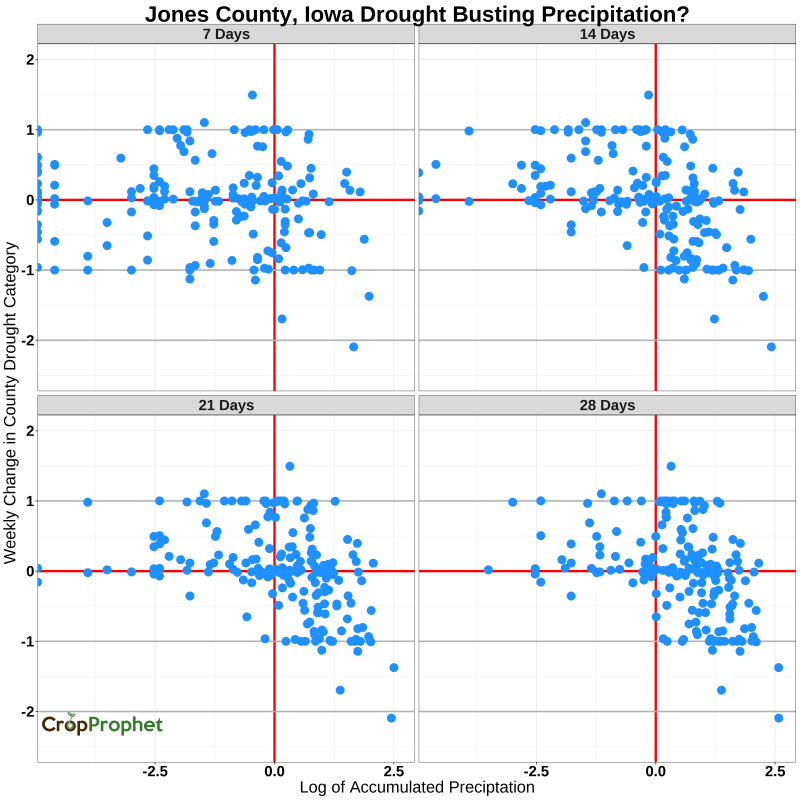
A negative Y-axis value means a reduction (i.e., improvement) in the drought for that week. A positive value means the drought strengthened.

The Jones County image above also shows no relationship between the seven-day accumulated rainfall and the weekly drought category change. A relationship starts to emerge for 14-day accumulated rainfall and becomes more evident for the 21 and 28-day accumulation periods.
As we might expect, significant rainfall over 14 or more days results in reductions of the drought category. Likewise, reduced precipitation tends to strengthen drought conditions. However, we also see that a wide range of precipitation totals can yield an increase in the drought category (i.e., Y-axis values = +1) and no change (Y-axis values = 0).
Iowa Drought Busting Precipitation
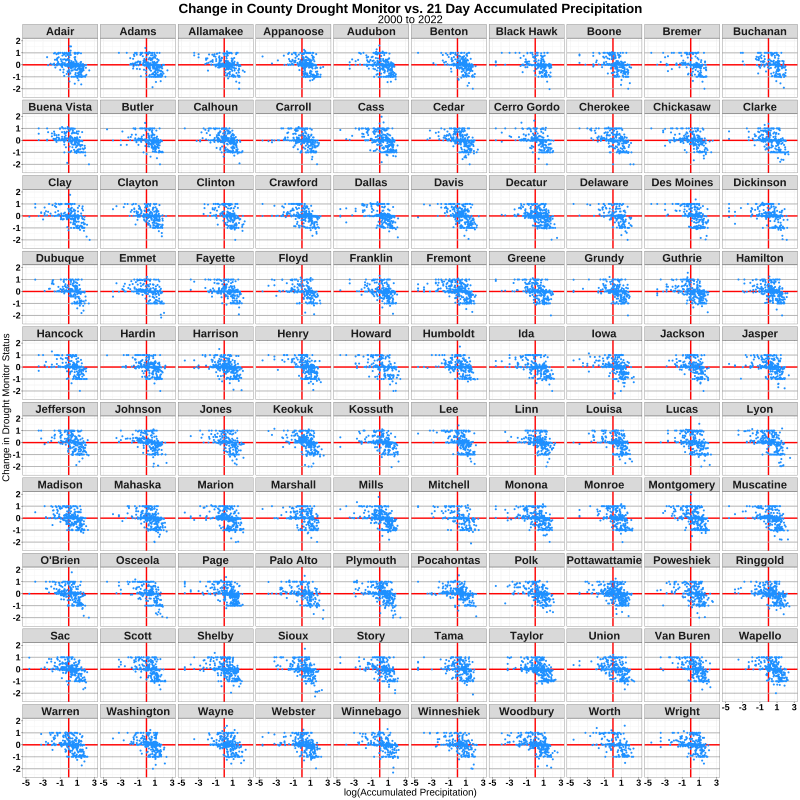
The analysis is repeated for every county in Iowa, as shown in the below graphic. If you click on the image, you will see a full-size version of the graphic. Figure XX shows the relationship is largely the same for each county.
How much rain is necessary to bust a drought?
We seek to keep this analysis simple, so we revised our question slightly to “How much precipitation is required to reduce the drought category by more than one category?” We answer this question by calculating the average 21-day accumulated precipitation in each Iowa county when more than one drought category reduction occurs (i.e., for all precipitation accumulation values when the Y-axis is less than -1).
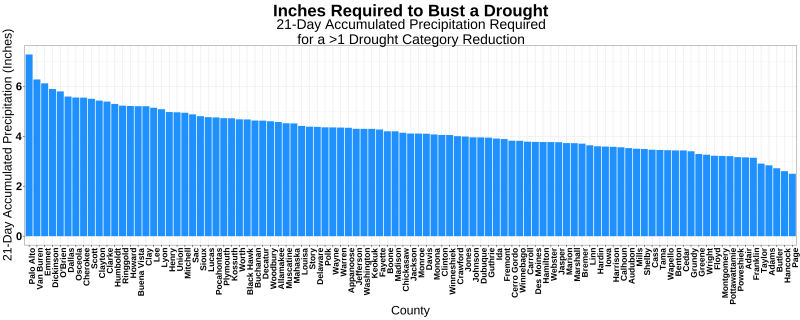
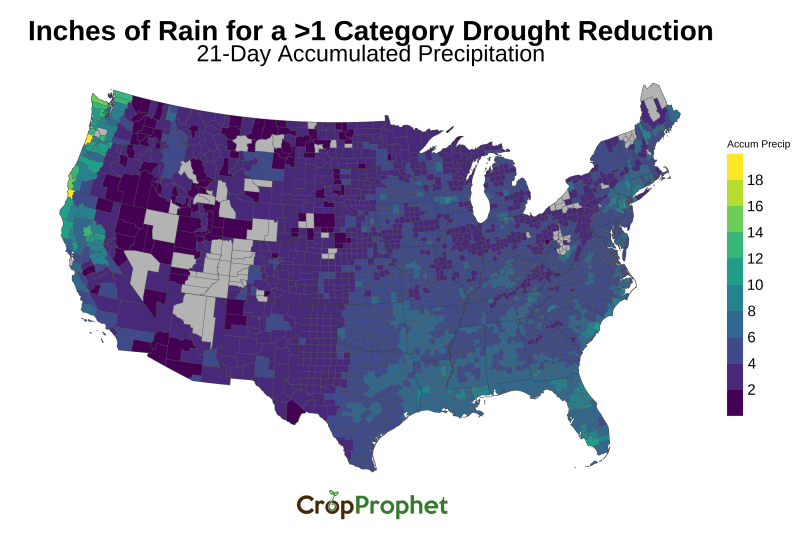
Approximately three to six inches of rainfall is required for the drought category to decrease by more than one. The same data is presented as a map, below.
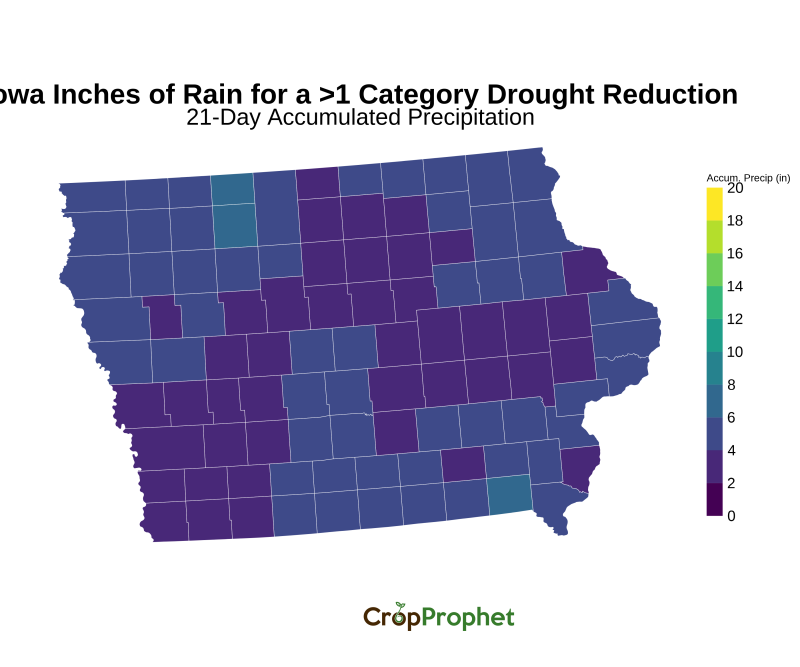
To estimate how much rainfall is required to bust a drought, you can multiply the average accumulated precipitation number from the map by a count of the drought categories for each county.
How much precipitation?
The Iowa corn-production weighted drought index is currently in the severe drought, or third category. So, for the drought to be reduced to no impact, corn-production weighted Iowa needs to receive approximately 3 * (4 or 5) inches = 12 to 15 inches of rain over the next 21 days.
US Drought Busting Rainfall
The same analysis can be conducted for the lower 48 US states. This result is shown below. The counties in colored in grey have not had a greater than one category drought reduction reduction since the USDM started in 2000.
Is this a Drought Busting Forecast?
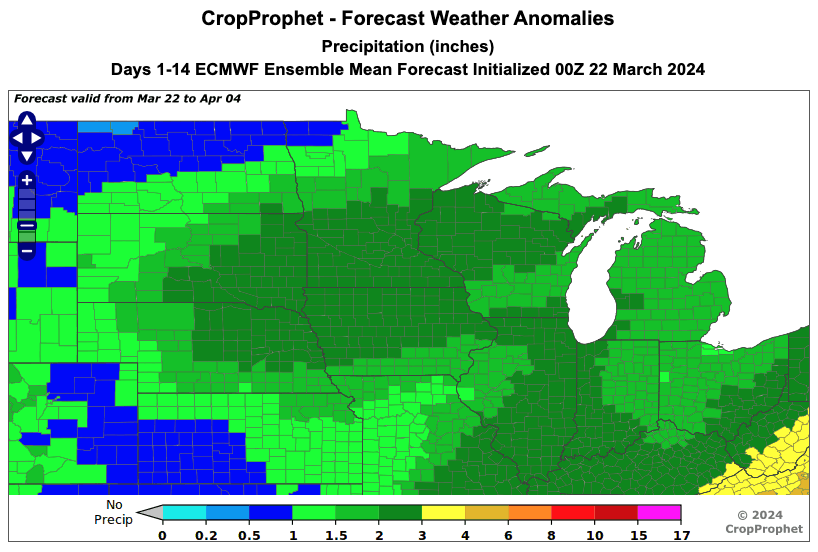
The 14-day accumulated precipitation forecast as of March 21, 2024 is shown below. The forecast accumulated precipitation in Iowa ranges from two inches to slightly greater than three inches over 14 days. The objective analysis presented here suggests this is not a drought-busting forecast.
