US Corn Production by State: The Top 11
The primary cause of year-to-year variation in corn production by state is:
- The number of acres planted by producers to grow corn. In some states, many million acres of land are planted with corn, resulting in billions of bushels of corn production.
- The weather conditions that occur during the corn growing season.
CropProphet helps grain traders, grain merchandisers, and discretionary and systematic commodity traders manage weather risk by
- providing objective agriculture-focused weather information and analytics for major grain exporting countries
- using machine learning combined with historical weather and crop data to forecast USDA end-of-season crop yields and production.
A wide range of grain commodity traders seizes grain market trading opportunities using CropProphet by knowing the differences between market perceptions of corn production and our forecast. As the market perception corrects toward the CropProphet forecasts, corn prices change. Our customers have an information advantage in the grain market.
Start using CropProphet to stay ahead of the grain market—click here.

Check out CropProphet’s June 2025 US Grain Market Weather Discussion.
Table of Contents
State Corn Production Rankings
Where is Corn Grown in the United States
What State Produces the Most Corn
Rankings of State Corn Production by Year
| 2000-2004 | 2005-2009 | 2010-2014 | 2015-2019 | 2020-2024 |
|---|---|---|---|---|
State Corn Production Rankings
According to the USDA NASS, 41 states produced a significant harvestable amount of corn in 2024. The United States produced 14.9 billion bushels of corn in 2024, down from 15.3 billion bushels in 2023. A lot of corn is grown each year in the United States.
Despite drought impacting the growing season, Iowa ranked first in corn production in 2024. Iowa produced 918 times more corn than West Virginia, which ranks #41 in US corn production by state.
National corn prices (i.e., corn futures prices) during each year are impacted by the national production level and frequently by how much a specific state produces. The market perceptions of the corn and soybean production forecasts at the county level directly impact local cash crop basis prices. This can have a direct impact on the corn producer. As a result, understanding not only corn production but also forecasts of corn production can have important financial implications for all participants in the grain markets. But first, let’s examine where corn is grown in the United States.
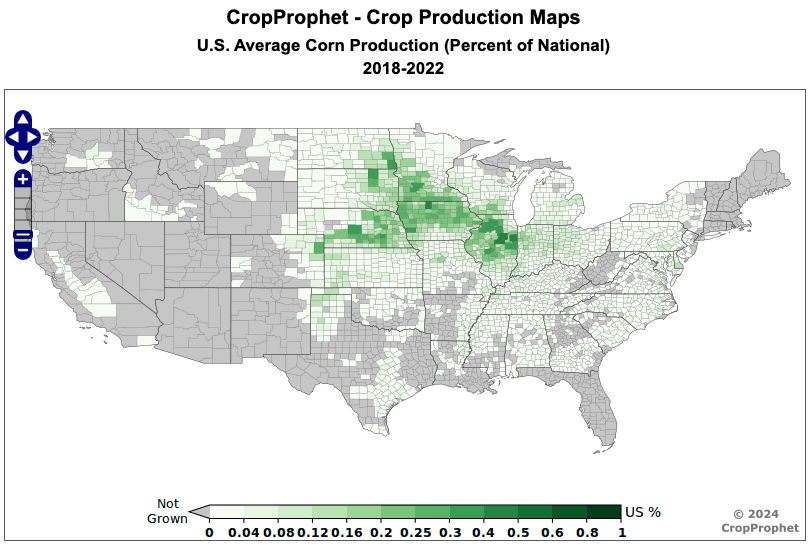
Where is Corn Grown in the United States?
The graphic below shows where corn is grown in the United States. Each county with a green color regularly grows corn, and production is reported to the USDA.
The ranking of corn production by year is presented below.
What State Produces the Most Corn?
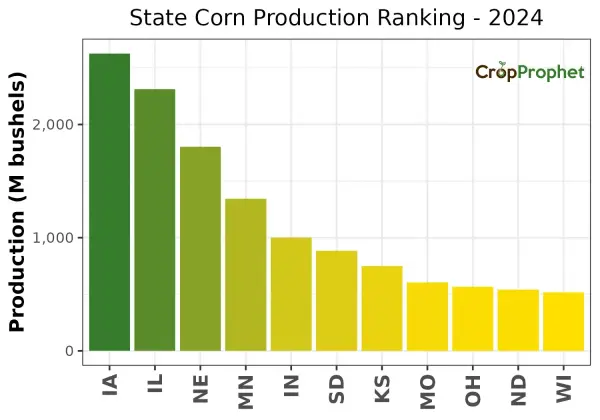
What state produces the most corn? The tables below show that in 2024, Iowa produced just over 2.6 billion bushels of corn, making it the #1 producer of corn in the United States. Illinois produced 2.31 billion bushels, making it the 2nd most productive corn-growing state.

Corn Production by State: Top 11 of 2024
The top 11 corn-producing states (and their total production) of 2024 was:
| Production Rankings: 2024 | ||
| Rank | State | Production (M bu) |
|---|---|---|
| 1 | IA | 2626.9 |
| 2 | IL | 2311.1 |
| 3 | NE | 1802.9 |
| 4 | MN | 1345.0 |
| 5 | IN | 999.9 |
| 6 | SD | 884.0 |
| 7 | KS | 748.2 |
| 8 | MO | 603.9 |
| 9 | OH | 566.4 |
| 10 | ND | 542.4 |
| 11 | WI | 515.0 |
State Corn Production – 2024
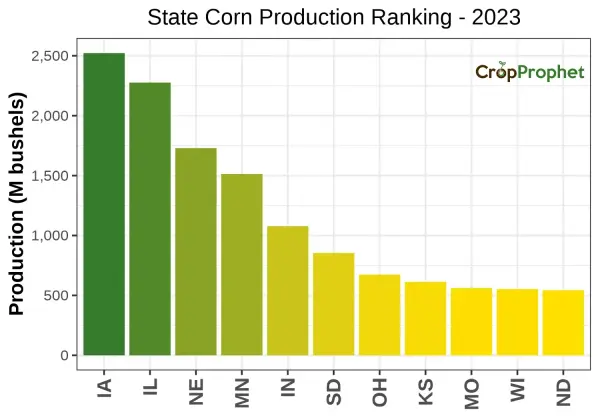
Corn Production by State: Top 11 of 2023
The top 11 corn-producing states (and their total production) of 2023 were:
| Production Rankings: 2023 | ||
| Rank | State | Production (M bu) |
|---|---|---|
| 1 | IA | 2522.6 |
| 2 | IL | 2276.3 |
| 3 | NE | 1729.0 |
| 4 | MN | 1513.3 |
| 5 | IN | 1077.9 |
| 6 | SD | 854.2 |
| 7 | OH | 673.2 |
| 8 | KS | 612.9 |
| 9 | MO | 561.5 |
| 10 | WI | 552.6 |
| 11 | ND | 543.4 |
State Corn Production – 2023
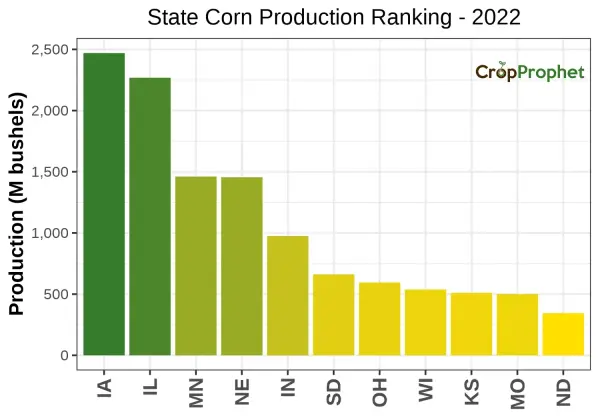
Corn Production by State: Top 11 of 2022
The top 11 corn-producing states (and their total production) of 2022 were:
| Production Rankings: 2022 | ||
| Rank | State | Production (M bu) |
|---|---|---|
| 1 | IA | 2470.0 |
| 2 | IL | 2268.4 |
| 3 | MN | 1460.6 |
| 4 | NE | 1455.3 |
| 5 | IN | 974.7 |
| 6 | SD | 661.3 |
| 7 | OH | 594.7 |
| 8 | WI | 538.2 |
| 9 | KS | 510.6 |
| 10 | MO | 500.7 |
| 11 | ND | 344.5 |
State Corn Production – 2022
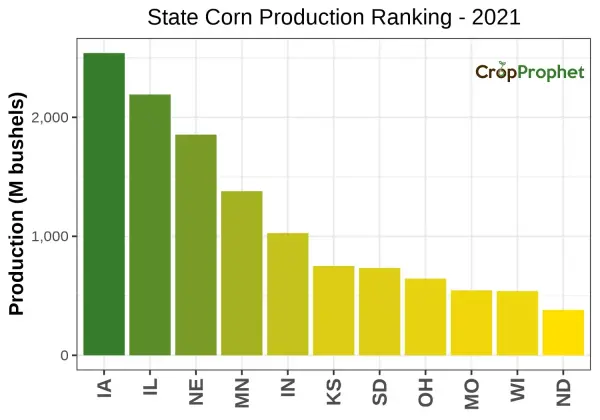
Corn Production by State: Top 11 of 2021
The top 11 corn-producing states (and their total production) of 2021 were:
| Production Rankings: 2021 | ||
| Rank | State | Production (M bu) |
|---|---|---|
| 1 | IA | 2539.8 |
| 2 | IL | 2191.7 |
| 3 | NE | 1854.6 |
| 4 | MN | 1378.8 |
| 5 | IN | 1027.7 |
| 6 | KS | 750.6 |
| 7 | SD | 734.3 |
| 8 | OH | 644.6 |
| 9 | MO | 545.4 |
| 10 | WI | 540.0 |
| 11 | ND | 381.1 |
State Corn Production – 2021
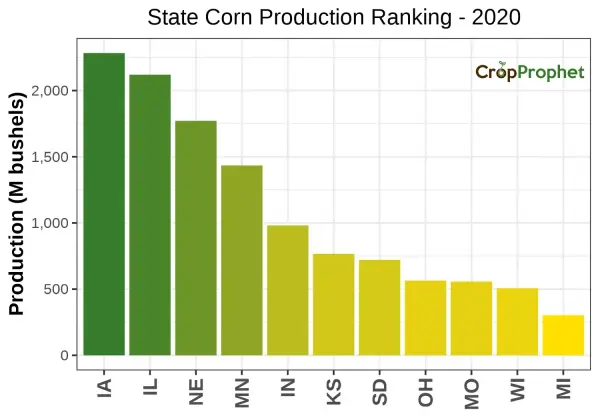
Corn Production by State: Top 11 of 2020
The top 11 corn-producing states (and their total production) of 2020 were:
| Production Rankings: 2020 | ||
| Rank | State | Production (M bu) |
|---|---|---|
| 1 | IA | 2283.3 |
| 2 | IL | 2120.1 |
| 3 | NE | 1771.2 |
| 4 | MN | 1434.4 |
| 5 | IN | 981.8 |
| 6 | KS | 766.5 |
| 7 | SD | 720.9 |
| 8 | OH | 564.3 |
| 9 | MO | 557.6 |
| 10 | WI | 506.9 |
| 11 | MI | 302.9 |
State Corn Production – 2020
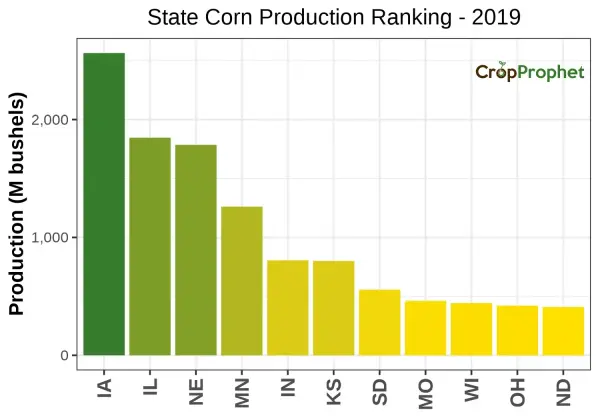
Corn Production by State: Top 11 of 2019
The top 11 corn-producing states (and their total production) of 2019 were:
| Production Rankings: 2019 | ||
| Rank | State | Production (M bu) |
|---|---|---|
| 1 | IA | 2564.1 |
| 2 | IL | 1846.2 |
| 3 | NE | 1785.4 |
| 4 | MN | 1261.5 |
| 5 | IN | 806.1 |
| 6 | KS | 800.7 |
| 7 | SD | 557.3 |
| 8 | MO | 461.9 |
| 9 | WI | 443.2 |
| 10 | OH | 421.5 |
| 11 | ND | 410.0 |
State Corn Production – 2019
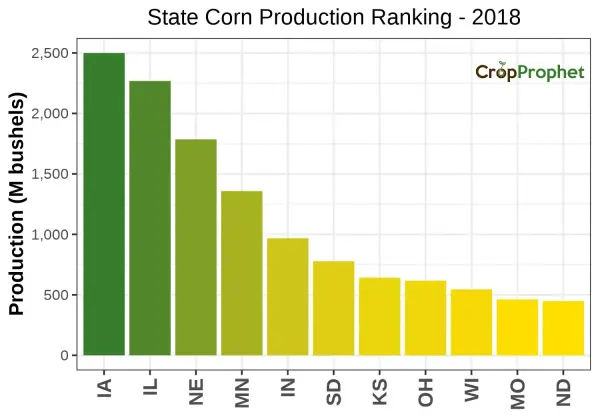
Corn Production by State: Top 11 of 2018
The top 11 corn-producing states (and their total production) of 2018 were:
| Production Rankings: 2018 | ||
| Rank | State | Production (M bu) |
|---|---|---|
| 1 | IA | 2499.0 |
| 2 | IL | 2268.0 |
| 3 | NE | 1785.6 |
| 4 | MN | 1357.7 |
| 5 | IN | 967.7 |
| 6 | SD | 777.6 |
| 7 | KS | 642.4 |
| 8 | OH | 617.1 |
| 9 | WI | 545.2 |
| 10 | MO | 462.0 |
| 11 | ND | 448.3 |
State Corn Production – 2018
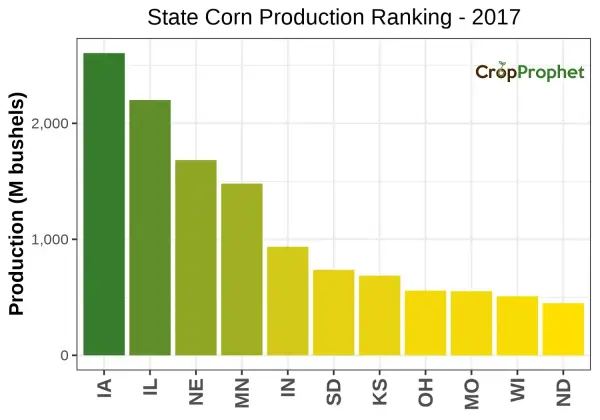
Corn Production by State: Top 11 of 2017
The top 11 corn-producing states (and their total production) in 2017 was:
| Production Rankings: 2017 | ||
| Rank | State | Production (M bu) |
|---|---|---|
| 1 | IA | 2605.8 |
| 2 | IL | 2200.9 |
| 3 | NE | 1683.3 |
| 4 | MN | 1480.2 |
| 5 | IN | 936.0 |
| 6 | SD | 736.6 |
| 7 | KS | 686.4 |
| 8 | OH | 557.5 |
| 9 | MO | 552.5 |
| 10 | WI | 509.8 |
| 11 | ND | 449.0 |
State Corn Production – 2017
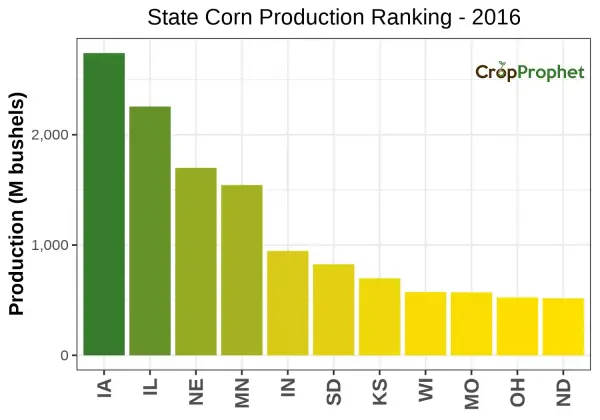
Corn Production by State: Top 11 of 2016
The top 11 corn-producing states (and their total production) of 2016 were:
| Production Rankings: 2016 | ||
| Rank | State | Production (M bu) |
|---|---|---|
| 1 | IA | 2740.5 |
| 2 | IL | 2255.7 |
| 3 | NE | 1699.9 |
| 4 | MN | 1544.0 |
| 5 | IN | 946.3 |
| 6 | SD | 825.9 |
| 7 | KS | 698.6 |
| 8 | WI | 573.2 |
| 9 | MO | 570.5 |
| 10 | OH | 524.7 |
| 11 | ND | 516.7 |
State Corn Production – 2016
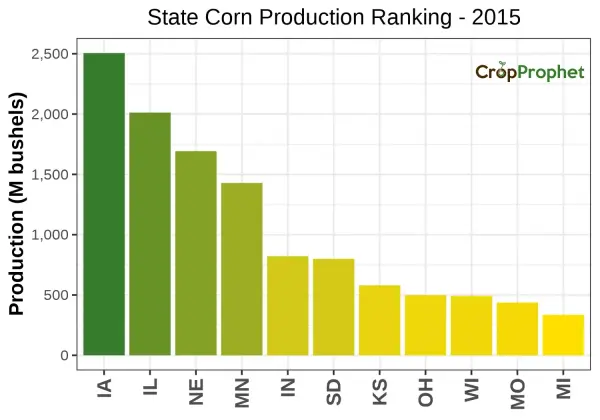
Corn Production by State: Top 11 of 2015
The top 11 corn-producing states (and their total production) of 2015 was:
| Production Rankings: 2015 | ||
| Rank | State | Production (M bu) |
|---|---|---|
| 1 | IA | 2505.6 |
| 2 | IL | 2012.5 |
| 3 | NE | 1692.8 |
| 4 | MN | 1428.8 |
| 5 | IN | 822.0 |
| 6 | SD | 799.8 |
| 7 | KS | 580.2 |
| 8 | OH | 498.8 |
| 9 | WI | 492.0 |
| 10 | MO | 437.4 |
| 11 | MI | 335.3 |
State Corn Production – 2015
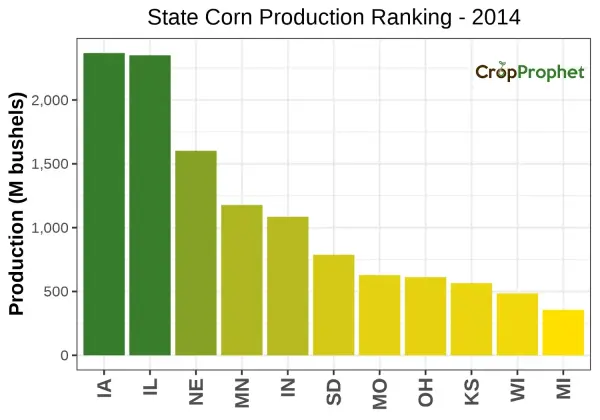
Corn Production by State: Top 11 of 2014
The top 11 corn-producing states (and their total production) of 2014 was:
| Production Rankings: 2014 | ||
| Rank | State | Production (M bu) |
|---|---|---|
| 1 | IA | 2367.4 |
| 2 | IL | 2350.0 |
| 3 | NE | 1602.0 |
| 4 | MN | 1177.8 |
| 5 | IN | 1084.8 |
| 6 | SD | 787.4 |
| 7 | MO | 628.7 |
| 8 | OH | 612.5 |
| 9 | KS | 566.2 |
| 10 | WI | 485.2 |
| 11 | MI | 355.8 |
State Corn Production – 2014
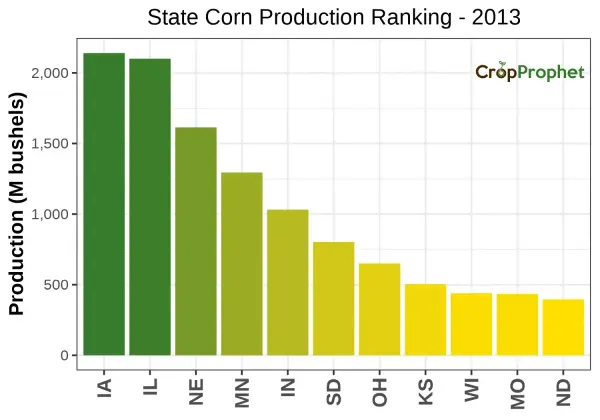
Corn Production by State: Top 11 of 2013
The top 11 corn-producing states (and their total production) of 2013 was:
| Production Rankings: 2013 | ||
| Rank | State | Production (M bu) |
|---|---|---|
| 1 | IA | 2140.2 |
| 2 | IL | 2100.4 |
| 3 | NE | 1614.0 |
| 4 | MN | 1294.3 |
| 5 | IN | 1031.9 |
| 6 | SD | 802.8 |
| 7 | OH | 650.8 |
| 8 | KS | 504.0 |
| 9 | WI | 439.4 |
| 10 | MO | 435.2 |
| 11 | ND | 396.0 |
State Corn Production – 2013
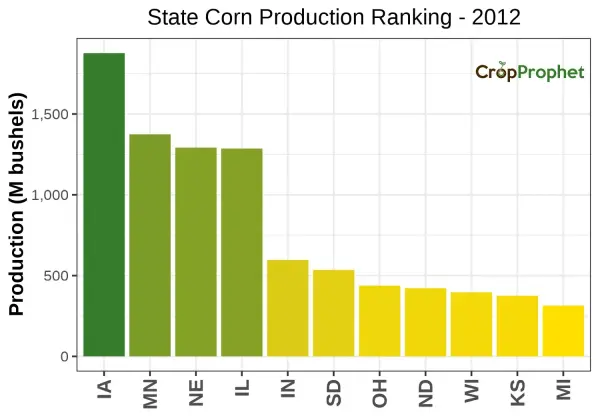
Corn Production by State: Top 11 of 2012
The top 11 corn-producing states (and their total production) of 2012 was:
| Production Rankings: 2012 | ||
| Rank | State | Production (M bu) |
|---|---|---|
| 1 | IA | 1876.9 |
| 2 | MN | 1374.4 |
| 3 | NE | 1292.2 |
| 4 | IL | 1286.2 |
| 5 | IN | 597.0 |
| 6 | SD | 535.3 |
| 7 | OH | 438.0 |
| 8 | ND | 422.1 |
| 9 | WI | 396.0 |
| 10 | KS | 375.2 |
| 11 | MI | 314.2 |
State Corn Production – 2012
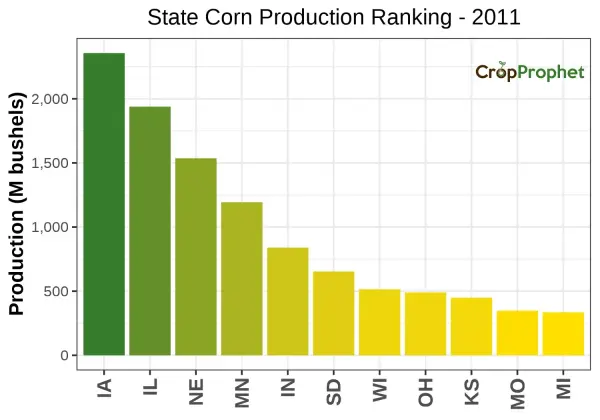
Corn Production by State: Top 11 of 2011
The top 11 corn-producing states (and their total production) of 2011 was:
| Production Rankings: 2011 | ||
| Rank | State | Production (M bu) |
|---|---|---|
| 1 | IA | 2356.4 |
| 2 | IL | 1939.0 |
| 3 | NE | 1536.0 |
| 4 | MN | 1193.5 |
| 5 | IN | 839.5 |
| 6 | SD | 653.4 |
| 7 | WI | 514.6 |
| 8 | OH | 489.6 |
| 9 | KS | 449.4 |
| 10 | MO | 347.7 |
| 11 | MI | 335.1 |
State Corn Production – 2011
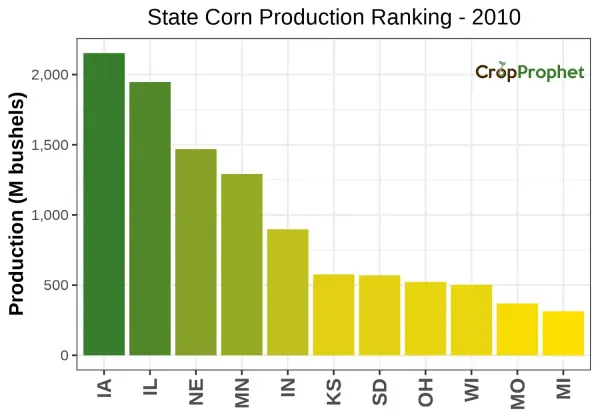
Corn Production by State: Top 11 of 2010
The top 11 corn-producing states (and their total production) of 2010 was:
| Production Rankings: 2010 | ||
| Rank | State | Production (M bu) |
|---|---|---|
| 1 | IA | 2153.2 |
| 2 | IL | 1946.8 |
| 3 | NE | 1469.1 |
| 4 | MN | 1292.1 |
| 5 | IN | 898.0 |
| 6 | KS | 576.6 |
| 7 | SD | 569.7 |
| 8 | OH | 523.2 |
| 9 | WI | 502.2 |
| 10 | MO | 369.0 |
| 11 | MI | 312.9 |
State Corn Production – 2010
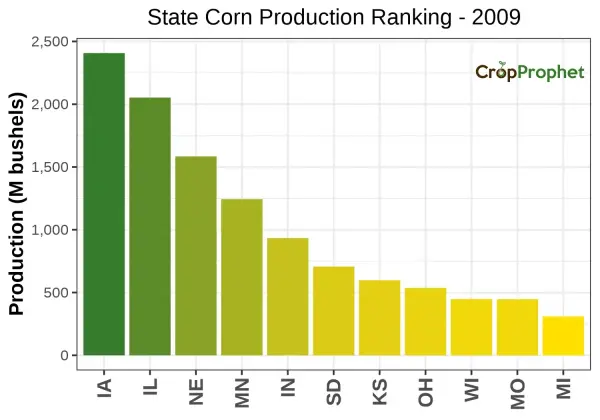
Corn Production by State: Top 11 of 2009
The top 11 corn-producing states (and their total production) of 2009 was:
| Production Rankings: 2009 | ||
| Rank | State | Production (M bu) |
|---|---|---|
| 1 | IA | 2407.3 |
| 2 | IL | 2053.2 |
| 3 | NE | 1584.2 |
| 4 | MN | 1244.1 |
| 5 | IN | 933.7 |
| 6 | SD | 706.7 |
| 7 | KS | 598.3 |
| 8 | OH | 536.9 |
| 9 | WI | 448.3 |
| 10 | MO | 446.8 |
| 11 | MI | 309.3 |
State Corn Production – 2009
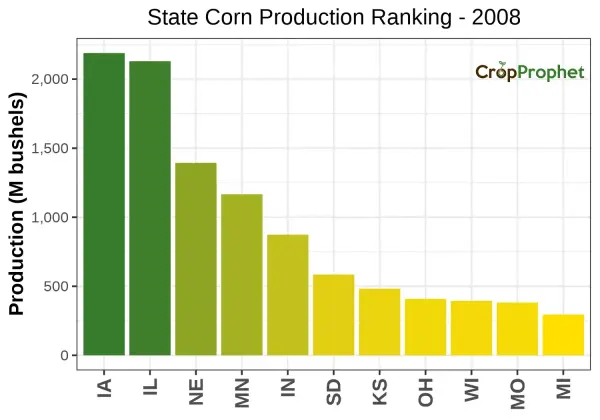
Corn Production by State: Top 11 of 2008
The top 11 corn-producing states (and their total production) of 2008 was:
| Production Rankings: 2008 | ||
| Rank | State | Production (M bu) |
|---|---|---|
| 1 | IA | 2188.8 |
| 2 | IL | 2130.1 |
| 3 | NE | 1393.7 |
| 4 | MN | 1166.4 |
| 5 | IN | 873.6 |
| 6 | SD | 585.2 |
| 7 | KS | 482.8 |
| 8 | OH | 408.7 |
| 9 | WI | 394.6 |
| 10 | MO | 381.6 |
| 11 | MI | 295.3 |
State Corn Production – 2008
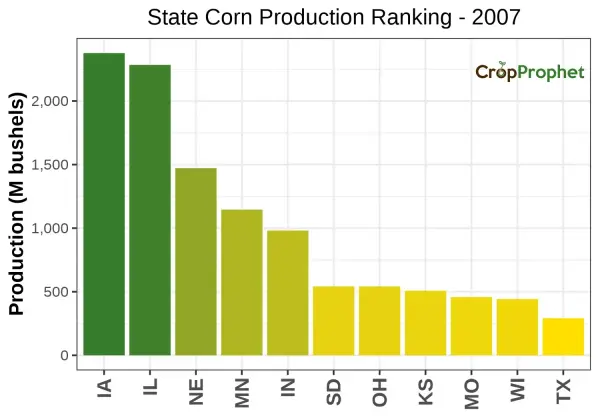
Corn Production by State: Top 11 of 2007
The top 11 corn-producing states (and their total production) of 2007 was:
| Production Rankings: 2007 | ||
| Rank | State | Production (M bu) |
|---|---|---|
| 1 | IA | 2376.9 |
| 2 | IL | 2283.8 |
| 3 | NE | 1472.0 |
| 4 | MN | 1146.1 |
| 5 | IN | 981.0 |
| 6 | SD | 542.1 |
| 7 | OH | 541.5 |
| 8 | KS | 507.8 |
| 9 | MO | 457.8 |
| 10 | WI | 442.8 |
| 11 | TX | 291.6 |
State Corn Production – 2007
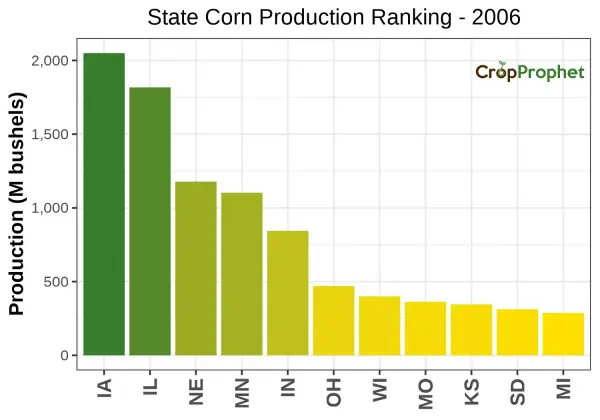
Corn Production by State: Top 11 of 2006
The top 11 corn-producing states (and their total production) of 2006 was:
| Production Rankings: 2006 | ||
| Rank | State | Production (M bu) |
|---|---|---|
| 1 | IA | 2050.1 |
| 2 | IL | 1817.4 |
| 3 | NE | 1178.0 |
| 4 | MN | 1102.8 |
| 5 | IN | 844.7 |
| 6 | OH | 470.6 |
| 7 | WI | 400.4 |
| 8 | MO | 362.9 |
| 9 | KS | 345.0 |
| 10 | SD | 312.3 |
| 11 | MI | 286.6 |
State Corn Production – 2006
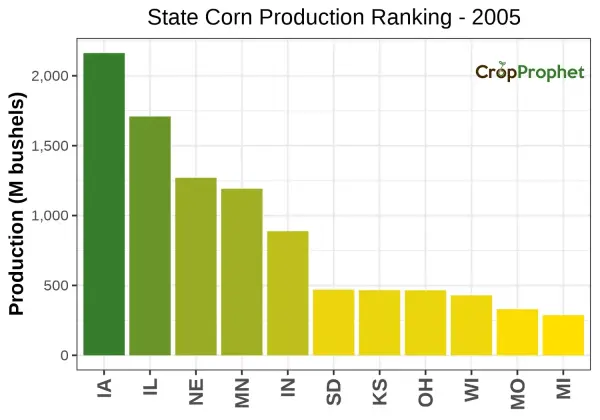
Corn Production by State: Top 11 of 2005
The top 11 corn-producing states (and their total production) of 2005 was:
| Production Rankings: 2005 | ||
| Rank | State | Production (M bu) |
|---|---|---|
| 1 | IA | 2162.5 |
| 2 | IL | 1708.8 |
| 3 | NE | 1270.5 |
| 4 | MN | 1191.9 |
| 5 | IN | 888.6 |
| 6 | SD | 470.0 |
| 7 | KS | 465.8 |
| 8 | OH | 464.8 |
| 9 | WI | 429.2 |
| 10 | MO | 329.7 |
| 11 | MI | 287.4 |
State Corn Production – 2005
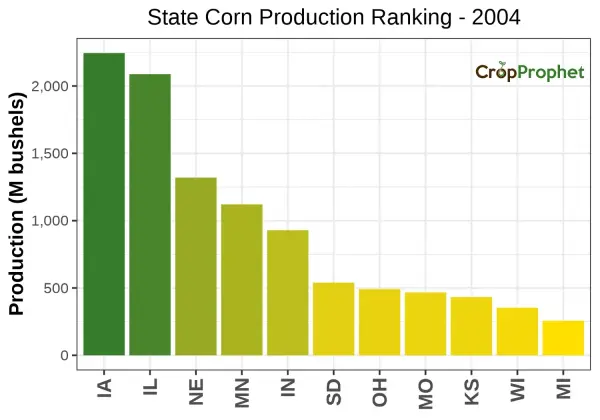
Corn Production by State: Top 11 of 2004
The top 11 corn-producing states (and their total production) of 2004 was:
| Production Rankings: 2004 | ||
| Rank | State | Production (M bu) |
|---|---|---|
| 1 | IA | 2244.4 |
| 2 | IL | 2088.0 |
| 3 | NE | 1319.7 |
| 4 | MN | 1121.0 |
| 5 | IN | 929.0 |
| 6 | SD | 539.5 |
| 7 | OH | 491.4 |
| 8 | MO | 466.6 |
| 9 | KS | 432.0 |
| 10 | WI | 353.6 |
| 11 | MI | 257.3 |
State Corn Production – 2004
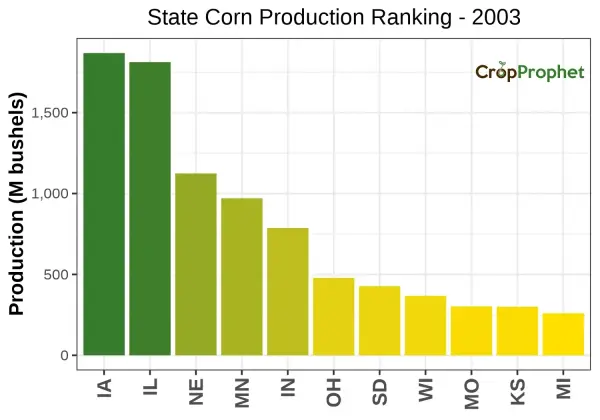
Corn Production by State: Top 11 of 2003
The top 11 corn-producing states (and their total production) of 2003 was:
| Production Rankings: 2003 | ||
| Rank | State | Production (M bu) |
|---|---|---|
| 1 | IA | 1868.3 |
| 2 | IL | 1812.2 |
| 3 | NE | 1124.2 |
| 4 | MN | 970.9 |
| 5 | IN | 786.9 |
| 6 | OH | 478.9 |
| 7 | SD | 427.4 |
| 8 | WI | 367.6 |
| 9 | MO | 302.4 |
| 10 | KS | 300.0 |
| 11 | MI | 259.8 |
State Corn Production – 2003
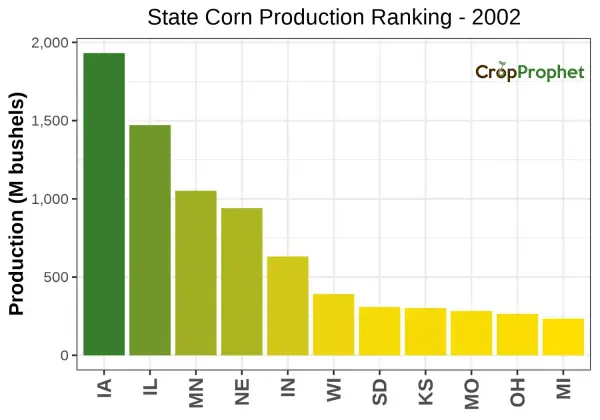
Corn Production by State: Top 11 of 2002
The top 11 corn-producing states (and their total production) of 2002 was:
| Production Rankings: 2002 | ||
| Rank | State | Production (M bu) |
|---|---|---|
| 1 | IA | 1931.6 |
| 2 | IL | 1471.5 |
| 3 | MN | 1051.9 |
| 4 | NE | 940.8 |
| 5 | IN | 631.6 |
| 6 | WI | 391.5 |
| 7 | SD | 308.8 |
| 8 | KS | 301.6 |
| 9 | MO | 283.5 |
| 10 | OH | 264.3 |
| 11 | MI | 234.0 |
State Corn Production – 2002
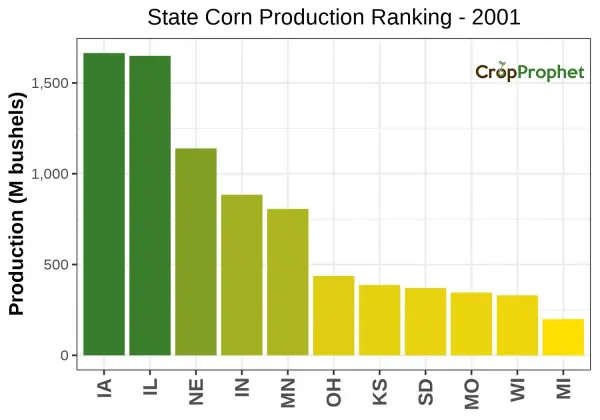
Corn Production by State: Top 11 of 2001
The top 11 corn-producing states (and their total production) of 2001 was:
| Production Rankings: 2001 | ||
| Rank | State | Production (M bu) |
|---|---|---|
| 1 | IA | 1664.4 |
| 2 | IL | 1649.2 |
| 3 | NE | 1139.2 |
| 4 | IN | 884.5 |
| 5 | MN | 806.0 |
| 6 | OH | 437.5 |
| 7 | KS | 387.4 |
| 8 | SD | 370.6 |
| 9 | MO | 345.8 |
| 10 | WI | 330.2 |
| 11 | MI | 199.5 |
State Corn Production – 2001
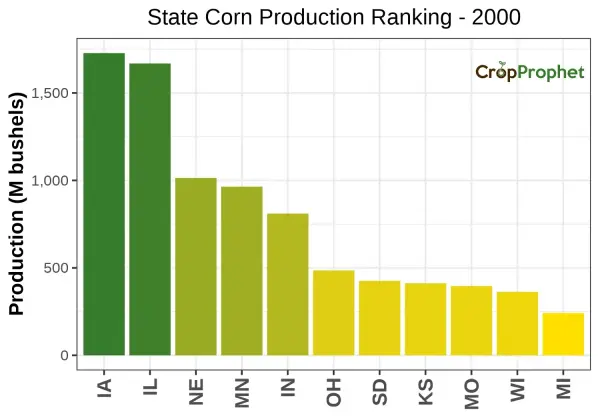
Corn Production by State: Top 11 of 2000
The top 11 corn-producing states (and their total production) of 2000 was:
| Production Rankings: 2000 | ||
| Rank | State | Production (M bu) |
|---|---|---|
| 1 | IA | 1728.0 |
| 2 | IL | 1668.6 |
| 3 | NE | 1014.3 |
| 4 | MN | 964.2 |
| 5 | IN | 810.3 |
| 6 | OH | 485.1 |
| 7 | SD | 425.6 |
| 8 | KS | 412.1 |
| 9 | MO | 396.1 |
| 10 | WI | 363.0 |
| 11 | MI | 241.8 |
State Corn Production – 2000
CropProphet provides users with quantified information relating to the impact of weather on grain yields and production. Request a trial today.