12z GFS Forecast Model Run: Impact on Yield Forecasts
We get asked, “Can you convert the 12Z GFS Op lunch run into a yield forecast?”
The grain market no longer needs to guess the yield impact of this market-moving weather forecast. We do it for you.
CropProphet quantifies the impact of weather on U.S. crop yield and production, and we now directly calculate the corn and soybean yield impacts of the 12Z GFS forecast model. The yield forecast implied by the 12Z GFS model run is calculated once all 15 days of the forecast are downloaded to our servers. The email is sent immediately after we quantify the information in the CropProphet context. The data is also available digitally for download to aid systematic grain trading strategies.
What times do weather models run?
The weather modeling centers around the world generally start running their global weather forecast models daily based on global observations from 00 UTC (i.e., 00 Zulu or 00Z), 06Z, 12Z, and 18Z. At 00 UTC and 12 UTC, weather balloons are launched at many locations all around the world. As these balloons rise through the atmosphere, they gather temperature, dew point, wind speed, and direction data. This data improves the information used to initialize (i.e., start) the weather forecast models.
The first run of each calendar day occurs at 00Z, which is 8 PM ET/7 PM CT in the United States during the U.S. crop season. The model data becomes available several hours later and this information is used to update the CropProphet weather model yield and production forecasts daily.

12z GFS Forecast Model: Requests for Yield
Several customers commented, “I really like that you calculate the yield forecast implied by the weather forecast models. It would also be valuable if did the same for the 12Z GFS model run.” The 12Z GFS, also known as the 12Z Operational GFS run, is a single high-resolution realization of the GFS model that is run by NOAA before the lower-resolution 12Z ensemble run is executed. The data from the 12Z Operational GFS is released by NOAA around midday, and hence it’s sometimes called “the lunch run”.
The timing of the availability of this new weather forecast model data often moves corn and soybean futures as the market incorporates this new information. However, the market tends to react to very basic information about the forecast, with most market participants simply making a guess as to the implication and impact on likely yields.
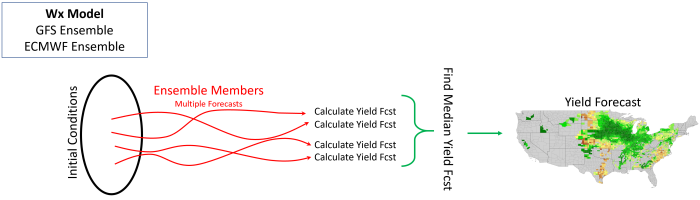
The new CropProphet feature uses the advanced CropProphet county-level regression models to convert the 12Z GFS forecast model data into yield and production forecasts in real-time as the data is released to the NOAA servers. The normal process for ensemble data is shown below. CropProphet calculates the crop forecast based on the weather forecast of each ensemble member, and then the final CropProphet forecast is obtained from the median of the distribution (i.e. the most likely outcome). Note that the ensemble mean forecast is often not a realistic outcome (for example, its precipitation field is highly smoothed), and so we do not calculate the crop forecast from the ensemble mean.
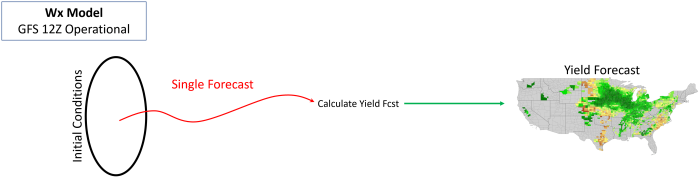
The same process is used to calculate the implied yield and production from the 12Z GFS Operational run. In this case, however, the forecast is based on only a single model realization, as shown below.
Example: 12Z Operational GFS to Grain Yield Forecast
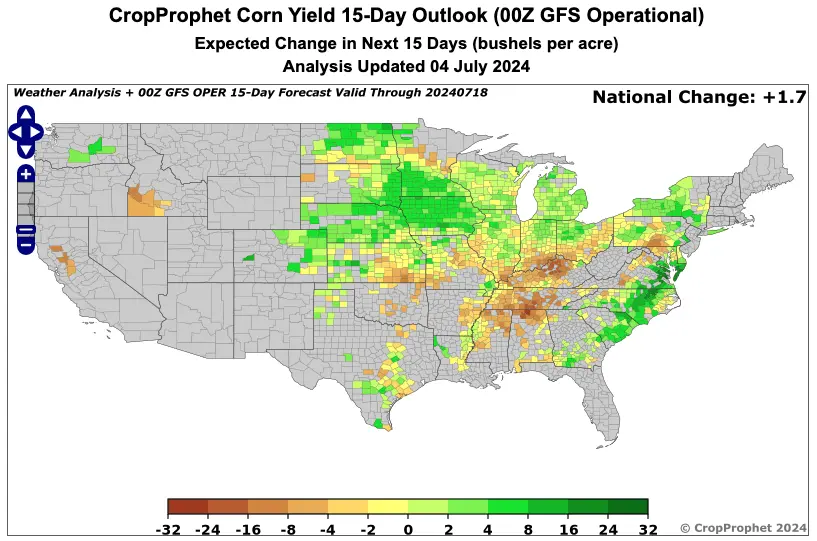
In summary, CropProphet now converts the 12Z GFS model forecast data into the impact on corn and soybean yield and production in real-time. An example full calculation from June 1, 2021 is shown below.
12Z GFS Operational: Daily Email Service
We have launched a daily updated 12Z GFS operational email service. We process the 15-day GFS Operational forecast data as soon as it’s available from NOAA and send it to your inbox immediately. You will benefit by allowing us to reduce the complexity of the weather model forecast into easy to interpret, market-moving information.
The daily email includes:
- `The expected change in the CropProphet corn yield forecast if the 12Z operational forecast is correct.
- The expected change in the CropProphet soybean yield forecast if the 12Z operational forecast is correct.
- The 14-day averaged temperature anomaly (i.e., relative to normal).
- The 14-day averaged precipitation percentage of normal.
- The change of the 12Z GFS operational forecast temperature from the 00Z GFS operational forecast 12 hours before.
- The change of the 12Z GFS operational forecast precipitation from the 00Z GFS operational forecast 12 hours before.
12Z GFS Forecast Verification
This blog post uses three statistics to understand the 12Z GFS forecast verification:
- Mean Absolute Error (MAE) – is the average absolute difference between the predicted and actual values.
- Root Mean Square Error (RMSE) – measures the square root of the average squared differences between predicted and actual values.
- Bias – the average of the errors over the time period chosen.
We verify US corn production weighted temperature and precipitation forecasts. Crop production weighting is a statistical method for assigning different weights to regions (such as counties or states) based on their contribution to overall crop production. A county that produces more corn than the next one will have a greater weight in the calculation. Apply a production-weighted rather than a simple average helps create more accurate and representative analyses, especially when combining weather data and yield predictions across different regions.
Figures 1-3 show the GFS 12Z year-to-date verified statistics for GFS 12z forecasts for precipitation, maximum and minimum temperatures. Figure 1, which presents the verified precipitation statistics, demonstrates that both MAE and RMSE increase as the lead time grows. This occurs because of small differences between the model’s initial conditions and the actual weather conditions when the model started grow over time. The growth of the differences is the forecast error. This is the so-called Butterfly Effect. In the model, it can expand into larger discrepancies over time. However, no distinct trend is observed for model bias when plotted against lead time.
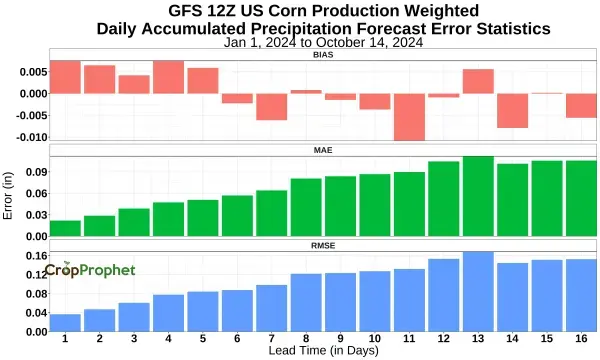
Figure 1. GFS 12Z US corn production weighted daily accumulated precipitation forecast error statistics.
In Figure 2, the maximum temperature shows a clear trend across all three verification statistics. The 12Z GFS model exhibits a consistent negative bias across all lead times, indicating that it underestimates maximum temperatures. Additionally, both MAE and RMSE increase as lead time progresses.
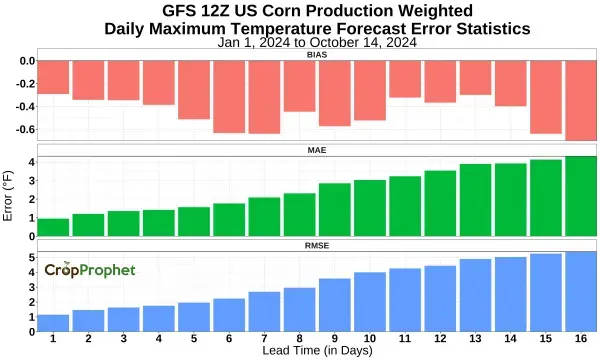
Figure 2. GFS 12Z US corn production weighted daily maximum temperature forecast error statistics.
Contrasting with the maximum temperature, the minimum temperature forecasts from the 12Z GFS (Figure 3) reveal a positive bias, meaning that the model overestimates minimum temperatures. A similar pattern of increasing MAE and RMSE with lead time is also observed across these forecasts.
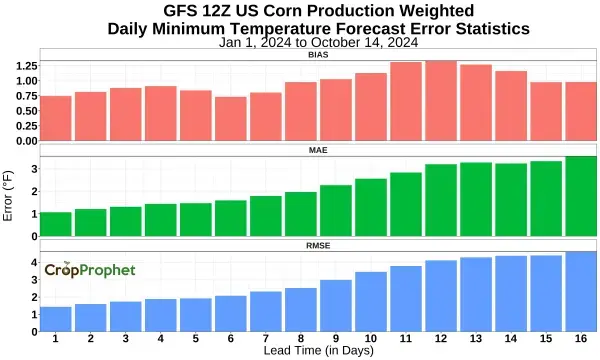
Figure 3. GFS 12Z US corn production weighted daily minimum temperature forecast error statistics.
Understanding model verification statistics helps grain traders to assess the significance of any particular forecast. The CropProphet Modeler solution provides access to real-time observations and weather forecasts to enable weather forecast model verification analysis for the ECMWF, GEFS, and GFS models.
You can request your trial now to gain your grain trading edge.