2023 US Corn Crop and Crop Season Weather Conditions
The USDA provided is final estimate of the 2023 US corn crop in January 2024. The USDA estimated a final US corn yieldof 177.3 bushels per acre, which surprised a wide swath of the grain trading market. CropProphet provides grain traders daily updated grain yield forecasts during the crop season. As a result, we review the weather conditions related to each year’s corn yield outcome. This post reviews the 2023 crop season weather conditions and examines whether the market surprise was warranted.
The 2023 Corn Yield Forecast
The progression of CropProphet’s 2023 corn yield forecast is shown below.
2023 Weather Review
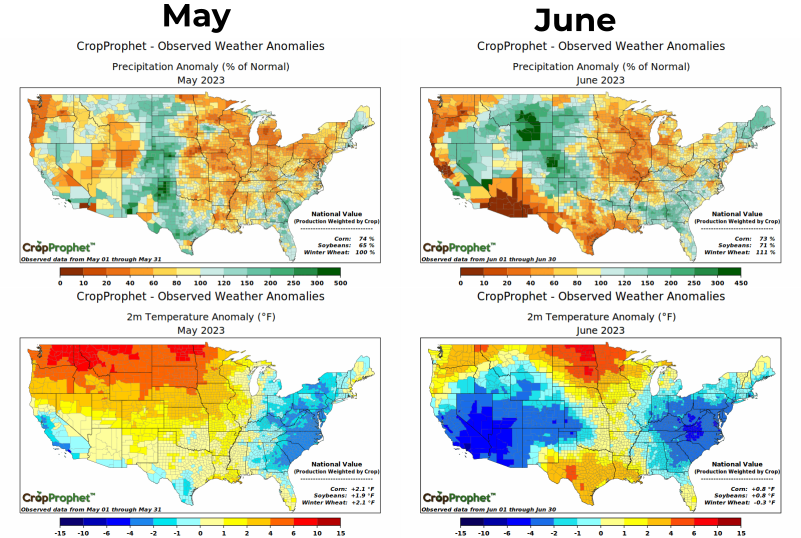
The 2023 US growing season featured dry early season conditions during May and June in the key corn/soybean growing regions of the central United States. Temperatures were also well above normal in the Upper Midwest, adding to early moisture stress, although the eastern Corn Belt was cooler than normal, helping to mitigate the impact of the dryness there (Figure 1).
May and June 2023 Crop Weather

To summarize the early season rainfall anomaly, the rank of the combined May-June precipitation relative to each year since 1895 is provided in Figure 2. A few counties in Minnesota and Wisconsin experienced the driest conditions since 1895 (i.e., rank = 1), and “top 10” dryness was observed in much of northern Illinois and several other areas. Undoubtedly, May and June 2023 were historically dry across important grain-growing regions of the United States.
July and August 2023 Crop Weather
July 2023 brought a major change to the central US weather pattern, with below-normal temperatures developing in the Upper Midwest, along with substantial rainfall in many areas (Figure 3). US corn and soybean production weighted precipitation was 109% of normal in July, although much of Iowa and Minnesota remained relatively dry. Likewise, August ended with above-normal production-weighted precipitation totals, although again not evenly distributed.
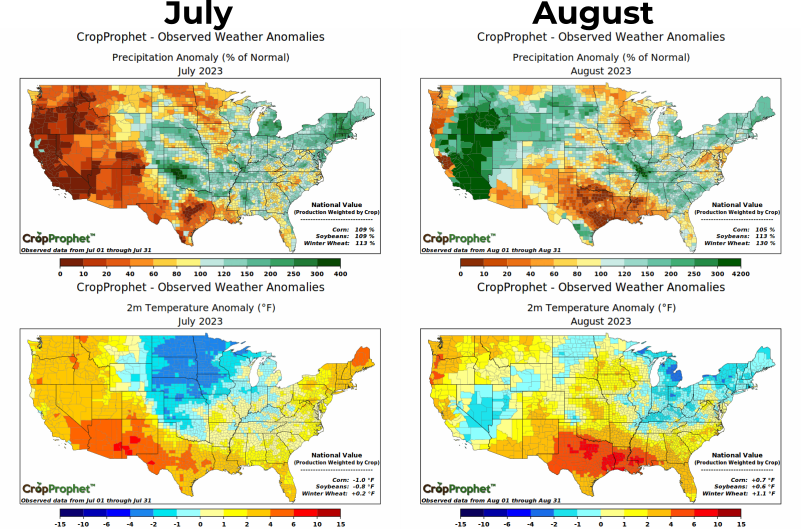
Regarding crop impacts, the dry May and June conditions obviously set the stage for significant corn and soybean yield declines in July and August. Still, the dramatic change in July “saved” the crops nationally. In particular, the cool and generally moist pattern in July was critical for corn, as July is the key window for corn yield outcomes.
A Surprising Corn Yield Recovery?
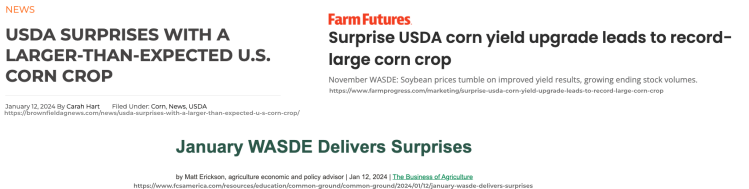
The late Fall of 2023 and the January 2024 USDA release of the final 2023 corn yield estimate featured many news headlines, such as those above, including the word “surprise” and discussion of corn futures price declines. Evidently, the USDA yield updates and the final yield estimate surprised market participants because of much lower market expectations of corn yield. Was this sentiment of surprise justified? It is interesting to examine past years with a similar transition from dry to wet conditions to answer this question.
We sourced NOAA’s county-level climate database to evaluate the US corn yield outcome in similar past years. To assess historical similarity, we calculate the change in US corn production weighted precipitation between May/June and July/August (using modern corn production statistics). Figure 4 presents the results, with the top row showing the annual rainfall differences between US corn production-weighted May/June and July/August precipitation. Compared to the 1950-2023 history, the 2023 difference was the 10th greatest (rank=10).
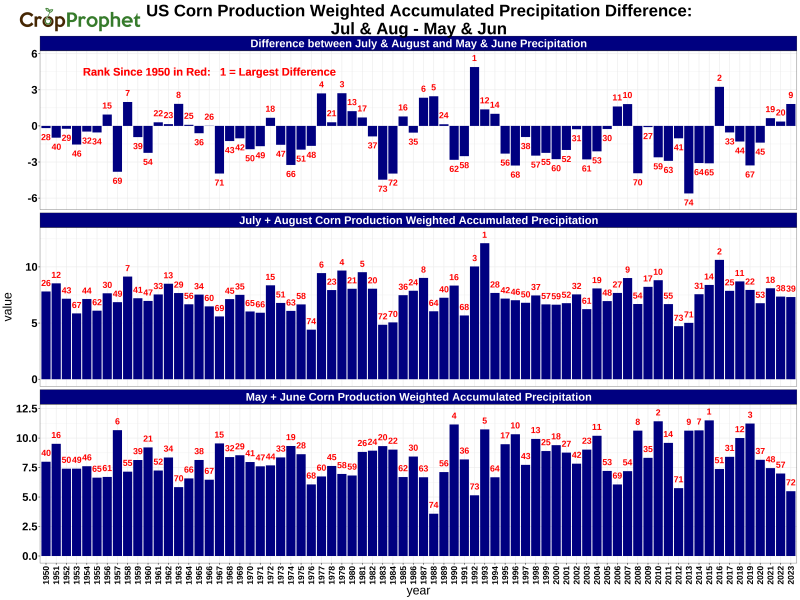
The May/June and July/August precipitation differences can be sorted by rank to gain a different perspective of 2023 relative to other years, as shown in Figure 5.
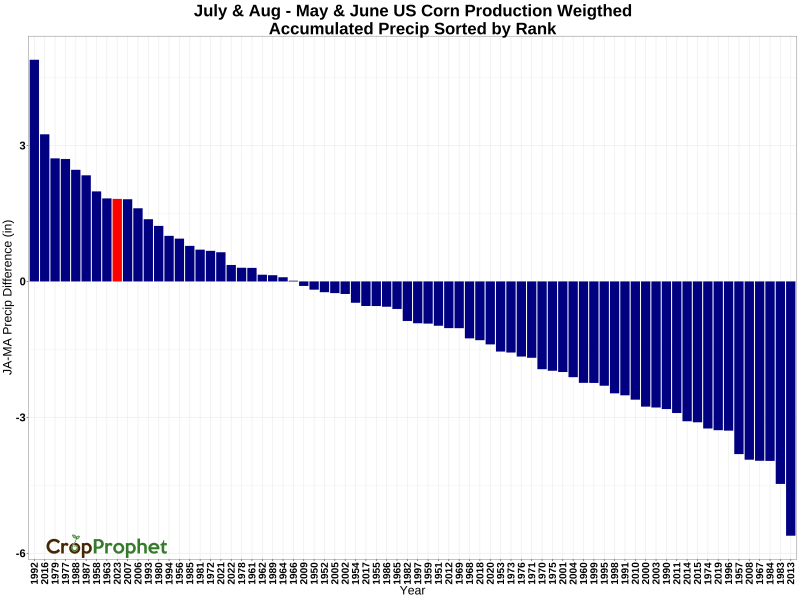
Could the 2023 final corn yield have been anticipated based on historical outcomes in similar years? Table 1 shows the yield outcomes in eight past years that saw a significant increase in rainfall from May/June to July/August.
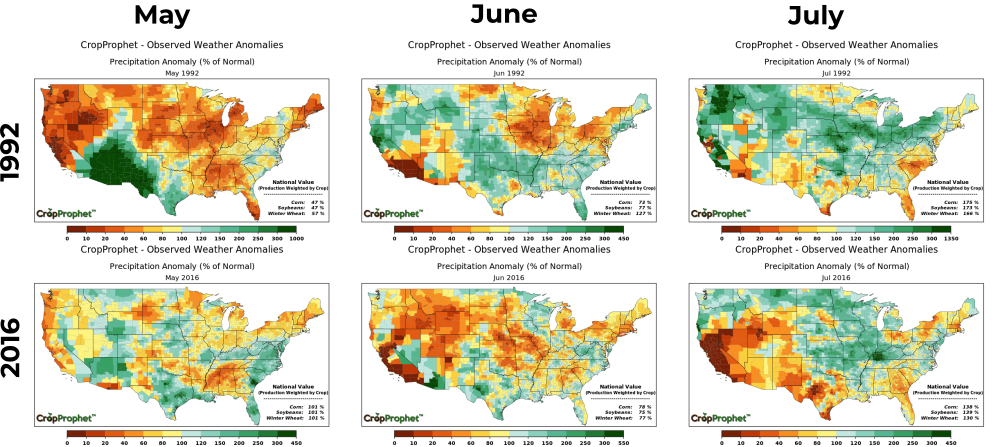
Interestingly, six of the eight years produced an above-trend yield, whereas severe yield shortfalls occurred in 1988 and 1993. The two poor corn yield years had very detrimental conditions in July: drought was severe in 1988, with August relief arriving too late, and in 1993 extreme flooding was very damaging for corn. The two highest-ranked years (1992 and 2016) showed substantially above trend yields, even though conditions were dry in many portions of the Corn Belt leading into summer (Figure 6).
Precipitation Timing and Corn Yield Outcomes
While the sample size of similar years is small, this analysis indicates that the corn market should not have been surprised by a recovery of US corn yield in response to the favorable change in the summer weather pattern. More often than not, a similar change to wetter conditions in July/August has produced near-trend or above-trend corn yield. Indeed, it is well known that a dry start to the growing season in the Corn Belt can precede high corn yields if sufficient rainfall arrives by mid-summer. Early-season dryness causes the crop’s roots to grow deeper in June, facilitating a more resilient crop during stressful summer conditions.