Crop Yield Forecasting: South America
CropProphet’s weather-based corn and soybean yield forecasts have become a critical tool for successful grain futures trading. In December 2025, CropProphet will release weather-based corn and soybean yield forecasts for Argentina with a limited yield forecast release for Brazil’s three southernmost provinces: Paraná, Santa Catarina, and Rio Grande do Sul.

Brazil Crops: Yield Prediction
Paraná, Santa Catarina, and Rio Grande do Sul together account for approximately 38% of Brazilian first season corn production and 27% of Brazilian soybean production. In other words, CropProphet now provides forecasts for a significant portion of the Brazilian first season corn and soybean crops.
However, we are not releasing Brazil countrywide forecasts for 2026, because creating Brazil yield forecasts with the level of skill CropProphet users have come to expect has not yet been achieved. This post provides information regarding the two primary reasons why this is the case.
Brazil Planting Practices
In a report available from the Proceedings of the National Academies of Science entitled “Near doubling of Brazil’s intensive row crop area since 2000,” the authors document significant changes in row crop planting practices in Brazil. The article begins with the statement, “Brazil has become a global leader in the production of commodity row crops such as soybean, sugarcane, cotton, and corn. Here, we report an increase in Brazilian cropland extent from 26.0 Mha in 2000 to 46.1 Mha in 2014. ”
This increase in cropland acreage has been caused by “growing demands in national and international markets for commodity crops” driving “increasing production through more intensive management practices, extensification through land conversion, or both.”
The bottom line is: Brazilian crop planting practices have changed substantially over the past 20 to 30 years.
The rapid change in Brazilian crop planting practices muddles the measurable impact of weather on crops. It creates serious difficulties for statistically-based prediction methods such as those used in CropProphet. Fundamentally, this is because CropProphet relies on having at least 1-2 decades of consistent crop practices in each target location so that robust relationships with seasonal weather impacts can be determined.
To illustrate the dramatic changes in Brazil, the history of Mato Grosso soybean harvested acres is shown below. Mato Grosso is now Brazil’s top soybean state, growing over one-quarter of the nation’s soybeans in recent years. Since 1986, Mato Grosso has increased soybean harvested acres by just under 300,000 hectares per year.
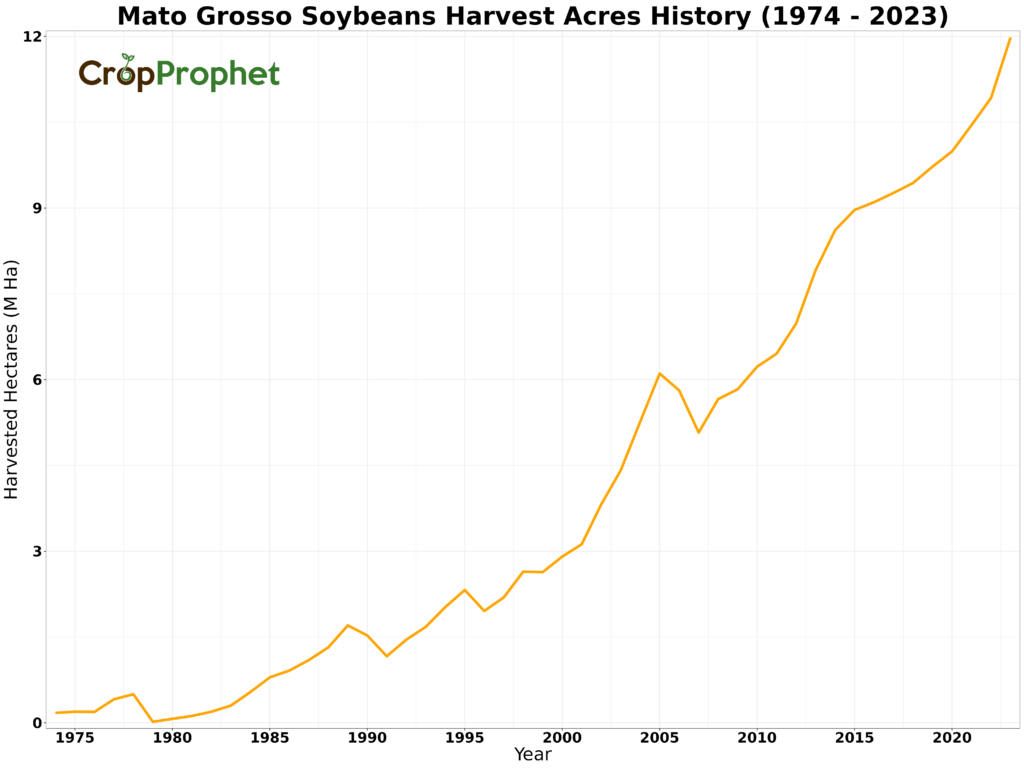
The implication of the rapid increase in planted/harvested acres in the Mato Grosso region is that changing agricultural practices make it difficult to quantify weather’s impact on crops. This is true in any region that has experienced rapid growth in agricultural acreage.
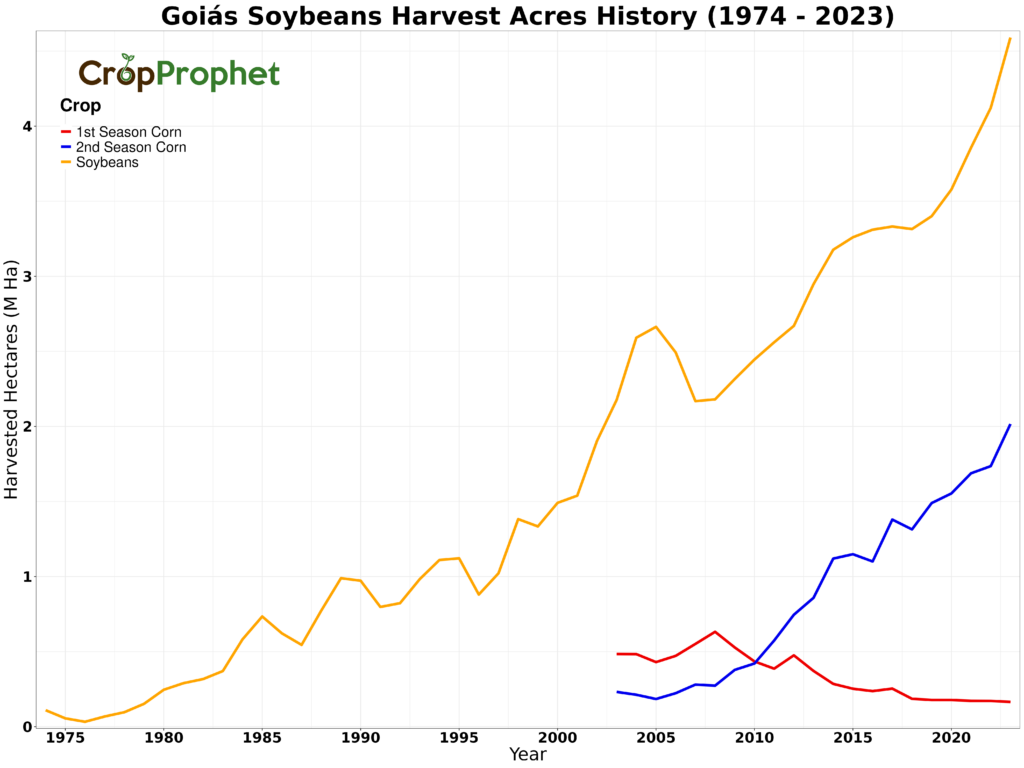
The emergence of a second corn planting season is another factor that complicates attempts to quantify and model the impact of weather on crops objectively. Below is a graphic depicting the Goiás state harvested acres history for soybeans and first and second season corn. Second season corn has become an important crop in the past decade, while first season corn acres have likely been replaced by soybean acres. With only a small number of recent years in which planting practices have been relatively stable, the sample size for statistical modeling is too limited for most statistical prediction methods.
Brazil Crop Yield Variability
Vast areas of Brazil’s farmland are found in tropical climate zones. The variability of weather and climate conditions in tropical regions is substantially lower than in mid-latitude locations such as Argentina’s Córdoba province or the US states comprising the Corn Belt. The growing season is not constrained by temperature, and rainfall variability is the main factor affecting crop seasons and potential stress that crops may experience. Brazil will also be impacted by the forecasted La Niña throughout early winter in 2025/2026.
In the US Corn Belt, the year-to-year variations in summertime weather during a relatively narrow growing season create large variability in corn and soybean yield and production, but crop yield variations in Brazil’s tropical cropland are reduced because of the smaller weather variance from year to year. This lack of substantial weather variations creates another difficulty for modeling the impact that weather has on crops, especially since other factors such as farming practices can play a relatively larger role in shaping the yield outcome in these regions.
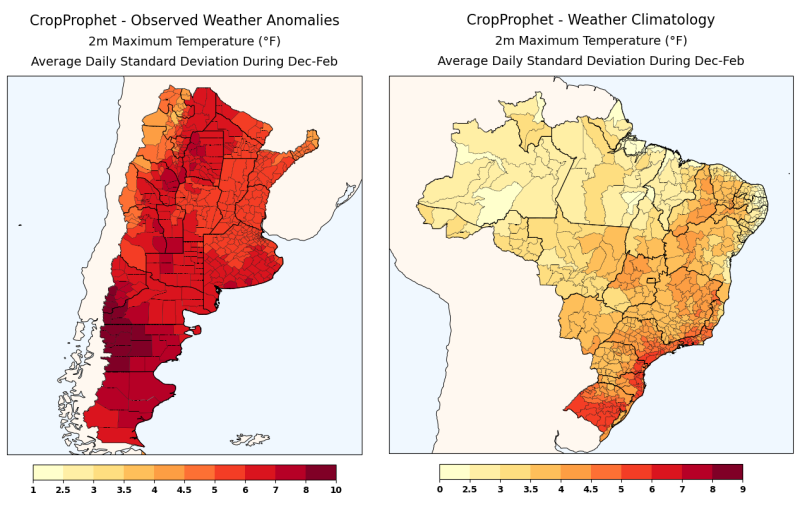
We demonstrate this point in the South American context using the standard deviation of daily temperatures during December, January, and February. The temperature variation in Mato Grosso ranges between 2.5 and 4°F. Temperatures during this time period in Argentina’s Córdoba province, however, vary by around 5-7°F from day to day. Argentina’s temperature variations are larger because of its mid-latitude location relative to Brazil’s mostly tropical latitude.
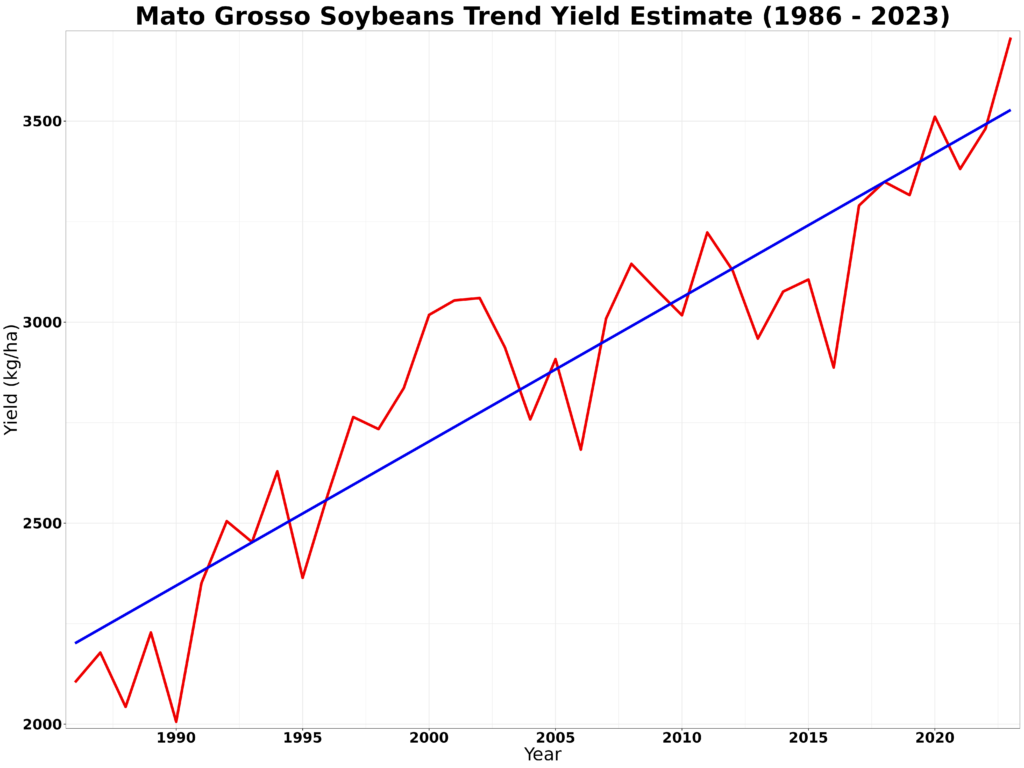
We’ll use IBGE crop data for Mato Grosso’s soybean yield history to further demonstrate this point. Mato Grosso soybean yields from 1986 to 2023 and a simple linear trend estimate are shown below.
Having calculated the estimated soybean trend yield, we calculate the annual deviation from soybean trends below. The yield deviation is presented as the percentage difference from the technology trend.
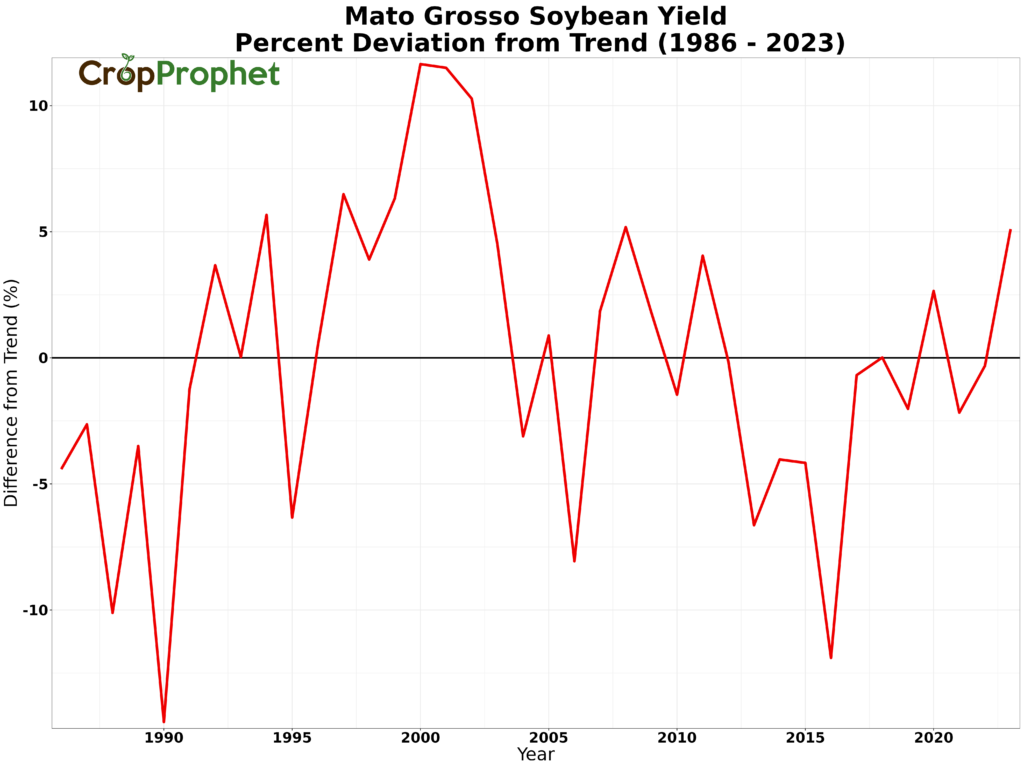
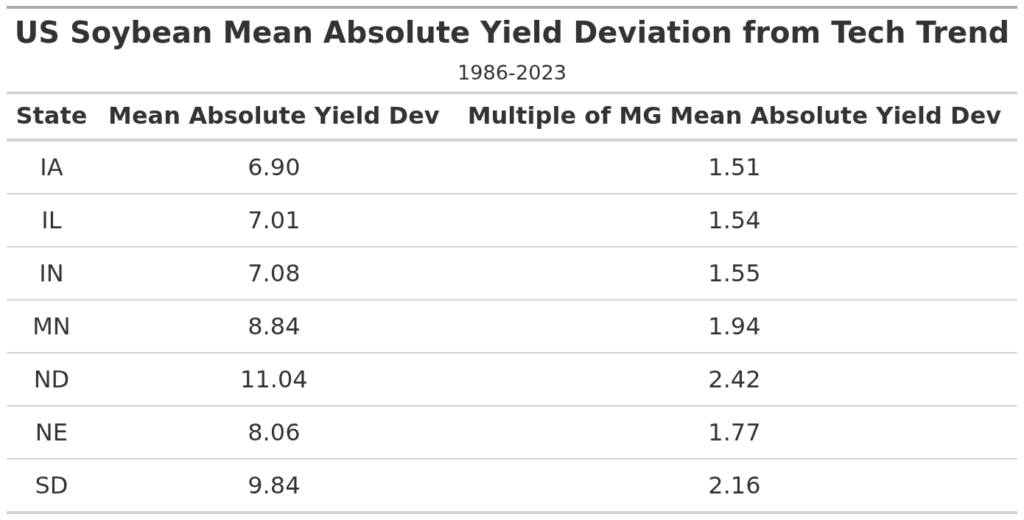
Mato Grosso’s soybean yield deviation varies between -15 and +12% since 1986, and the mean absolute yield deviation is 4.56%. The parabolic nature of the percent deviation from trend also suggests that the linear trend fit is not the best representation of the technology improvements and changing farming practices. The actual mean absolute yield deviation attributable to weather is considerably less. Nevertheless, we can compare this to the variability in key states in the US soybean belt: the US state soybean deviation from trend varies between 7.08% and 11.04%. In other words, US state soybean yields are between 1.51 and 2.42 times more variable than Mato Grosso soybean yields.
The higher variability of crop yields in mid-latitude regions such as the US and Argentina allows CropProphet to have more success in modeling the impact of weather on crops. We found useable crop yield forecast skill in Brazil only for the states Paraná, Santa Catarina, and Rio Grande do Sol. These three states are the southernmost Brazilian states where seasonal weather variability is similar to the Argentinian provinces just to the south. Crop yield variations are therefore larger, and extracting the weather-driven signal is possible.
Developing yield forecasts for tropical Brazil is an important goal for future CropProphet expansion. We are optimistic that revised statistical methods and additional ground-truth data sources will prove successful in due course.