Impact of La Niña on Brazil Crops
The post discusses the impact of La Niña, the Pacific Ocean phenomenon that has a global climate impact, on Brazil’s corn and soybean crop. The analysis compares and El Niño/Southern oscillation index to crop yield variations relative to the technology trend over the past few decades.
Table of Contents
La Niña and the 2025/2026 Forecast
Impacts of La Niña on Brazil Climate
Impact of La Niña on First Planting Corn
Impact of La Niña on Second Planting Corn
Brazil Crop Yield Forecasts: Modeling the Impact of La Niña
La Niña and the 2025/2026 Forecast
Our discussion of the impact of La Niña on Argentina’s crops includes a discussion of not only the Fall 2025 La Niña forecast but also background information regarding the La Niña/El Niño cycles.
We can also reference NOAA’s Climate Prediction Center for La Niña background information.
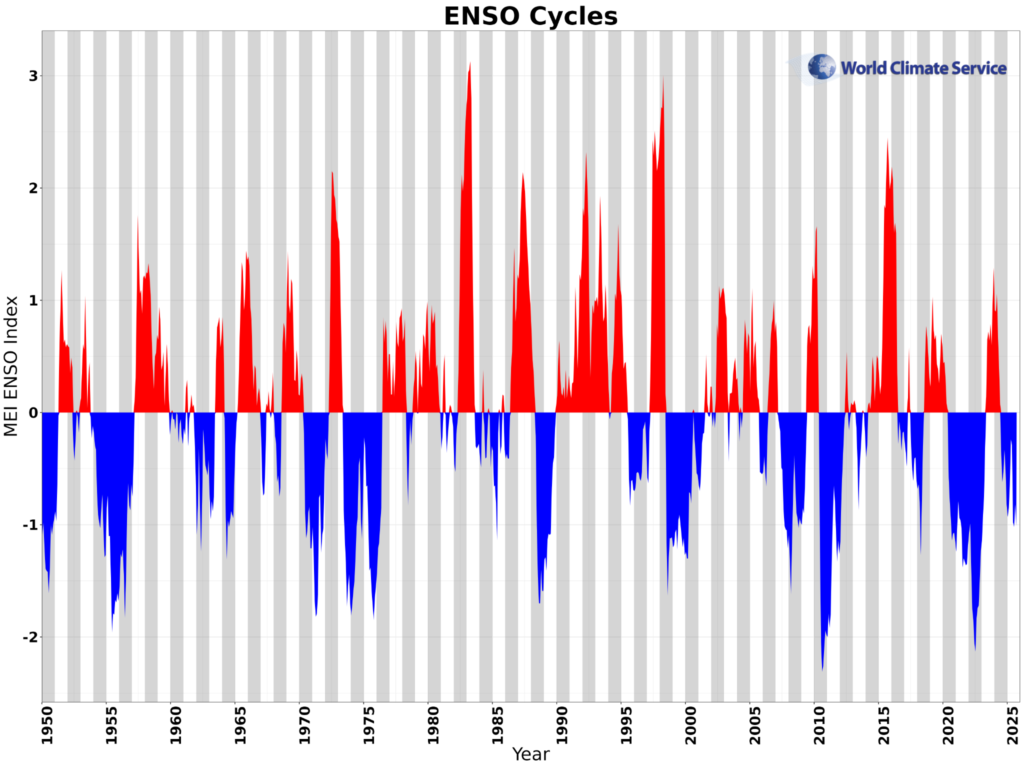
ENSO is a phenomenon causing variations in the tropical Pacific Ocean sea surface temperatures, represented in the graphic below. We use this information to analyze the impact on Brazil crops.
Impacts of La Niña on Brazil Climate
The maps below are generated using a climate analysis, monitoring, and forecasting tools called the World Climate Service. We find prior years with a La Niña event in December, January, and February (DJF) and calculate the average climate conditions while comparing normal conditions. The right-hand side shows the impact of a DJF La Niña event on DJF temperature and precipitation. The left-hand side shows the impact of a DJF La Niña on March, April, and May averaged climate conditions.
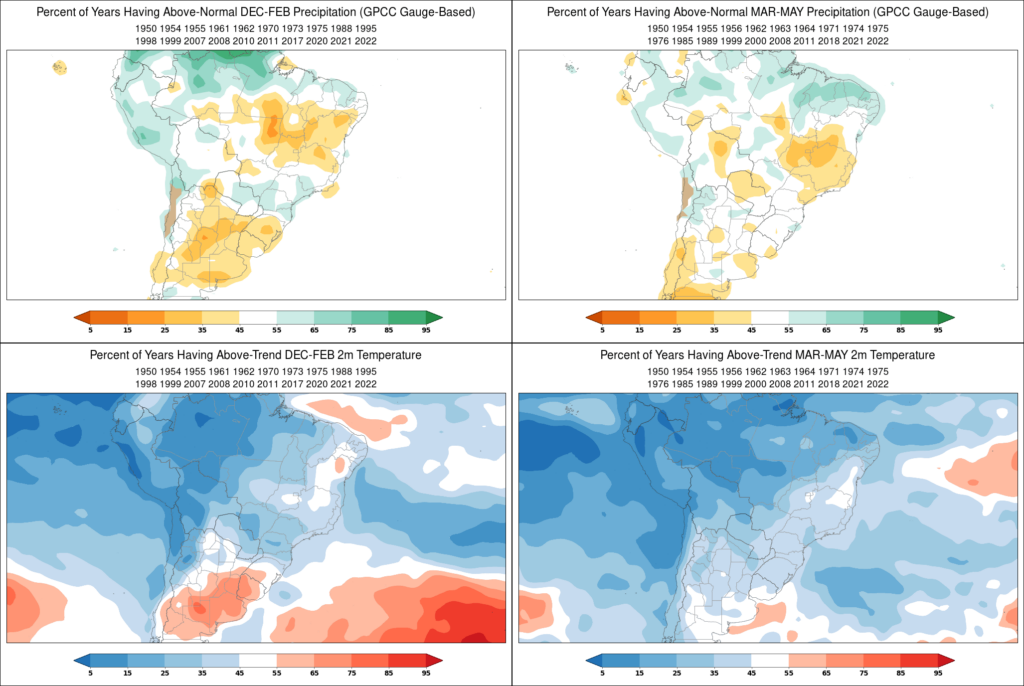
The analysis indicates that during DJF while Northern Brazil receives more precipitation than normal while central Brazil tends to be drier than normal. Temperatures tend to be cooler than normal over most of Brazil during DJF. The precipitation pattern is broadly similar for the MAM average but the probabilities of wetter than normal/drier than normal is not as strong. The temperatures remain colder than normal, similarly to the DJF time period.
Impact of La Niña on Brazil First Planting Corn
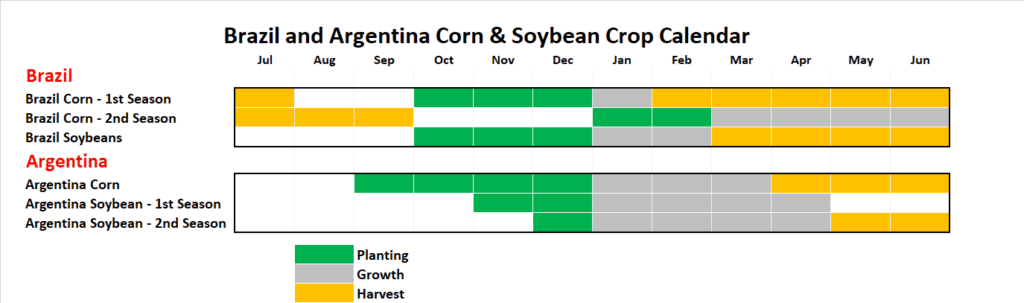
Our discussion of Brazil’s crop weather includes a discussion of the Brazil crop calendar, shown below. Brazil’s first planting of corn is generally planted late in each calendar year and is harvested as early as February but as late as May or June.
Given the La Niña impacts on Brazil’s climate, we might expect a significant impact of La Niña on the first planting of corn yield. The graphic below shows the La Niña cycles and the corresponding first planting corn yield relative to the expected estimated corn trend yield.
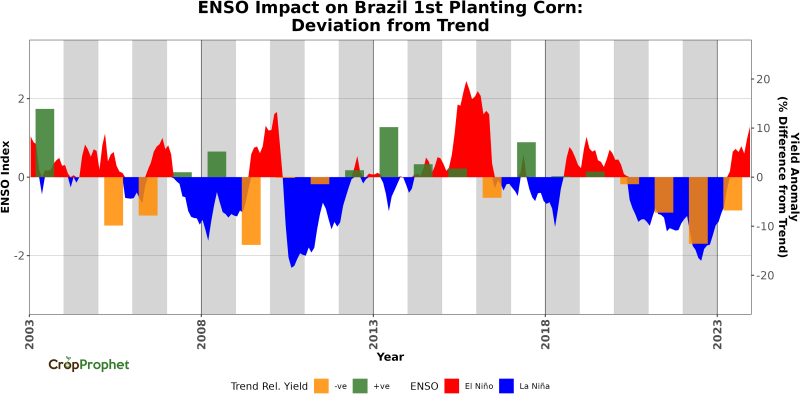
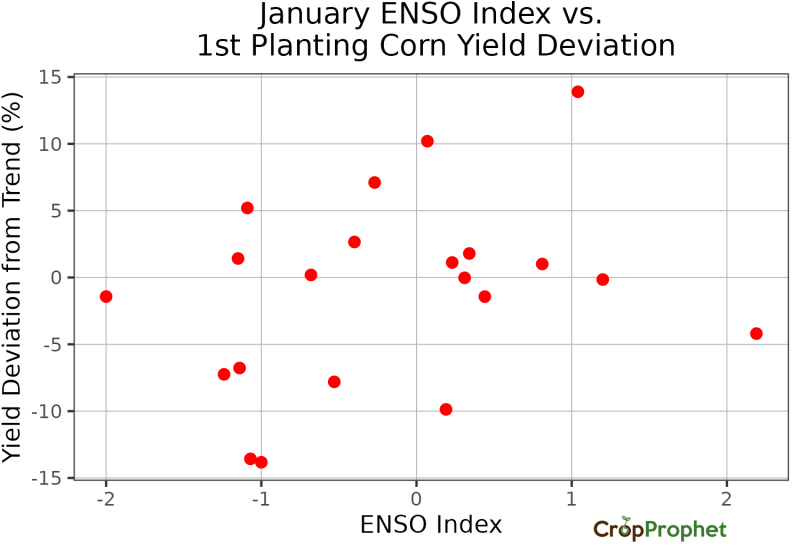
Unlike in our analysis of the impact of La Niña on Argentine crops, the ENSO Cycle/corn yield graphic does not reveal an obvious relationship. Diving deeper, we create a scatter diagram of the relationship between the ENSO index in January and the first planting corn yield deviation, shown below. Again, no strong relationship jumps off the page.
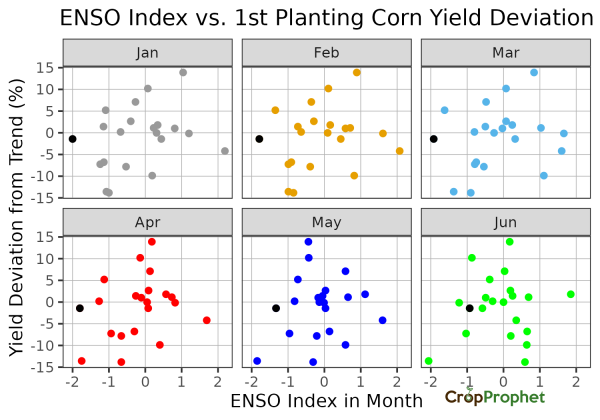
In 2011 there was a strong La Niña. The graphic below shows the ENSO index in each month compared to the end-of-season corn yield deviation. Because the first-season corn yield deviation in 2011 was close to normal, even one of the strongest La Niña in recent decades apparently did not have much impact on the first planting yield that year.
Impact of La Niña on Brazil’s Second Planting of Corn
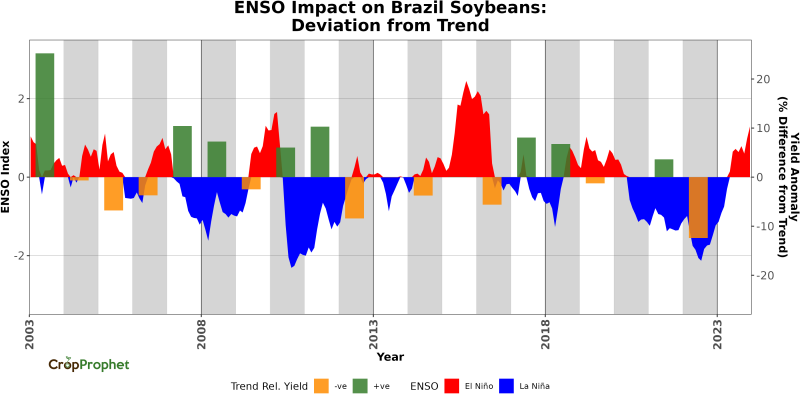
The crop planting calendar indicates Brazil’s second planting is planted during January and February. These are the months that La Niña, when they occur, have the most significant impact on Brazil’s climate. The two graphics below suggest a weak relationship between El Niño (the red area in the time series) and deviations in the corn trend.
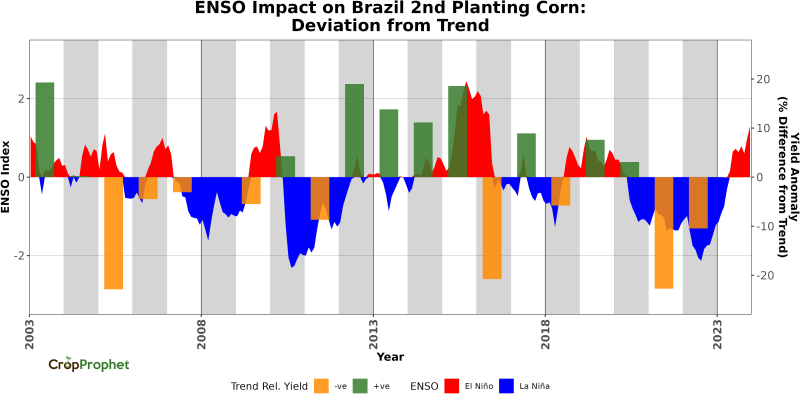
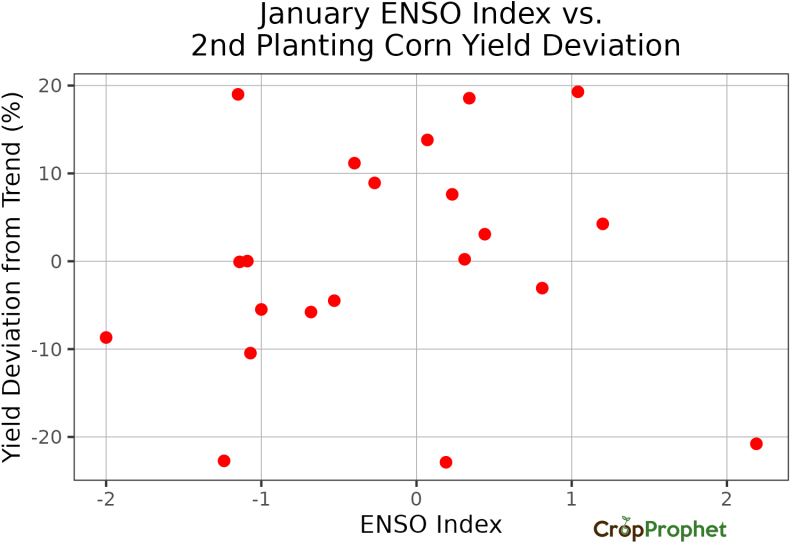
The data shown above can also be depicted as a scatter plot for the ENSO index values in January of each year. We might suggest there is a relationship between La Niña events (negative ENSO index values) and declines in corn yield, except that the two greatest corn yield decline years occurred during El Niño (positive ENSO index) events.
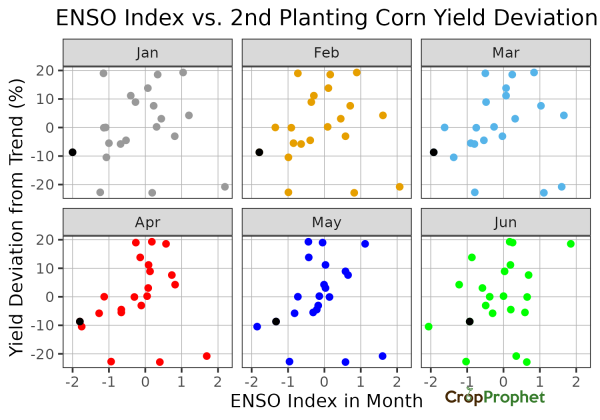
The 2011 La Niña events are highlighted as the black dot in the monthly ENSO index vs. the second planting corn yield deviation map below. As the months progress the relationship does not strengthen. In fact, by June there is no relationship between the ENSO index and corn yield deviations.
Impact of La Niña on Brazil Soybeans
The same data is presented here for Brazilian soybeans. In this case, we have more years of data available than we had for the first and second planted corn. According to the Van Trump Report, the practice of planting a second crop started in the 1980s. Unfortunately, the rise of two corn planting seasons complicates the analysis of that crop because the impact of two plantings on production statistics must be separated from each other.
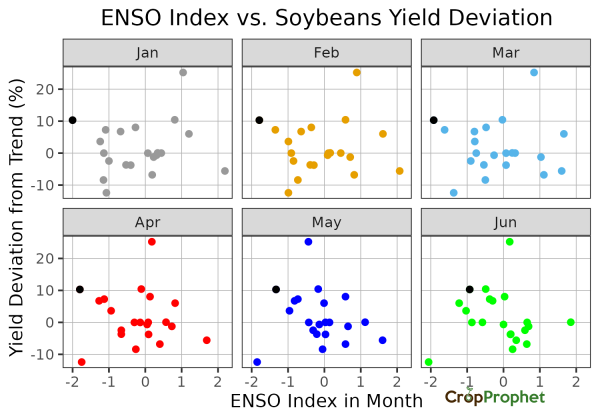
The January ENSO index versus Soybean yield deviations suggests an inverse relationship may exist.

The inverse relationship strengthens as the season progresses. Although ENSO tends to be strongest in January, the climate impacts last through the first half of the year and impact Soybean production.
Brazil Crop Yield Forecasts: Modeling the Impact of La Niña
In December 2025, CropProphet will update its Brazilian yield forecast models.