Argentina Crop: Impact of La Niña
The post discusses the impact of La Niña on Argentina corn and soybean yields compared to the technology trend over the past 30 years.
Table of Contents
3) Impacts of La Niña on Argentina Climate
4) Impact of La Niña on Argentina Corn
5) Impact of La Niña on Argentina Soybeans
6) Argentina Crop Yield Forecasts: Modeling the Impact of La Niña
2025/2026 La Niña Forecast
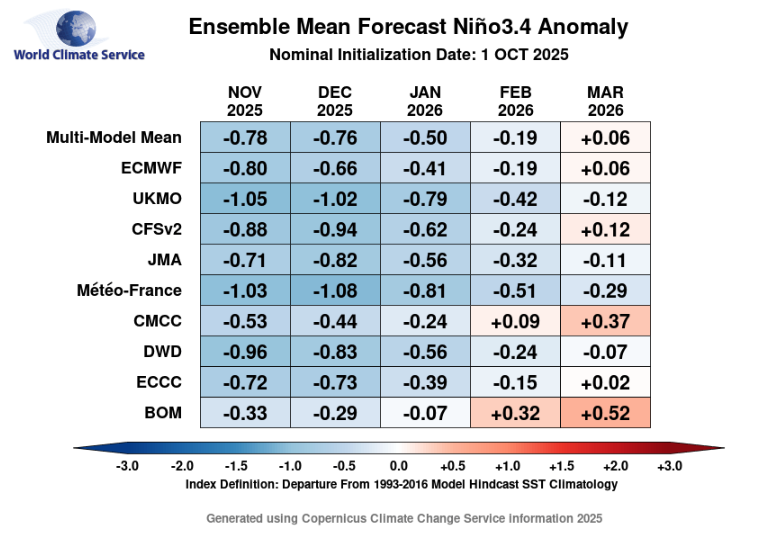
The companion product of CropProphet called the World Climate Service is currently forecasting the developing La Niña event to last through most of winter. The ensemble mean Niño3.4 forecast anomaly shown below, which is based on many different models, suggests cooler than normal temperatures in the tropical Pacific Ocean during the northern hemisphere winter. The forecast further suggests the La Niña event will last through the majority of winter.
In this post, we examine the impact a La Niña has on Argentina’s climate during the growing season and the impact on Argentina’s crop production. The uncertainty in crop production because of the La Niña impacts suggests forecasts of Argentina soybean yields and corn yield during the 2025/2026 Argentina growing season will be an invaluable tool.
We also analyzed the impact of La Niña on Brazilian crops.
Argentina is the world’s third most productive grower of soybeans and climate variability-induced changes in crop supply can affect grain prices globally. A yield forecasting tool providing valuable insights regarding the potential disruption to global grain supplies will help to manage grain market price risk while creating opportunities.
What is La Niña?
La Niña is a particular phase of the recurring El Niño/Southern Oscillation (ENSO) climate phenomenon. ENSO is defined by variations of tropical Pacific Ocean sea surface temperatures (SST) that result in changes from cooler to warmer than normal and vice versa. An El Niño is when the SSTs are warmer than normal. A La Niña is when the SSTs are cooler than normal.
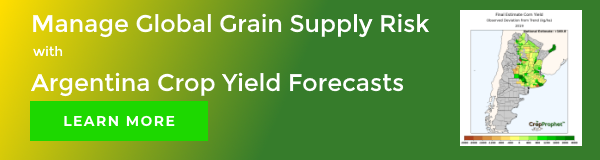
The red square in the global map below shows the approximate region of the tropical Pacific Ocean where La Niña/El Niño occurs. This map was created using the World Climate Service, a web-based portal enabling climate analysis, monitoring, and forecasting.
The analysis below is called an analog analysis. An analog analysis searches for prior years, called analog years, with conditions similar to today. In this case, we searched for a La Niña events occurring during December, January, and February since 1950. The resulting climate conditions during selected years are then averaged and compared to normal conditions. In this case, ocean and land surface temperatures are examined.
The result is a depiction of the changes in temperature across the globe that occur, on average, during a Northern Hemisphere winter La Niña event.
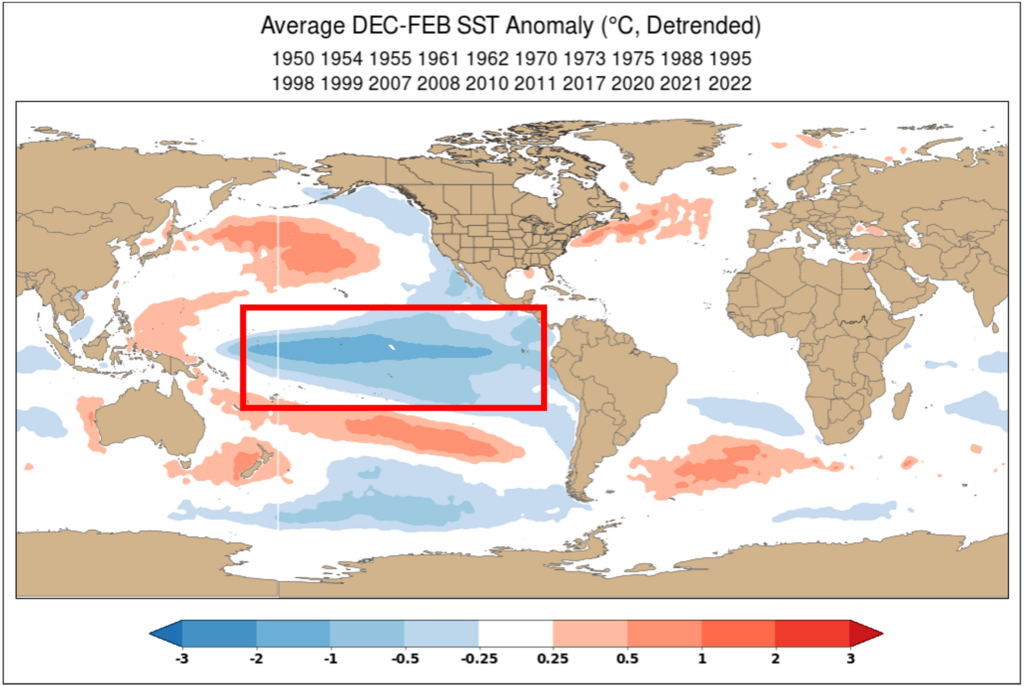
The ENSO index measures the SSTs inside the red box shown above. In this case, we will use what is called the ENSO MEI index to track ENSO variations, shown in the graphic below. This ENSO index is used to track El Niño/La Niña phases, which occur every two to seven years.
Impacts of La Niña on Argentine Climate
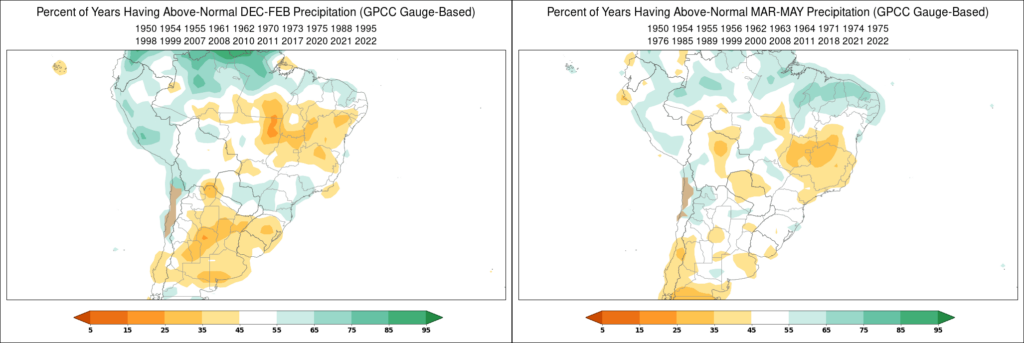
When the ENSO cycle is in a significantly positive (red, in the image above) or negative (blue, in the image above) climate conditions around the world are impacted. El Niño and La Niña events can impact the weather conditions during the Argentine growing season, which runs from approximately November to June of each year. The graphic below illustrates the impact of a December, January, and February (DJF) La Niña event on December, January, and February, and March, April, and May (MAM) precipitation for Argentina and Brazil.
The analysis depicts the probabilities of above-normal precipitation because the impact of a La Niña is by no means the same during each event. Low chances of above-normal precipitation are the same as higher chances of below-normal precipitation. So, the yellow/brown areas in the map below tend to experience dry conditions during a La Niña event. During DJF, large areas of Brazil and Argentina are impacted, whereas for MAM, the dry conditions remain focused in southern Argentina.
Impact of La Niña on Argentine Corn
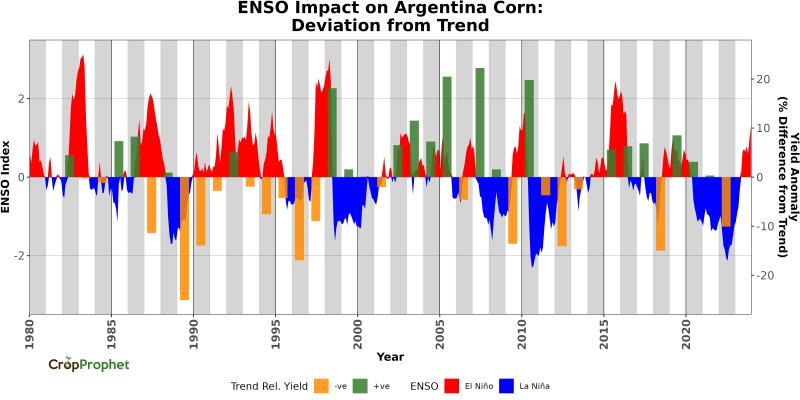
The impact of La Niña on the Argentine corn crop can be estimated by comparing values of the ENSO index and the deviation from the corn yield trend measured as a percentage of the technology trend.
This depiction is shown below. We can see that El Niño events (red) are generally associated with positive yield deviations (green bars) and La Niña events (blue) are generally associated with negative yield deviations (orange bars).
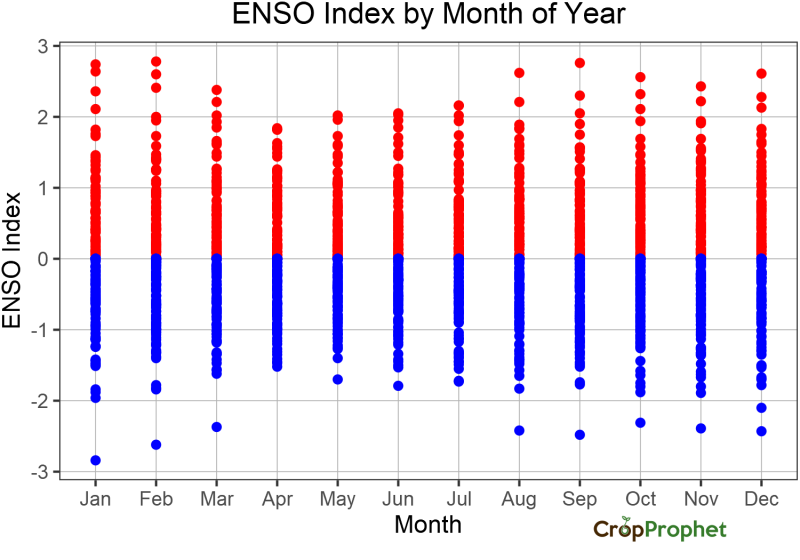
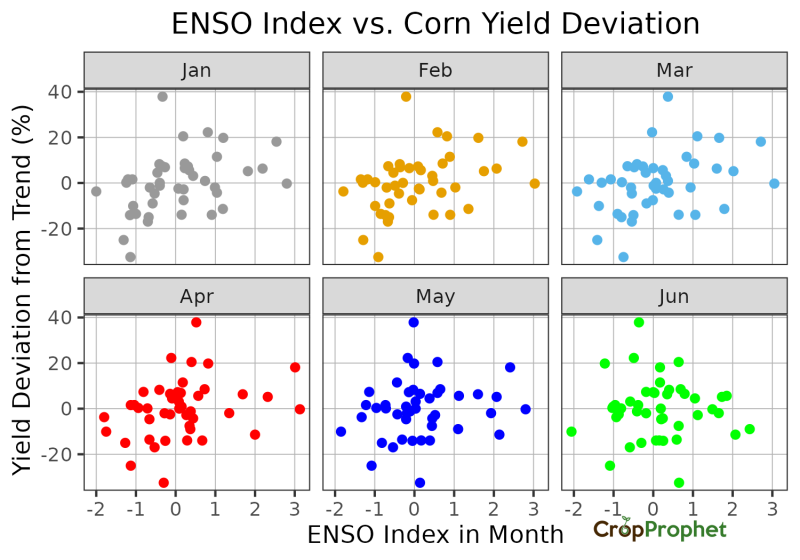
The Argentine crop season generally runs from November/December to June/July each year. Looking below at the ENSO index values by the month of the year, we see the ENSO index generally reaches its strongest values in December, January, and February and becomes weaker during April, May, and June. So, when strong ENSO events occur, their most significant impacts occur in the early portion of the Argentine crop season. The strong El Niño/La Niña events weaken during the latter half of the Argentine crop season.
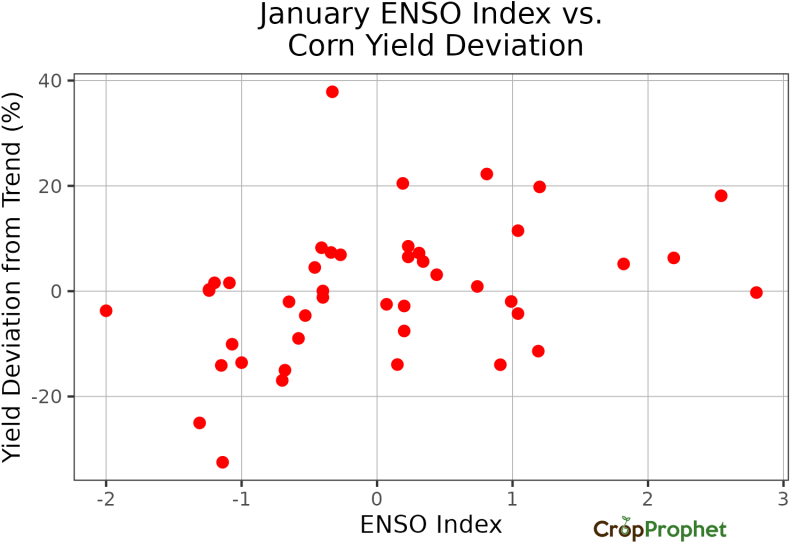
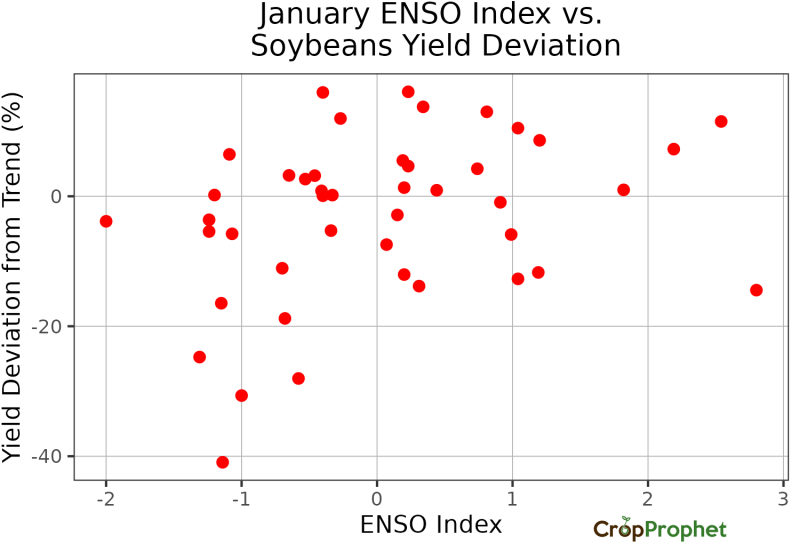
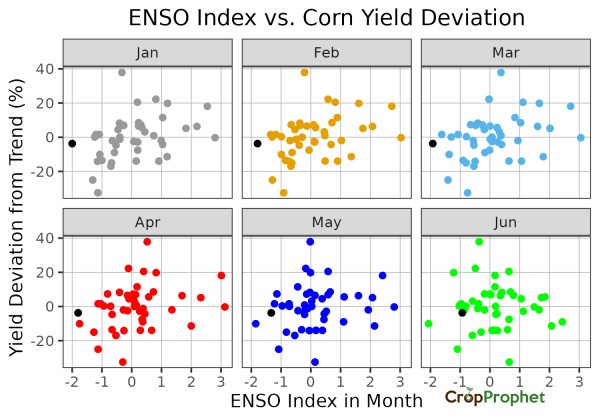
We can compare the value of the January ENSO index with the corn trend yield deviations, shown below. The analysis indicates that La Niña events (negative ENSO index values) are related to declines in trend relative corn yields. But ENSO events, as discussed above, evolve. So, let’s look at the same chart by the month of the Argentine growing season.
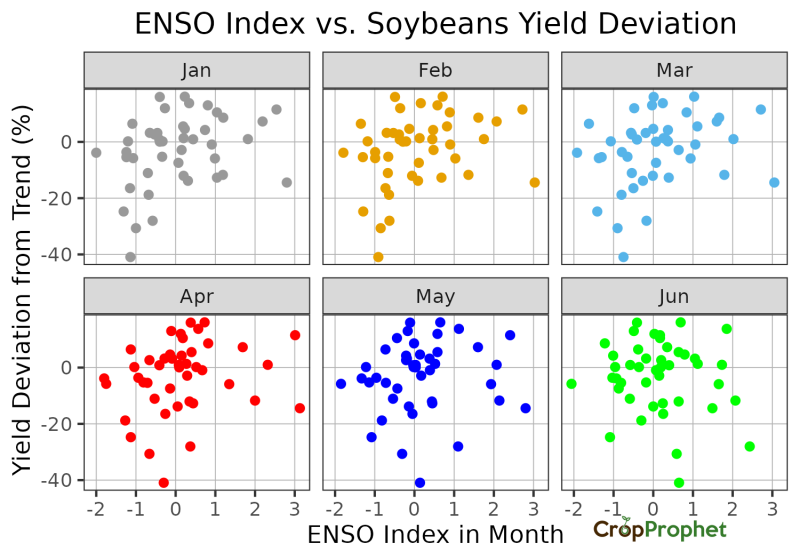
The chart below shows the same ENSO index vs. corn trend yield deviations analysis, but by the value of the ENSO index in each month for the first six months of the year. We see that the strong relationship that existed in January between corn yields and the ENSO index breaks down by June.
The ENSO impact during January, February, and March significantly impacts the Argentinian temperature and precipitation climate. It creates generally drier and warmer conditions during the early part of the growing season. As the impact of ENSO weakens into the Southern Hemisphere wintertime, the climate changes are less impactful.
Impact of La Niña on Argentina Soybeans
The same analysis can be conducted for the impact of ENSO on Argentine soybeans.
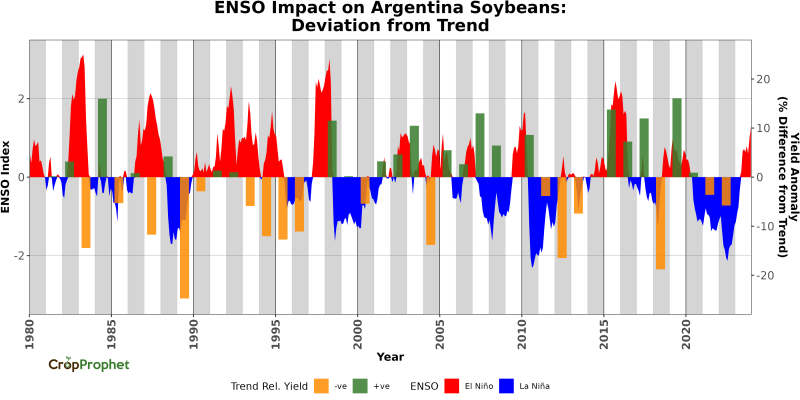
A similar relationship exists between ENSO and Argentina soybean yield trend deviations, although it appears to be less strong.
Finally, just as with the Argentina corn crop, the relationship shifts from January to June in a similar manner. By June, there is no apparent relationship between the ENSO index and soybean yield deviations.
Argentina Crop Yield Forecasts: Modeling the Impact of La Niña
A recent strong La Niña event occurred in 2011. The ENSO vs. Month chart for corn is shown again but with 2011 highlighted as the black dot. Even though 2011 was a strong La Niña it did not have the greatest yield impact.
We can conclude from this that while an El Niño/La Niña impacts Argentina’s crops, there are enough variations in climate from event to event that other factors can be significant. Monitoring the evolution of the crop daily and weekly as the crop season develops remains important to monitor yield developments.
We can review crop yields from 2011 to gain an understanding of the potential impacts of the 2025/2026 La Niña event on corn and soybean yields. As shown below, the 2011 corn and soybean crop during 2011 were significantly below trend.
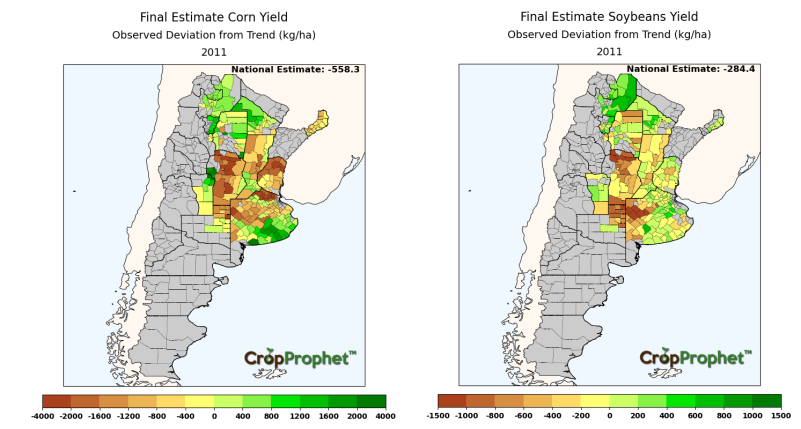
To place the -558 kg/ha below trend for corn and -294 kg/ha below trend for soybeans into context, the end of season production for both crops from 2001 to 2024 is shown below. As can be seen, the 2011 crop year resulted in Argentina’s crop production finishing the year substantially below normal production.
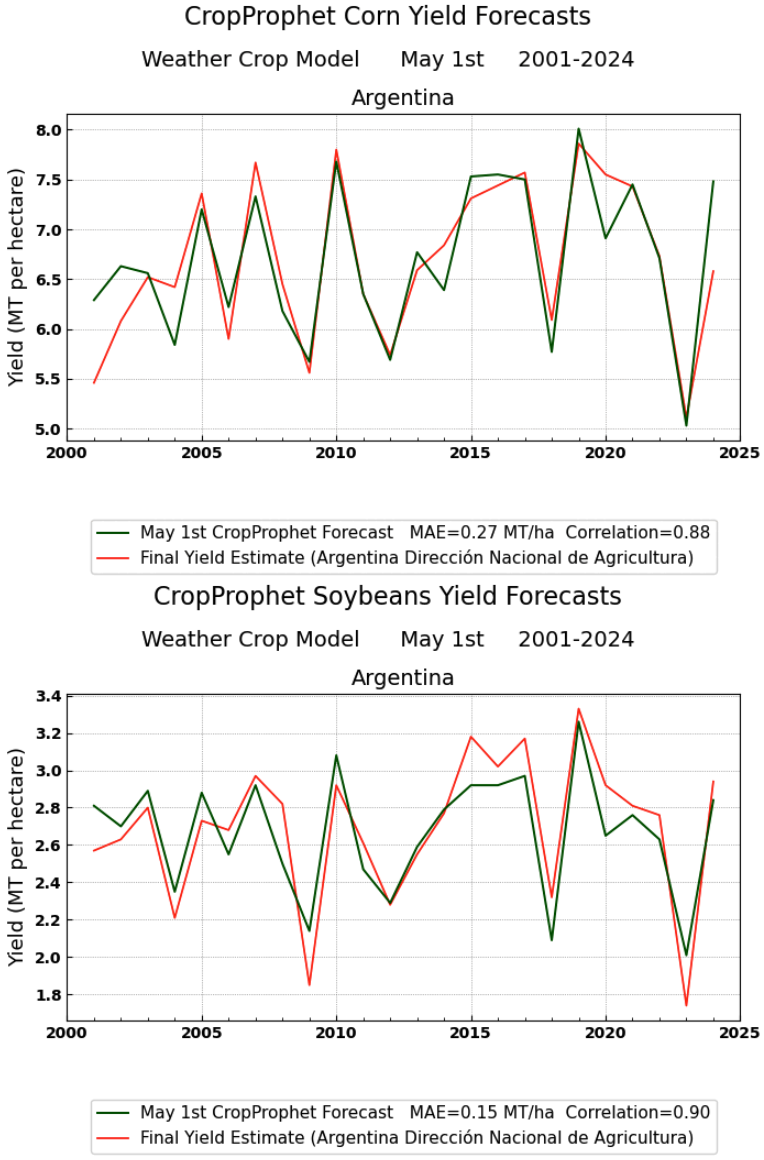
CropProphet is releasing Argentina soybean yield forecasts and Argentina corn yield forecasts starting in December of 2025 to help you manage risk. The La Niña event and it’s potential impact on the Argentinian grain supply and the global trade balance creates grain trading risk and opportunities. Request a trial of CropProphet today.