USDA NASS and Futures Prices
A University of Illinois FarmDoc Daily report indicates that corn futures market prices react to the August NASS end-of-season yield and production estimate information. Furthermore, a CropProphet customer recently commented that while predicting corn and soybean yield is important, forecasting what the USDA will release each month during the crop season is equally important. Thus, predicting whether or not the USDA is likely to change its end-of-season yield forecast during the crop season is valuable to skilled grain traders.
While we’ve published information regarding how CropProphet supports daily grain trading, this analysis documents the use of CropProphet grain yield forecast data to predict the direction of the monthly updated USDA corn and soybean monthly end-of-season estimates. We’ve examined the accuracy of the USDA August corn yield updates elsewhere. We use data from CropProphet Modeler, a product option that provides data enabling systematic and discretionary grain traders to analyze grain yield forecasts and weather impacts on grain markets.
CropProphet Modeler
The CropProphet Modeler data set provides users a wealth of crop modeling data. Data available include prior years of the operational CropProphet yield and production forecasts, statistically created prior CropProphet forecasts, USDA NASS reported yields, crop conditions, crop progress, and each monthly end-of-season estimate. It also provides a daily county-level weather database used to model the impact of weather on grains.
We use data from the CropProphet Modeler product in this study.
CropProphet Data Used
CropProphet’s primary goal is to forecast annual national grain yield and production as accurately as possible. But, that doesn’t mean there are not a wide range of applications for this data.
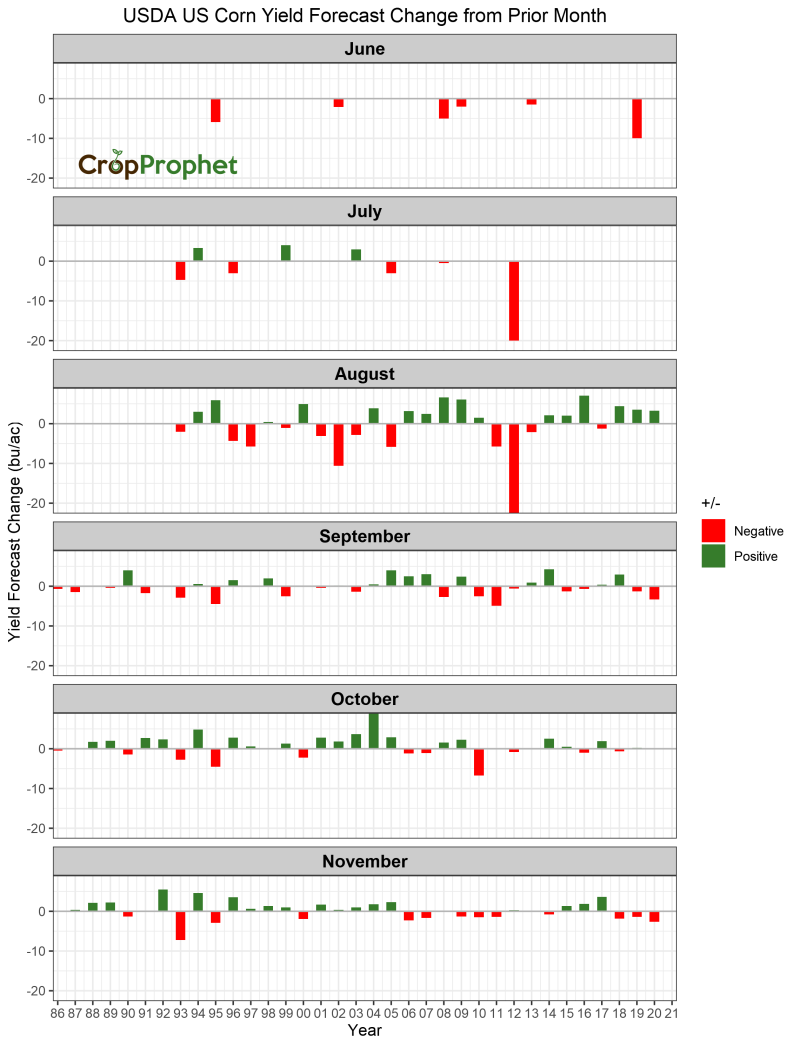
The CropProphet Modeler data set includes the history of USDA NASS end-of-season yield estimates since 1993. Each year between May and December, NASS updates its end-of-season yield forecast. The graph below shows the history of the month-to-month change of the USDA corn yield estimates.
For example, the USDA rarely changes its yield estimate from May to June. However, the graphic also indicates that August corn yield updates almost always change relative to July, even by a small amount.
The study’s second piece of data is the daily history of CropProphet cross-validated corn and soybean yield forecasts. Cross-validation is a statistical method to ensure accurate modeling while using the maximum information available. For example, in a 40-year crop and weather data history, cross-validation forecasts yield for one year based on a model trained using all 39 other years. This process is repeated 39 times by leaving out a single year in each training process. In this manner, CropProphet creates a relatively long history of independent forecasts, enabling model performance testing.
The CropProphet cross-validated dataset provides, among other data, 37 years of daily-updated corn and soybean yield forecasts. Since we seek to predict USDA yield estimate change from the prior month, we calculate the change of the CropProphet yield forecast over, for example, 30 days. We start with 30 days because that is the approximate length of time between USDA end-of-season yield forecast estimates.
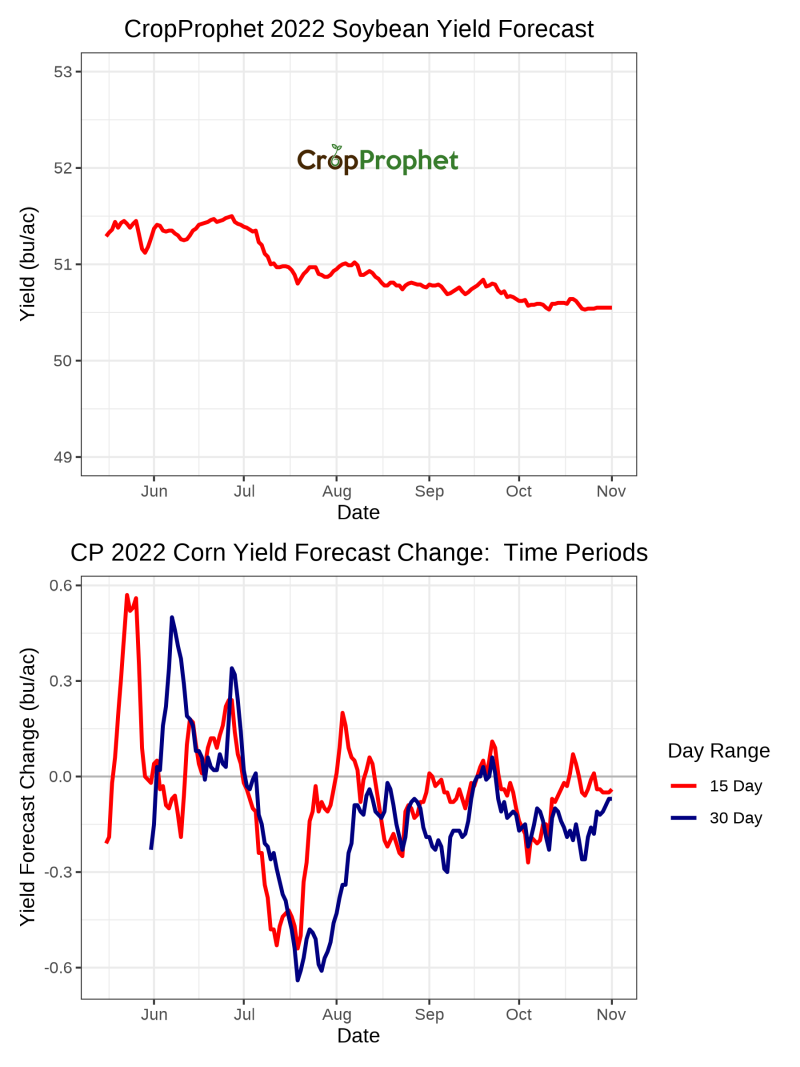
The graphs below show the 2022 CropProphet US national soybean yield forecast and the 15-day and 30-day change of the forecast. The 30-day yield forecast change is the data type initially used to model the USDA NASS yield estimate month-to-month changes.
CropProphet vs. USDA Monthly Corn Yield Updates Analysis
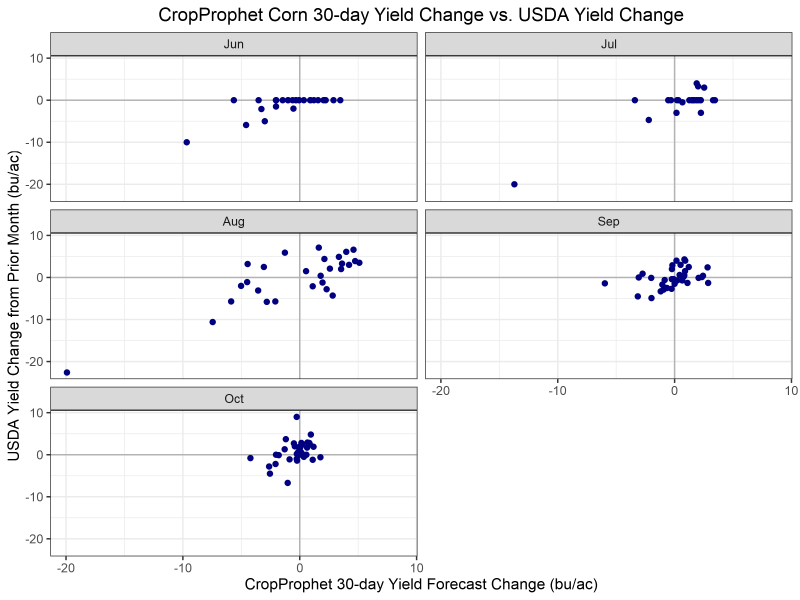
The first step of the analysis compares the USDA yield forecast changes with the 30-day CropProphet yield forecast changes. In this case, we compare the 30-day CropProphet yield forecast change for the 30 days ending on the day of each year’s NASS yield forecast update. In other words, CropProphet users have access to this information before markets open on USDA yield forecast release day to inform their trading.
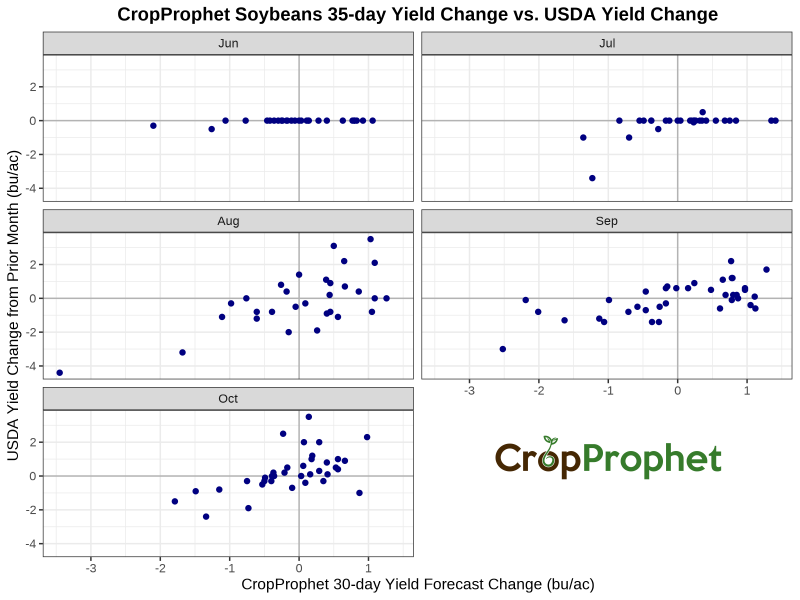
The 30-day change in the CropProphet corn yield forecast versus the monthly change in the USDA corn yield estimate since 1993 is shown below. The USDA rarely changes its yield forecast in June and July, so the relationship is necessarily weak. While the correlations of these scatter plots are provided in the table below, visually, August appears to be a fairly strong relationship while September and October are weaker. This result is understandable because late-season weather conditions have less of an impact on crop yields.
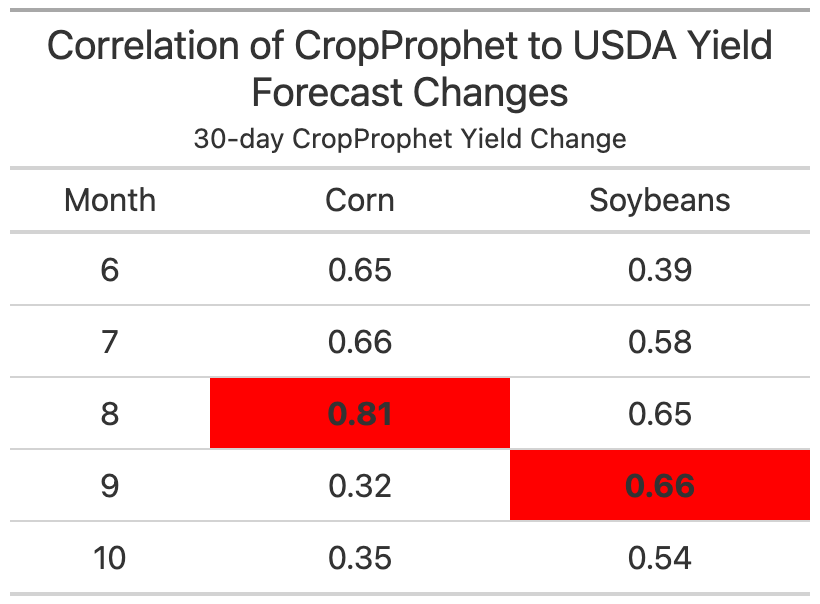
We summarize the results by calculating the correlation of the CropProphet 30-day corn yield forecast changes versus the USDA yield forecast changes from the above graphs. The result is below, and the greatest correlation for each crop is highlighted in red. The greatest correlations occur in August for Corn and September for Soybeans.
Because we know the USDA rarely changes their yield estimates early in the crop season, June and July are not considered further.
USDA NASS Yield Forecast Changes: Optimum Period
We arbitrarily chose 30 days because it coincides with a calendar month. However, this begs the question: what is the optimum number of days to estimate the USDA monthly yield forecast changes?
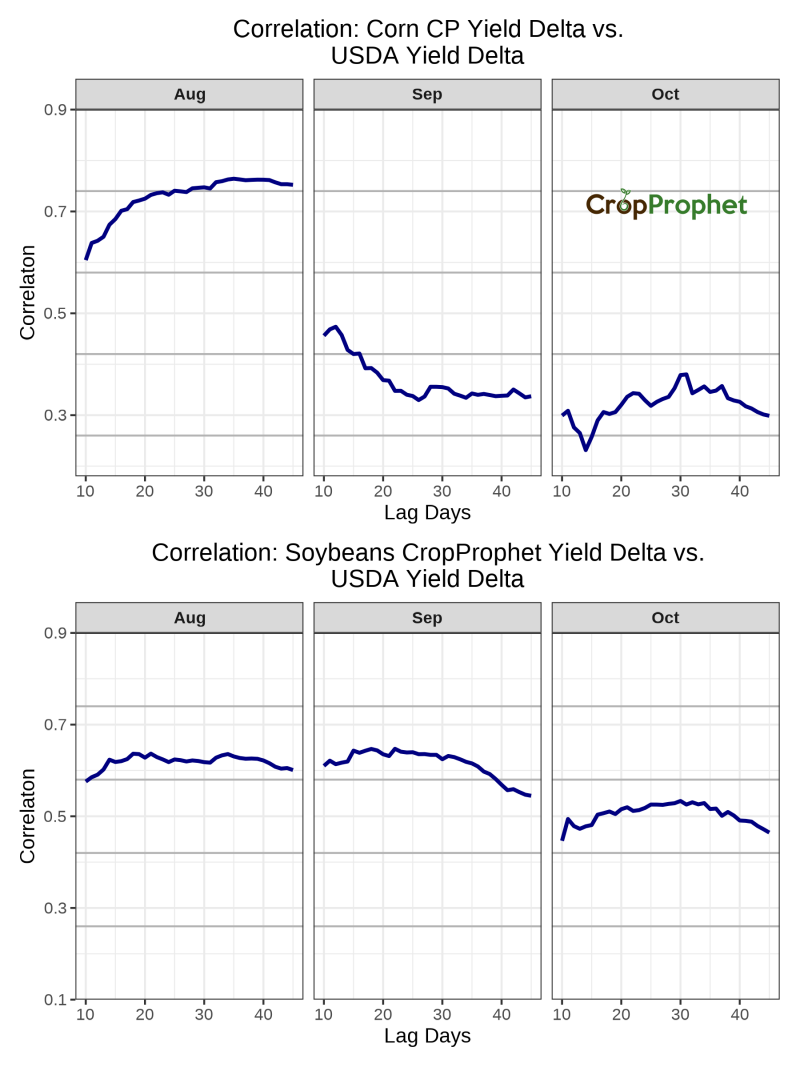
We calculate the correlation between the forecast changes for all-day ranges of between 10 to 45 days to answer this question. The graph below shows that for August corn, the maximum correlation is achieved at 35 days. For September and October, the correlation remains is variable throughout the range of days.
For soybeans, the correlation increases gradually as more days are considered in August and September. The September correlation is maximized at 22 days. By October, the the 30 day lag generates the highest with the USDA monthly soybean yield estimate.
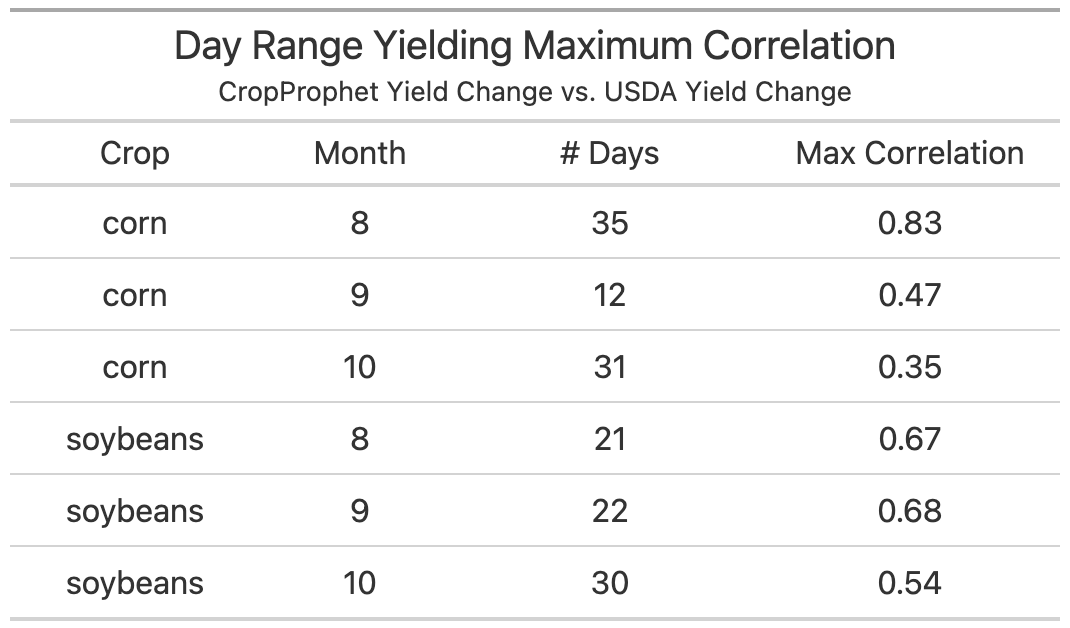
The day range yielding a maximum correlation is shown in the table below.
Modeling Monthly USDA Yield Changes
We focus on a simple model to determine how well the CropProphet optimized yield forecast change predicts the USDA monthly yield forecast changes. The simple model is:
△USDA = C * △CP + I
Where:
△USDA = The change in yield forecast from the prior month,
C = A constant,
△CP = The CropProphet yield forecast change over N-days, where N is specified in the discussion, and
I = The y-intercept.
We use linear regression to estimate the constant, C, and the intercept, I. △CP and △USDA are data calculated from the CropProphet Modeler data set.
We focus on August for corn and September for soybeans because they have the highest demonstrated correlation to the CropProphet 30-day yield forecast change.
The linear regression model is estimated using cross-validation, discussed above. Each year from 1993 to 2020 is forecasted by training a model using all other years.
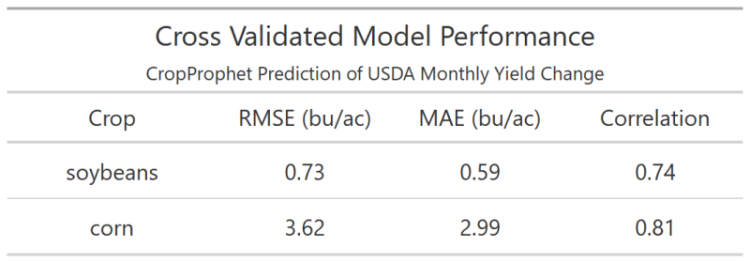
The table below summarizes the performance of this model. Note that the cross-validated prediction correlation is slightly less than the correlation of the entire dataset discussed above.
NASS Yield Forecasts: Contingency Table

We conduct a second analysis of the results. A contingency table analysis examines the frequency the CropProphet based model correctly predicts the USDA yield forecast change direction. In other words, when the CropProphet yield forecast change is positive or negative, how often does the USDA change their yield forecast in the same direction?
The graph below compares the CropProphet September Soybeans yield forecast change prediction vs. the actual USDA yield forecast change. The graph regions colored pink are years when the CropProphet prediction and the actual USDA yield forecast changed in the same direction.
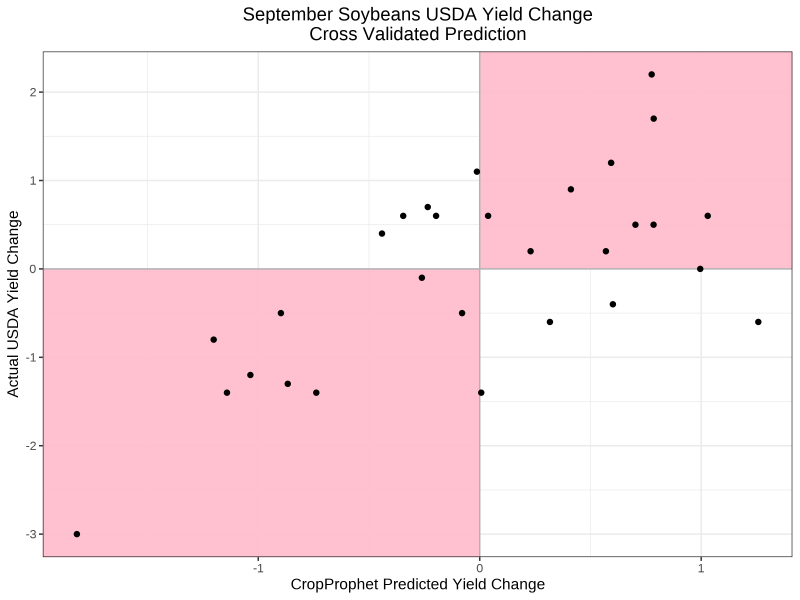
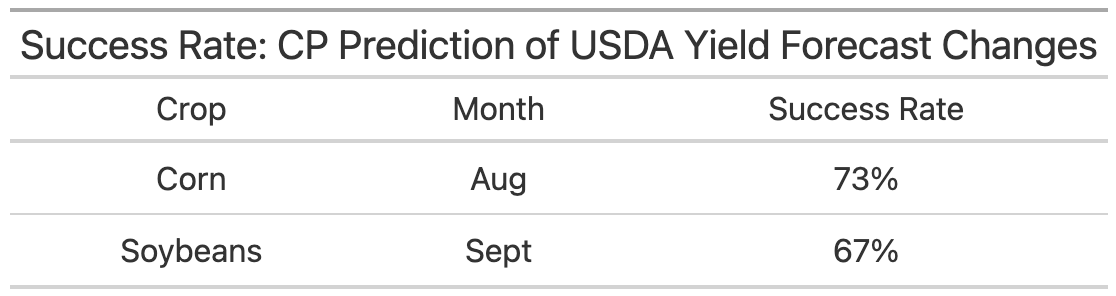
A simple cross-validated CropProphet-based model correctly predicts the direction of the USDA September Soybean yield forecast changes 67% of the time. The same model also predicts the USDA August corn yield forecast direction changes 73% of the time. These results are summarized in the table below. The other months are not shown here.
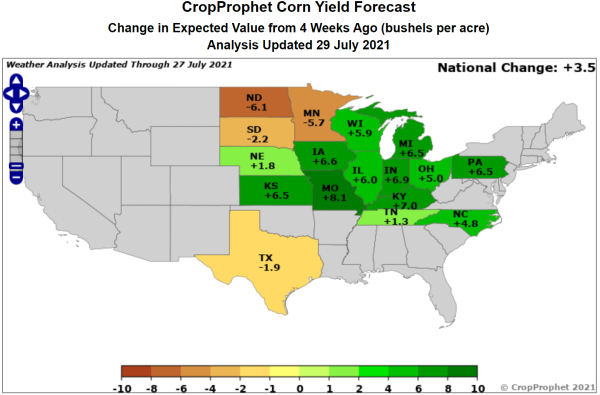
CropProphet conveniently includes information showing the change of the forecast of corn and soybean over the prior four weeks, as in the product screenshot below. The 30-day yield forecast change can be used to predict the direction and magnitude of the change from the prior month of the USDA mid-month yield forecasts.
Conclusion
The USDA NASS monthly yield forecasts, released near the middle of the month from May to December, are closely tracked by the grain trading market. Therefore, a trading advantage can be gained by having access to information in advance of the USDA monthly releases that reliably indicate the direction and magnitude of the USDA’s yield estimate change from the prior month. This analysis demonstrates that CropProphet can be used as a reliable source of information. In addition, the CroProphet Modeler dataset enables research into the performance of the CropProphet grain yield and production forecast system and the development and evaluation of grain trading opportunities.