USDA WASDE: How accurate are the estimates?
As the end of the crop season approaches each year, the market eagerly awaits the August USDA World Agricultural Supply and Demand Estimate (WASDE) report, released by Cornell University’s Mann Library. CropProphet is a web-based solution that provides users with weather-based corn yield forecasts for the end-of-season USDA national corn and soybean yield and production estimates. As such, we monitor and compare our predictions relative to the USDA WASDE corn yield forecasts during the season. In fact, we’ve shown that CropProphet can be used to predict the Monthly USDA corn and soybean yield estimates.
While the USDA WASDE monthly report focuses on many other agricultural commodities, this analysis focuses on the corn yield forecast component of the information release because it moves markets. May grain traders seeks to predict the direction of the yield forecast to implement discretionary and systematic corn yield trading strategies. The USDA WASDE is an important indicator of commodity markets of agricultural supply and demand. We recently published an analysis of using CropProphet to forecast the USDA NASS corn and soybean yield forecast changes, which are a component of the WASDE reports.
How accurate is USDA August yield forecast vs. final estimates?
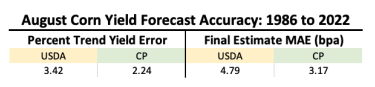
The USDA August corn yield forecast mean absolute error of estimates from 1986 to 2022 is 4.79 bu/ac. CropProphet’s August cross-validated corn yield forecast error made on the same day as each of the USDA estimates is 3.17 bu/ac.
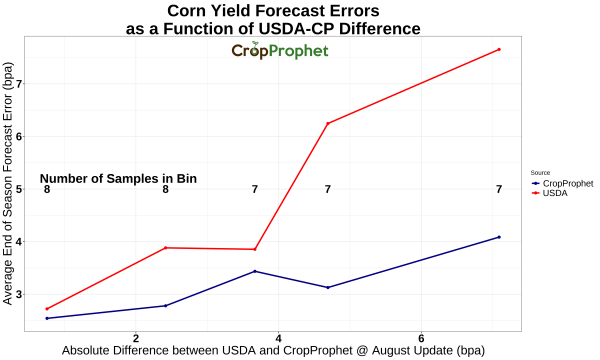
More detail can be gleaned with an indepth analysis of the USDA and CropProphet August corn yield forecasts. The result is summarized by the graph below showing the accuracy of CropProphet and the August USDA U.S. corn yield forecasts as a function of the difference between the two forecasts on the day of the August USDA estimate release. You can read how we developed this analysis or you can jump right to the bottom of the post and read our conclusions.
Corn Yield Forecast History – August
It’s worthwhile to compare the historical accuracy of CropProphet corn yield forecasts relative to the August USDA WASDE corn yield forecast. To do this, we use the CropProphet Modeler data set, which provides as much as 37 years of daily corn (and soybean) yield forecast data based on a cross-validated backtest of the crop models. This data allows us to assess the performance of CropProphet in different scenarios and anticipate how it will likely perform in the future.
To start, we extract the CropProphet corn yield forecast from the same day that the USDA August WASDE corn yield estimates were released over a 37-year period from 1986 to 2022. We also extract the USDA end-of-season final corn yield estimates for each of these years. This information is shown in the graph below.
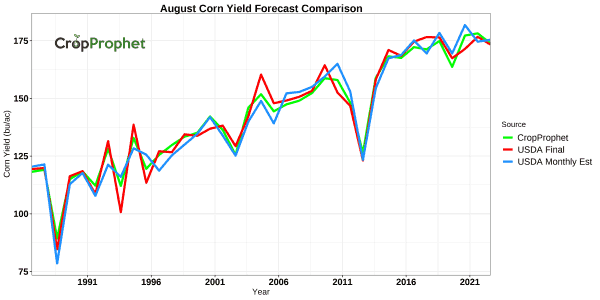
The graph illustrates the significant deviations from the technology trend (the up and to the right slope of the graph) that occur in favorable and unfavorable weather years, both of which are generally anticipated by USDA and CropProphet, but with substantial differences and errors in each forecast. We’ll take a closer look at these differences.
USDA WASDE Corn Yield Forecast Errors – August
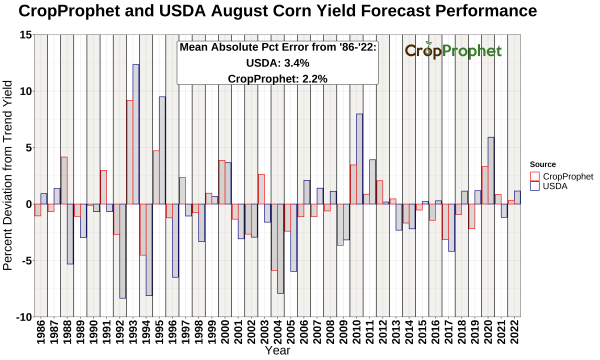
The graph below compares the CropProphet and USDA August corn yield forecast errors as a percentage of the estimated technology trend. On average CropProphet achieved a 2.2% trend relative absolute error while the USDA achieved a 3.4% trend relative error. In other words, CropProphet is more accurate than the USDA in August.
USDA WASDE vs. CropProphet
The chart below shows the history of the differences between August USDA and CropProphet forecasts on the day of the August WASDE release.
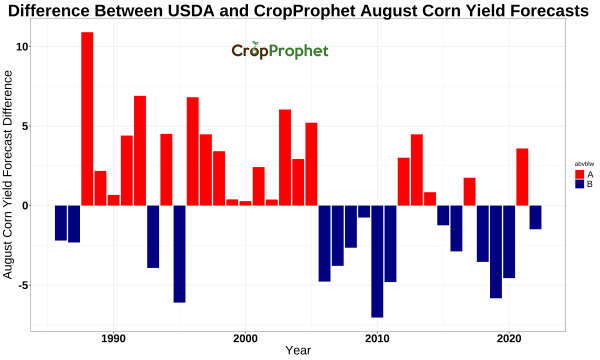
The largest difference occurs in 1988 when the USDA August corn yield forecast was more than 10 bpa higher than CropProphet. The graph also reveals that the August WASDE corn yield forecast and the CropProphet corn yield forecast are usually different by at least a few bushels per acre.
August Corn Yield Forecast Comparison: Conclusion
Are CropProphet August corn yield forecasts more accurate when it’s forecast is significantly different than the USDA’s forecast?
To answer that question we analyze how well CropProphet has performed in all 37 Augusts, including those when the USDA forecast was significantly different from the CropProphet.
This was done by using the following method to analyze the above information:
1) Sort, from smallest to largest, the absolute difference between the August USDA WASDE corn yield estimate and the CropProphet corn yield forecast on the same day.
2) Compute the absolute yield error for USDA and CropProphet for each year in the historical 37-year period.
3) Bin the differences between CropProphet and the USDA yield forecasts in to 5 bins, then calculate the average absolute USDA and CropProphet yield forecast error for each bin.
4) Plot the end of season yield forecast error as a function of the absolute difference between the August USDA and CropProphet corn yield forecasts.
We have arrived at a graph that reveals valuable insights. The chart below shows the accuracy of the August USDA and CropProphet U.S. corn yield forecasts as a function of the difference between the two forecasts.
X-axis: The absolute difference between the USDA and CropProphet forecasts on the day of the release.
Y-axis: The absolute error of both forecasts based on the USDA end-of-season final estimate released in January.
What does this result mean:
1) The August USDA forecast accuracy decreases as the USDA and CropProphet forecast differences increase.
2) CropProphet forecast accuracy remains relatively consistent even when it diverges from the USDA forecast.
3) If this result remains valid in 2023, it would suggest that the current CropProphet forecast will be considerably more accurate than the August USDA estimate.
There have been many questions in the market this year about the validity of USDA estimates and information, leading to market volatility. CropProphet provides customers an opportunity to assess yield and production using an objective corn yield forecast methodology that quantifies the impact of corn season weather conditions on yield, and – critically – is not subject to market hype.