CropProphet provides weather-based corn yield (and soybean) and production forecasts. Our crop yield and production forecast model is based on county-level data and analysis but we focus on providing the most accurate possible national-level forecast of corn and soybean production.
In other words, we help grain traders, grain merchandisers, and discretionary and systematic commodity traders manage weather risk by quantifying the impact of weather on grain crops. A wide range of grain commodity traders seize grain market trading opportunities using CropProphet by knowing the differences between market perceptions of corn production and our accurate forecast. As the market perception corrects towards the CropProphet forecasts corn prices change. Our customers have an information advantage in the grain market.
Knowing the impact of weather on national grain yield is hard. We make it easy.
Discover the benefits of CropProphet now.

The information below provides the top corn-producing counties for each year from 2000-2022. You can also view corn production rankings by state or ask “What state produces the most corn?
What county produces the most corn?
As shown in the table below, the US county that produced the most corn in 2022 was McLean County, Il. It has been the top corn producing US county since 2013. The drought of 2012 knocked McLean county off it’s perch, when it was the second most corn producing state in the United States.
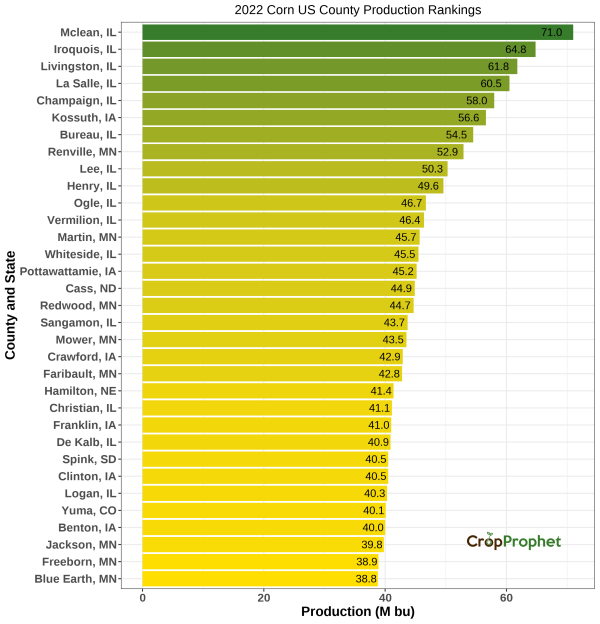
Corn Production by County: Top 33 of 2022
The top 33 corn-producing counties (and their total production) of 2022 was:
| County Production Rankings: 2022 | ||
| Rank | County, State | Production (M bu) |
|---|---|---|
| 1 | McLean, IL | 71.0 |
| 2 | Iroquois, IL | 64.8 |
| 3 | Livingston, IL | 61.8 |
| 4 | La Salle, IL | 60.5 |
| 5 | Champaign, IL | 58.0 |
| 6 | Kossuth, IA | 57.1 |
| 7 | Bureau, IL | 54.5 |
| 8 | Renville, MN | 52.9 |
| 9 | Lee, IL | 50.3 |
| 10 | Henry, IL | 49.6 |
| 11 | Ogle, IL | 46.7 |
| 12 | Vermilion, IL | 46.4 |
| 13 | Martin, MN | 45.7 |
| 14 | Cass, ND | 45.6 |
| 15 | Whiteside, IL | 45.5 |
| 16 | Pottawattamie, IA | 45.4 |
| 17 | Redwood, MN | 44.7 |
| 18 | Sangamon, IL | 43.7 |
| 19 | Mower, MN | 43.5 |
| 20 | Crawford, IA | 43.1 |
| 21 | Faribault, MN | 42.8 |
| 22 | Hamilton, NE | 41.4 |
| 23 | Christian, IL | 41.1 |
| 24 | Franklin, IA | 41.0 |
| 25 | De Kalb, IL | 40.9 |
| 26 | Clinton, IA | 40.6 |
| 27 | Spink, SD | 40.5 |
| 28 | Logan, IL | 40.3 |
| 29 | Yuma, CO | 40.1 |
| 29 | Benton, IA | 40.1 |
| 30 | Jackson, MN | 39.8 |
| 31 | Freeborn, MN | 38.9 |
| 32 | Webster, IA | 38.8 |
County Corn Production – 2022
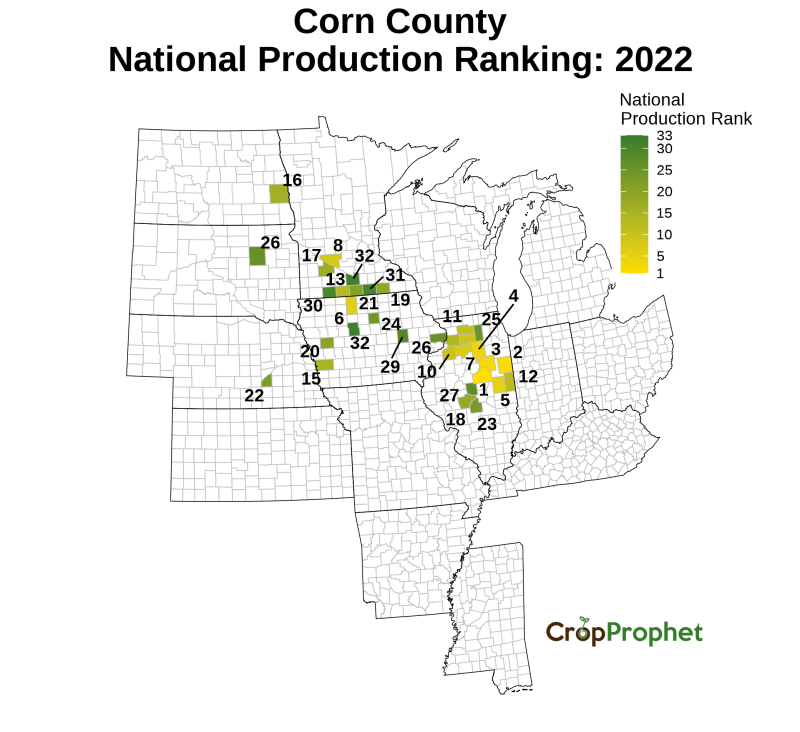
County Corn County National Production Ranking – 2022
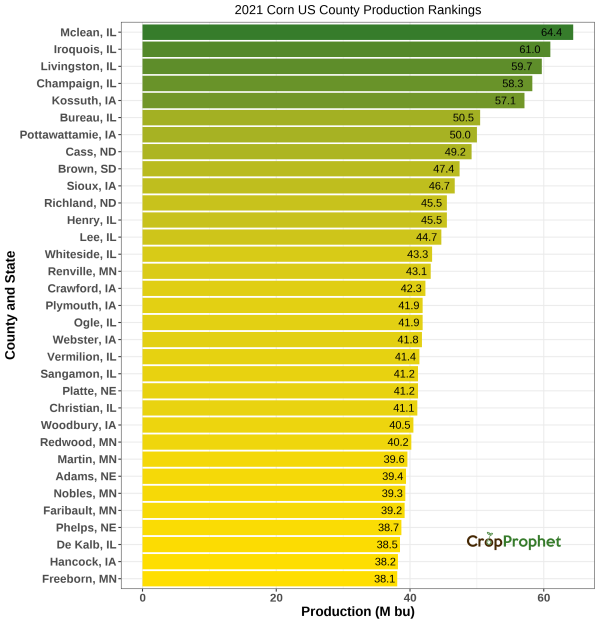
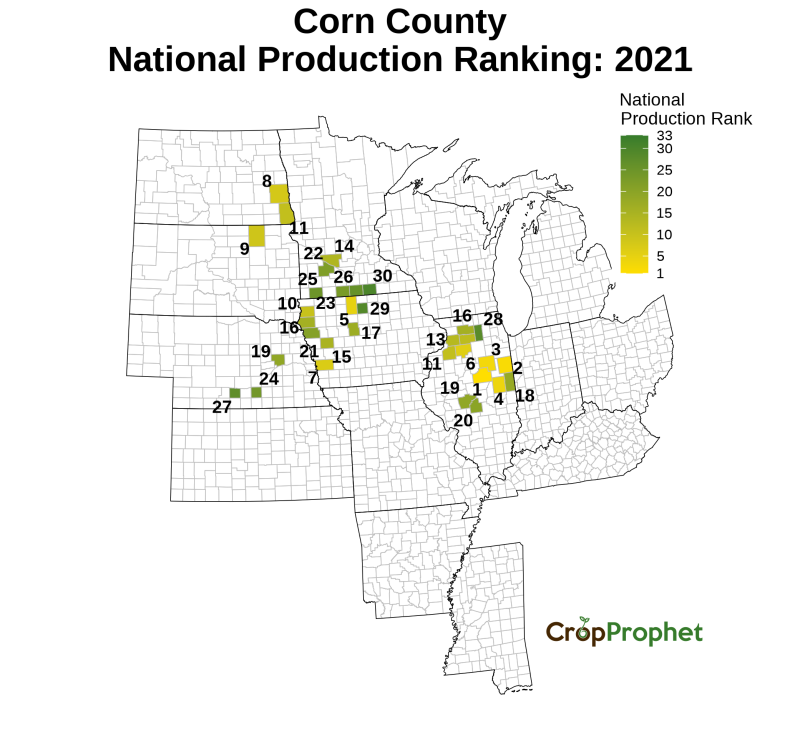
Corn Production by County: Top 33 of 2021
The top 33 corn-producing counties (and their total production) of 2021 was:
| County Production Rankings: 2021 | ||
| Rank | County, State | Production (M bu) |
|---|---|---|
| 1 | McLean, IL | 64.4 |
| 2 | Iroquois, IL | 61.0 |
| 3 | Livingston, IL | 59.7 |
| 4 | Champaign, IL | 58.3 |
| 5 | Kossuth, IA | 57.1 |
| 6 | Bureau, IL | 50.5 |
| 7 | Pottawattamie, IA | 50.0 |
| 8 | Cass, ND | 49.2 |
| 9 | Brown, SD | 47.4 |
| 10 | Sioux, IA | 46.7 |
| 11 | Richland, ND | 45.5 |
| 11 | Henry, IL | 45.5 |
| 12 | Lee, IL | 44.7 |
| 13 | Whiteside, IL | 43.3 |
| 14 | Renville, MN | 43.2 |
| 15 | Crawford, IA | 42.3 |
| 16 | Plymouth, IA | 41.9 |
| 16 | Ogle, IL | 41.9 |
| 17 | Webster, IA | 41.8 |
| 18 | Vermilion, IL | 41.4 |
| 19 | Platte, NE | 41.2 |
| 19 | Sangamon, IL | 41.2 |
| 20 | Christian, IL | 41.1 |
| 21 | Redwood, MN | 40.6 |
| 22 | Woodbury, IA | 40.5 |
| 23 | Martin, MN | 39.9 |
| 24 | Faribault, MN | 39.5 |
| 25 | Adams, NE | 39.4 |
| 26 | Nobles, MN | 39.3 |
| 27 | Phelps, NE | 38.7 |
| 28 | Yuma, CO | 38.6 |
| 29 | De Kalb, IL | 38.5 |
| 30 | Freeborn, MN | 38.4 |
County Corn Production – 2021
County Corn County National Production Ranking – 2021
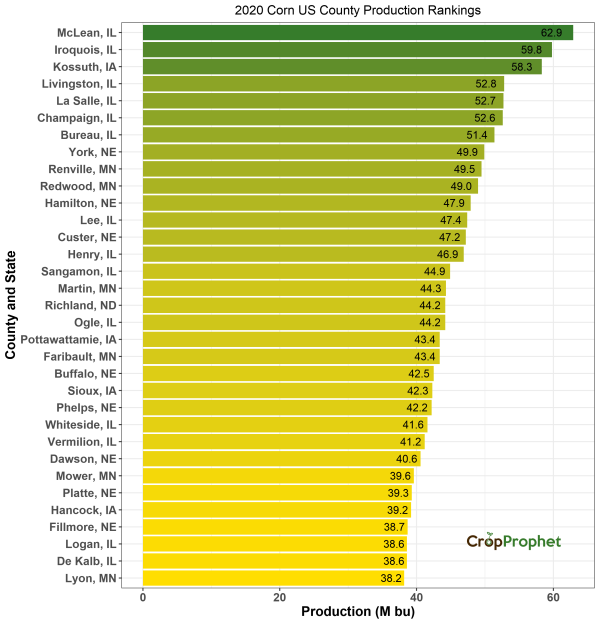
Corn Production by County: Top 33 of 2020
The top 33 corn-producing counties (and their total production) of 2020 was:
| County Production Rankings: 2020 | ||
| Rank | County, State | Production (M bu) |
|---|---|---|
| 1 | McLean, IL | 62.9 |
| 2 | Iroquois, IL | 59.8 |
| 3 | Kossuth, IA | 58.3 |
| 4 | Livingston, IL | 52.8 |
| 5 | La Salle, IL | 52.7 |
| 6 | Champaign, IL | 52.6 |
| 7 | Bureau, IL | 51.4 |
| 8 | York, NE | 49.9 |
| 9 | Renville, MN | 49.5 |
| 10 | Redwood, MN | 49.0 |
| 11 | Hamilton, NE | 47.9 |
| 12 | Lee, IL | 47.4 |
| 13 | Custer, NE | 47.2 |
| 14 | Henry, IL | 46.9 |
| 15 | Sangamon, IL | 44.9 |
| 16 | Martin, MN | 44.3 |
| 17 | Ogle, IL | 44.2 |
| 17 | Richland, ND | 44.2 |
| 18 | Faribault, MN | 43.4 |
| 18 | Pottawattamie, IA | 43.4 |
| 19 | Buffalo, NE | 42.5 |
| 20 | Sioux, IA | 42.3 |
| 21 | Phelps, NE | 42.2 |
| 22 | Whiteside, IL | 41.6 |
| 23 | Vermilion, IL | 41.2 |
| 24 | Dawson, NE | 40.6 |
| 25 | Mower, MN | 39.6 |
| 26 | Platte, NE | 39.3 |
| 27 | Hancock, IA | 39.2 |
| 28 | Fillmore, NE | 38.7 |
| 29 | De Kalb, IL | 38.6 |
| 29 | Logan, IL | 38.6 |
| 30 | Lyon, MN | 38.2 |
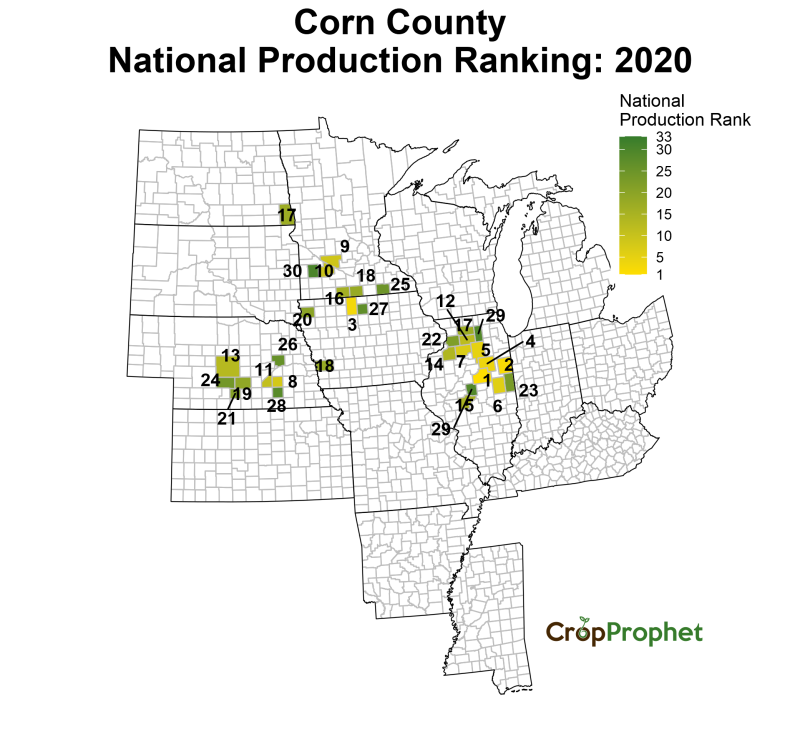
County Corn Production – 2020
County Corn County National Production Ranking – 2020
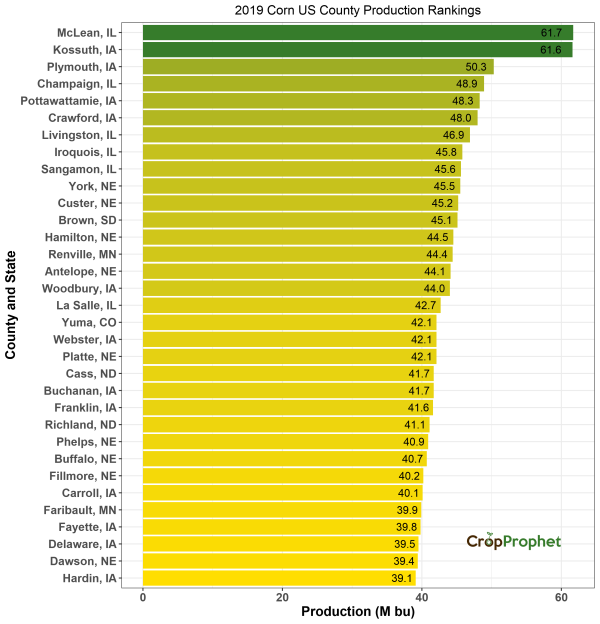
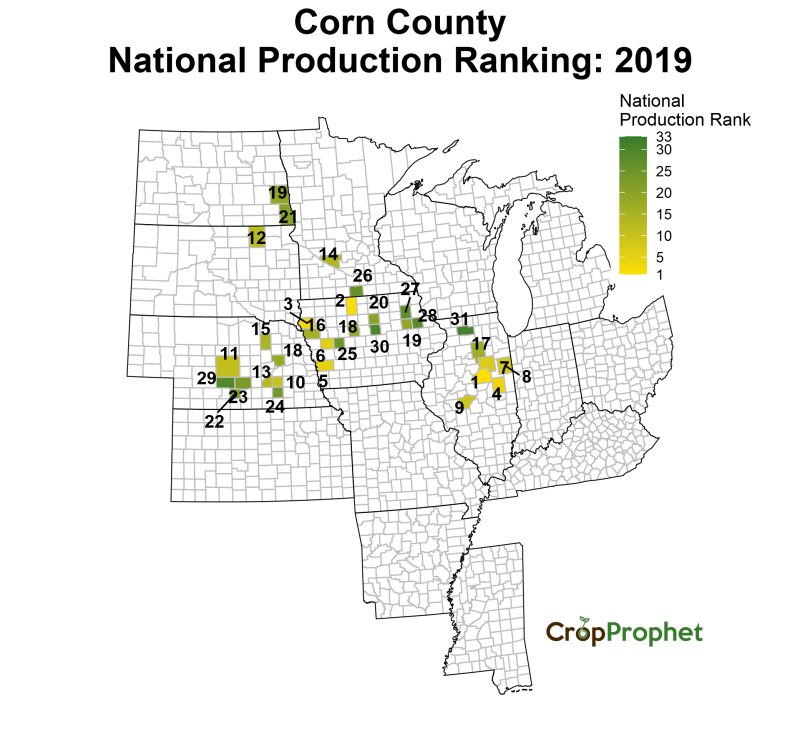
Corn Production by County: Top 33 of 2019
The top 33 corn-producing counties (and their total production) of 2019 was:
| County Production Rankings: 2019 | ||
| Rank | County, State | Production (M bu) |
|---|---|---|
| 1 | McLean, IL | 61.7 |
| 2 | Kossuth, IA | 61.6 |
| 3 | Plymouth, IA | 50.3 |
| 4 | Champaign, IL | 48.9 |
| 5 | Pottawattamie, IA | 48.3 |
| 6 | Crawford, IA | 48.0 |
| 7 | Livingston, IL | 46.9 |
| 8 | Iroquois, IL | 45.8 |
| 9 | Sangamon, IL | 45.6 |
| 10 | York, NE | 45.5 |
| 11 | Custer, NE | 45.2 |
| 12 | Brown, SD | 45.1 |
| 13 | Hamilton, NE | 44.5 |
| 14 | Renville, MN | 44.4 |
| 15 | Antelope, NE | 44.1 |
| 16 | Woodbury, IA | 44.0 |
| 17 | La Salle, IL | 42.7 |
| 18 | Yuma, CO | 42.1 |
| 18 | Webster, IA | 42.1 |
| 18 | Platte, NE | 42.1 |
| 19 | Cass, ND | 41.7 |
| 19 | Buchanan, IA | 41.7 |
| 20 | Franklin, IA | 41.6 |
| 21 | Richland, ND | 41.1 |
| 22 | Phelps, NE | 40.9 |
| 23 | Buffalo, NE | 40.7 |
| 24 | Fillmore, NE | 40.2 |
| 25 | Carroll, IA | 40.1 |
| 26 | Faribault, MN | 39.9 |
| 27 | Fayette, IA | 39.8 |
| 28 | Delaware, IA | 39.5 |
| 29 | Dawson, NE | 39.4 |
| 30 | Hardin, IA | 39.1 |
County Corn Production – 2019
County Corn County National Production Ranking – 2019
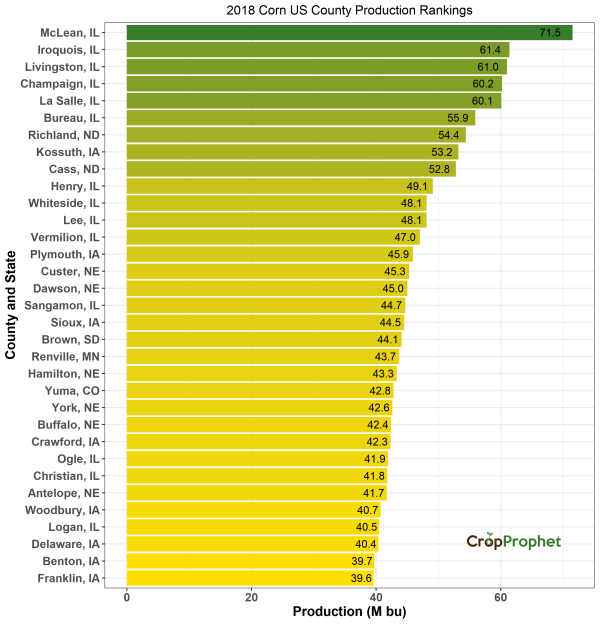
Corn Production by County: Top 33 of 2018
The top 33 corn-producing counties (and their total production) of 2018 was:
| County Production Rankings: 2018 | ||
| Rank | County, State | Production (M bu) |
|---|---|---|
| 1 | McLean, IL | 71.5 |
| 2 | Iroquois, IL | 61.4 |
| 3 | Livingston, IL | 61.0 |
| 4 | Champaign, IL | 60.2 |
| 5 | La Salle, IL | 60.1 |
| 6 | Bureau, IL | 55.9 |
| 7 | Richland, ND | 54.4 |
| 8 | Kossuth, IA | 53.2 |
| 9 | Cass, ND | 52.8 |
| 10 | Henry, IL | 49.1 |
| 11 | Whiteside, IL | 48.1 |
| 11 | Lee, IL | 48.1 |
| 12 | Vermilion, IL | 47.0 |
| 13 | Plymouth, IA | 45.9 |
| 14 | Custer, NE | 45.3 |
| 15 | Dawson, NE | 45.0 |
| 16 | Sangamon, IL | 44.7 |
| 17 | Sioux, IA | 44.5 |
| 18 | Brown, SD | 44.1 |
| 19 | Renville, MN | 43.7 |
| 20 | Hamilton, NE | 43.3 |
| 21 | Yuma, CO | 42.8 |
| 22 | York, NE | 42.6 |
| 23 | Buffalo, NE | 42.4 |
| 24 | Crawford, IA | 42.3 |
| 25 | Ogle, IL | 41.9 |
| 26 | Christian, IL | 41.8 |
| 27 | Antelope, NE | 41.7 |
| 28 | Woodbury, IA | 40.7 |
| 29 | Logan, IL | 40.5 |
| 30 | Delaware, IA | 40.4 |
| 31 | Benton, IA | 39.7 |
| 32 | Franklin, IA | 39.6 |
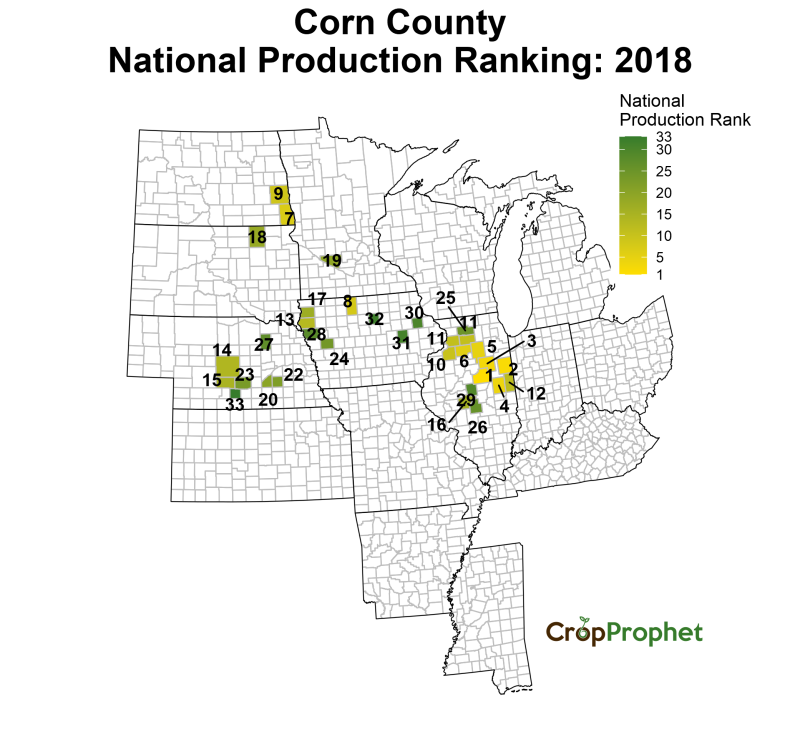
County Corn Production – 2018
County Corn County National Production Ranking – 2018
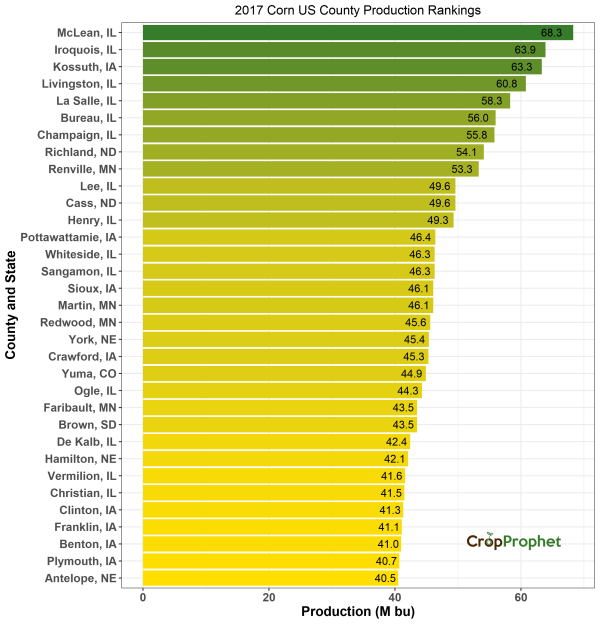
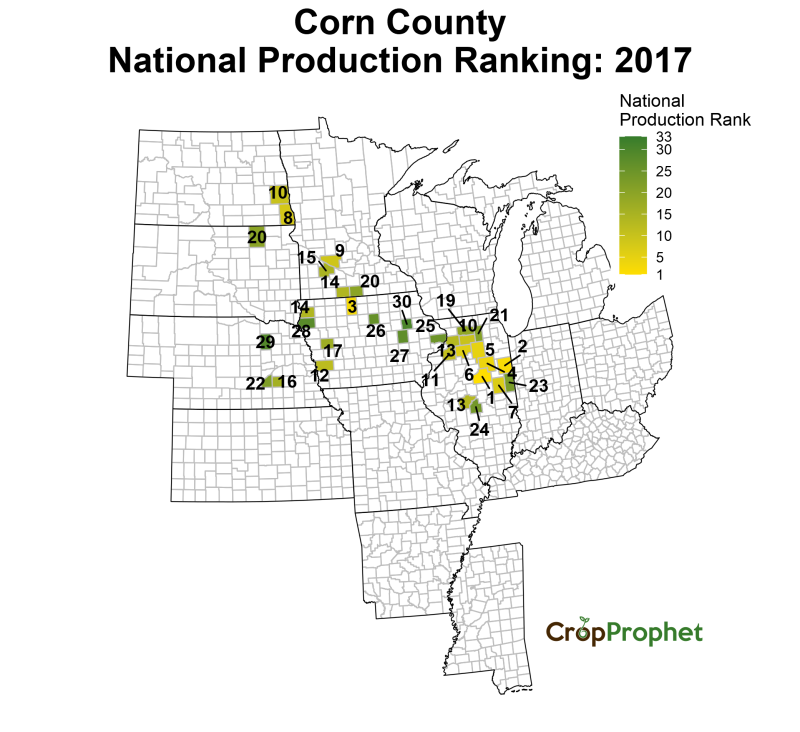
Corn Production by County: Top 33 of 2017
The top 33 corn-producing counties (and their total production) of 2017 was:
| County Production Rankings: 2017 | ||
| Rank | County, State | Production (M bu) |
|---|---|---|
| 1 | McLean, IL | 68.3 |
| 2 | Iroquois, IL | 63.9 |
| 3 | Kossuth, IA | 63.3 |
| 4 | Livingston, IL | 60.8 |
| 5 | La Salle, IL | 58.3 |
| 6 | Bureau, IL | 56.0 |
| 7 | Champaign, IL | 55.8 |
| 8 | Richland, ND | 54.1 |
| 9 | Renville, MN | 53.3 |
| 10 | Lee, IL | 49.6 |
| 10 | Cass, ND | 49.6 |
| 11 | Henry, IL | 49.3 |
| 12 | Pottawattamie, IA | 46.4 |
| 13 | Sangamon, IL | 46.3 |
| 13 | Whiteside, IL | 46.3 |
| 14 | Sioux, IA | 46.1 |
| 14 | Martin, MN | 46.1 |
| 15 | Redwood, MN | 45.6 |
| 16 | York, NE | 45.4 |
| 17 | Crawford, IA | 45.3 |
| 18 | Yuma, CO | 44.9 |
| 19 | Ogle, IL | 44.3 |
| 20 | Brown, SD | 43.5 |
| 20 | Faribault, MN | 43.5 |
| 21 | De Kalb, IL | 42.4 |
| 22 | Hamilton, NE | 42.1 |
| 23 | Vermilion, IL | 41.6 |
| 24 | Christian, IL | 41.5 |
| 25 | Clinton, IA | 41.3 |
| 26 | Franklin, IA | 41.1 |
| 27 | Benton, IA | 41.0 |
| 28 | Plymouth, IA | 40.7 |
| 29 | Antelope, NE | 40.5 |
County Corn Production – 2017
County Corn County National Production Ranking – 2017
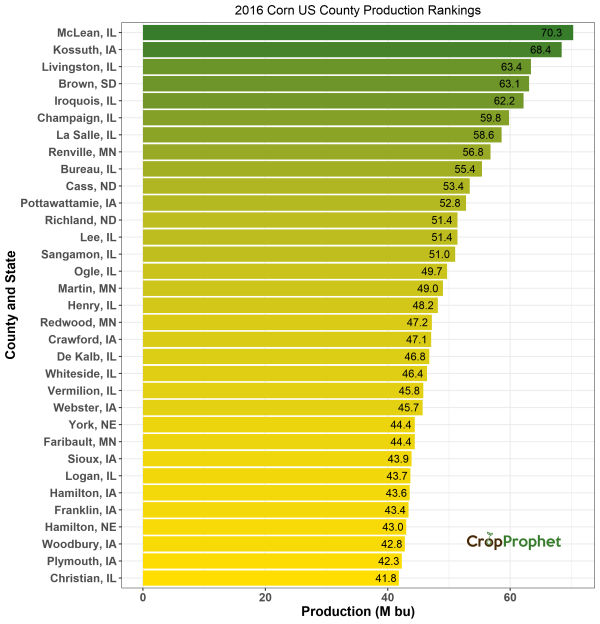
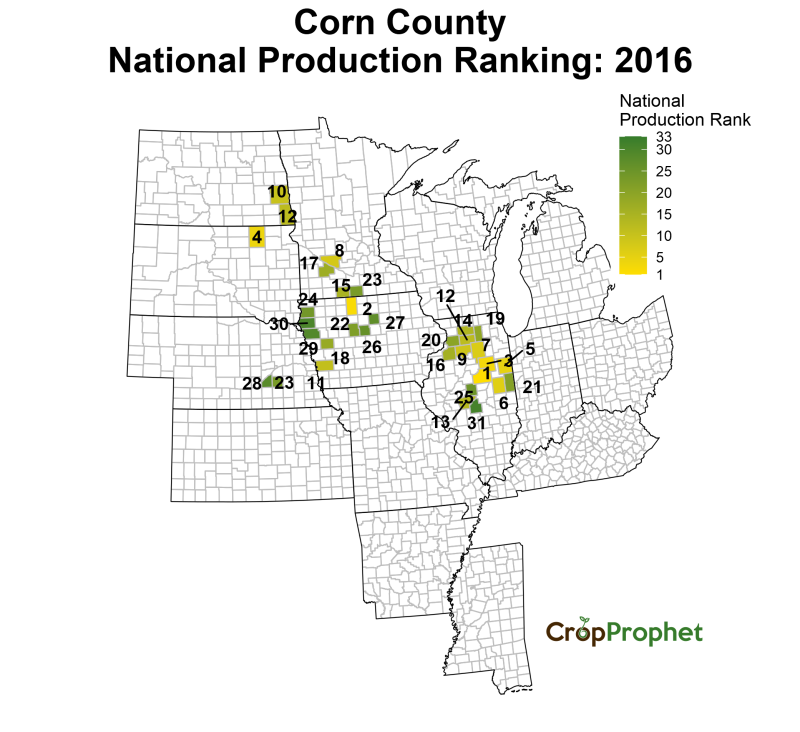
Corn Production by County: Top 33 of 2016
The top 33 corn-producing counties (and their total production) of 2016 was:
| County Production Rankings: 2016 | ||
| Rank | County, State | Production (M bu) |
|---|---|---|
| 1 | McLean, IL | 70.3 |
| 2 | Kossuth, IA | 68.4 |
| 3 | Livingston, IL | 63.4 |
| 4 | Brown, SD | 63.1 |
| 5 | Iroquois, IL | 62.2 |
| 6 | Champaign, IL | 59.8 |
| 7 | La Salle, IL | 58.6 |
| 8 | Renville, MN | 56.8 |
| 9 | Bureau, IL | 55.4 |
| 10 | Cass, ND | 53.4 |
| 11 | Pottawattamie, IA | 52.8 |
| 12 | Lee, IL | 51.4 |
| 12 | Richland, ND | 51.4 |
| 13 | Sangamon, IL | 51.0 |
| 14 | Ogle, IL | 49.7 |
| 15 | Martin, MN | 49.0 |
| 16 | Henry, IL | 48.2 |
| 17 | Redwood, MN | 47.2 |
| 18 | Crawford, IA | 47.1 |
| 19 | De Kalb, IL | 46.8 |
| 20 | Whiteside, IL | 46.4 |
| 21 | Vermilion, IL | 45.8 |
| 22 | Webster, IA | 45.7 |
| 23 | York, NE | 44.4 |
| 23 | Faribault, MN | 44.4 |
| 24 | Sioux, IA | 43.9 |
| 25 | Logan, IL | 43.7 |
| 26 | Hamilton, IA | 43.6 |
| 27 | Franklin, IA | 43.4 |
| 28 | Hamilton, NE | 43.0 |
| 29 | Woodbury, IA | 42.8 |
| 30 | Plymouth, IA | 42.3 |
| 31 | Christian, IL | 41.8 |
County Corn Production – 2016
County Corn County National Production Ranking – 2016
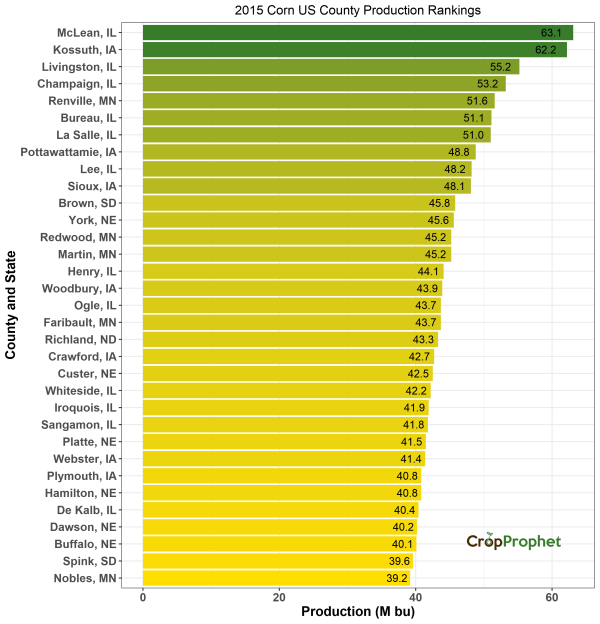
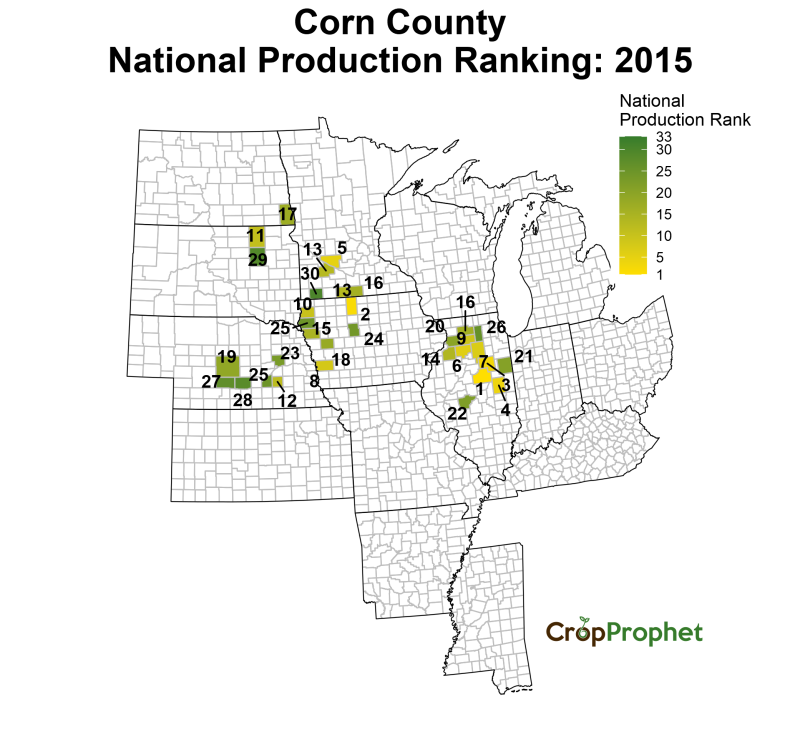
Corn Production by County: Top 33 of 2015
The top 33 corn-producing counties (and their total production) of 2015 was:
| County Production Rankings: 2015 | ||
| Rank | County, State | Production (M bu) |
|---|---|---|
| 1 | McLean, IL | 63.1 |
| 2 | Kossuth, IA | 62.2 |
| 3 | Livingston, IL | 55.2 |
| 4 | Champaign, IL | 53.2 |
| 5 | Renville, MN | 51.6 |
| 6 | Bureau, IL | 51.1 |
| 7 | La Salle, IL | 51.0 |
| 8 | Pottawattamie, IA | 48.8 |
| 9 | Lee, IL | 48.2 |
| 10 | Sioux, IA | 48.1 |
| 11 | Brown, SD | 45.8 |
| 12 | York, NE | 45.6 |
| 13 | Redwood, MN | 45.2 |
| 13 | Martin, MN | 45.2 |
| 14 | Henry, IL | 44.1 |
| 15 | Woodbury, IA | 43.9 |
| 16 | Ogle, IL | 43.7 |
| 16 | Faribault, MN | 43.7 |
| 17 | Richland, ND | 43.3 |
| 18 | Crawford, IA | 42.7 |
| 19 | Custer, NE | 42.5 |
| 20 | Whiteside, IL | 42.2 |
| 21 | Iroquois, IL | 41.9 |
| 22 | Sangamon, IL | 41.8 |
| 23 | Platte, NE | 41.5 |
| 24 | Webster, IA | 41.4 |
| 25 | Hamilton, NE | 40.8 |
| 25 | Plymouth, IA | 40.8 |
| 26 | De Kalb, IL | 40.4 |
| 27 | Dawson, NE | 40.2 |
| 28 | Buffalo, NE | 40.1 |
| 29 | Spink, SD | 39.6 |
| 30 | Nobles, MN | 39.2 |
County Corn Production – 2015
County Corn County National Production Ranking – 2015
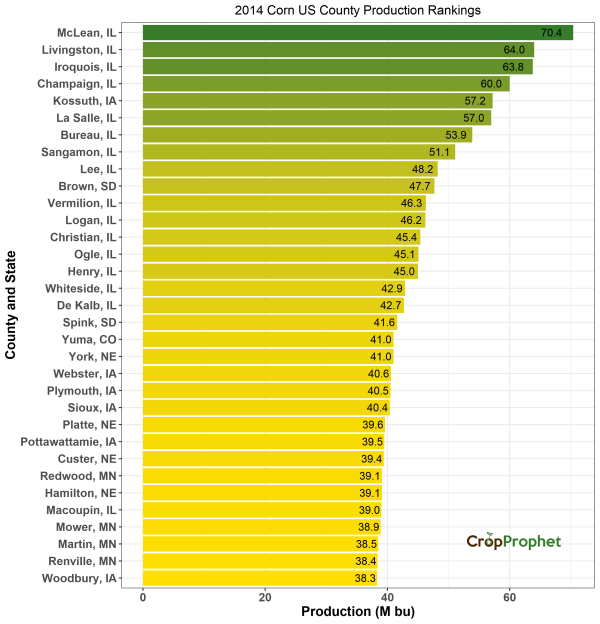
Corn Production by County: Top 33 of 2014
The top 33 corn-producing counties (and their total production) of 2014 was:
| County Production Rankings: 2014 | ||
| Rank | County, State | Production (M bu) |
|---|---|---|
| 1 | McLean, IL | 70.4 |
| 2 | Livingston, IL | 64.0 |
| 3 | Iroquois, IL | 63.8 |
| 4 | Champaign, IL | 60.0 |
| 5 | Kossuth, IA | 57.2 |
| 6 | La Salle, IL | 57.0 |
| 7 | Bureau, IL | 53.9 |
| 8 | Sangamon, IL | 51.1 |
| 9 | Lee, IL | 48.2 |
| 10 | Brown, SD | 47.7 |
| 11 | Vermilion, IL | 46.3 |
| 12 | Logan, IL | 46.2 |
| 13 | Christian, IL | 45.4 |
| 14 | Ogle, IL | 45.1 |
| 15 | Henry, IL | 45.0 |
| 16 | Whiteside, IL | 42.9 |
| 17 | De Kalb, IL | 42.7 |
| 18 | Spink, SD | 41.6 |
| 19 | Yuma, CO | 41.0 |
| 19 | York, NE | 41.0 |
| 20 | Webster, IA | 40.6 |
| 21 | Plymouth, IA | 40.5 |
| 22 | Sioux, IA | 40.4 |
| 23 | Platte, NE | 39.6 |
| 24 | Pottawattamie, IA | 39.5 |
| 25 | Custer, NE | 39.4 |
| 26 | Hamilton, NE | 39.1 |
| 26 | Redwood, MN | 39.1 |
| 27 | Macoupin, IL | 39.0 |
| 28 | Mower, MN | 38.9 |
| 29 | Martin, MN | 38.5 |
| 30 | Renville, MN | 38.4 |
| 31 | Woodbury, IA | 38.3 |
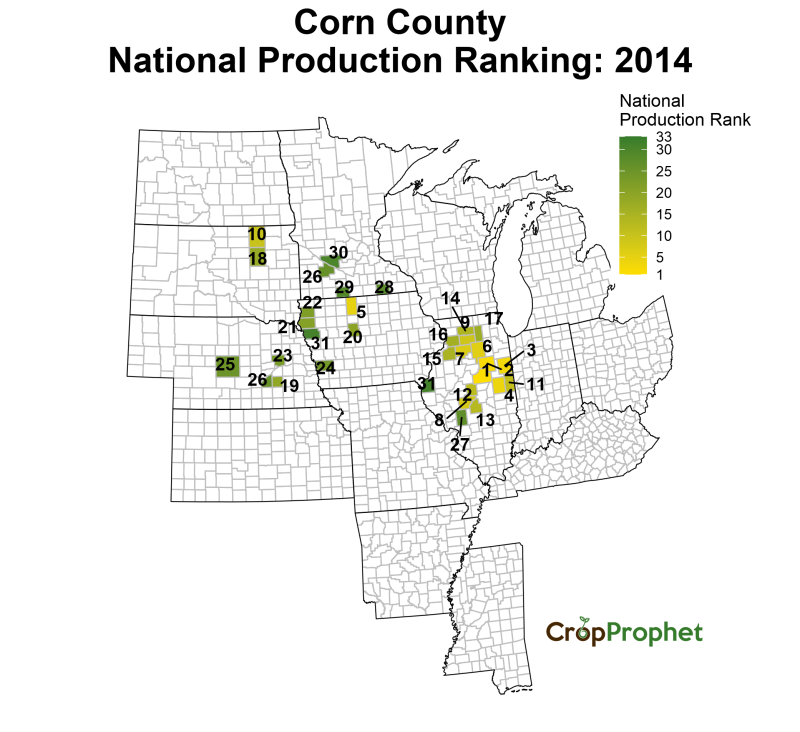
County Corn Production – 2014
County Corn County National Production Ranking – 2014
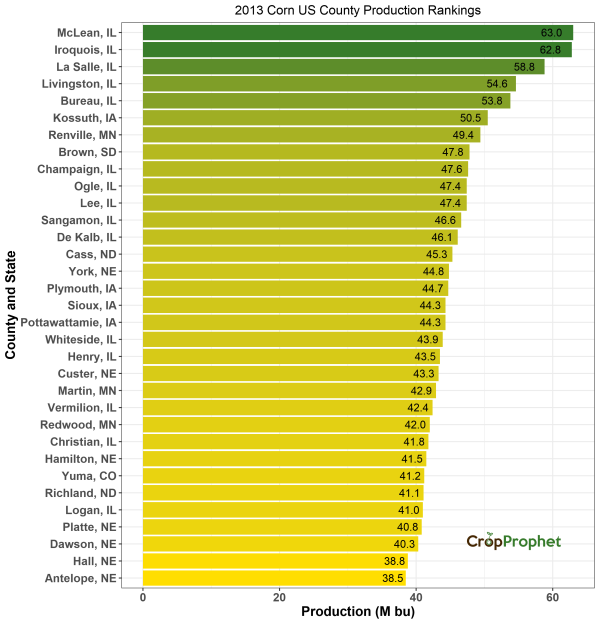
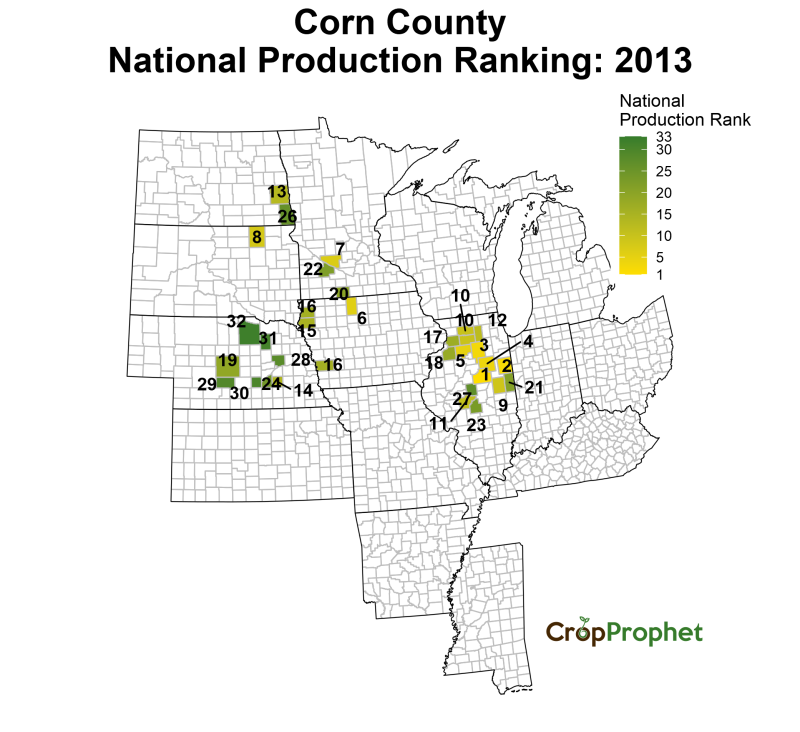
Corn Production by County: Top 33 of 2013
The top 33 corn-producing counties (and their total production) of 2013 was:
| County Production Rankings: 2013 | ||
| Rank | County, State | Production (M bu) |
|---|---|---|
| 1 | McLean, IL | 63.0 |
| 2 | Iroquois, IL | 62.8 |
| 3 | La Salle, IL | 58.8 |
| 4 | Livingston, IL | 54.6 |
| 5 | Bureau, IL | 53.8 |
| 6 | Kossuth, IA | 50.5 |
| 7 | Renville, MN | 49.4 |
| 8 | Brown, SD | 47.8 |
| 9 | Champaign, IL | 47.6 |
| 10 | Ogle, IL | 47.4 |
| 10 | Lee, IL | 47.4 |
| 11 | Sangamon, IL | 46.6 |
| 12 | De Kalb, IL | 46.1 |
| 13 | Cass, ND | 45.3 |
| 14 | York, NE | 44.8 |
| 15 | Plymouth, IA | 44.7 |
| 16 | Pottawattamie, IA | 44.3 |
| 16 | Sioux, IA | 44.3 |
| 17 | Whiteside, IL | 43.9 |
| 18 | Henry, IL | 43.5 |
| 19 | Custer, NE | 43.3 |
| 20 | Martin, MN | 42.9 |
| 21 | Vermilion, IL | 42.4 |
| 22 | Redwood, MN | 42.0 |
| 23 | Christian, IL | 41.8 |
| 24 | Hamilton, NE | 41.5 |
| 25 | Yuma, CO | 41.2 |
| 26 | Richland, ND | 41.1 |
| 27 | Logan, IL | 41.0 |
| 28 | Platte, NE | 40.8 |
| 29 | Dawson, NE | 40.3 |
| 30 | Hall, NE | 38.8 |
| 31 | Antelope, NE | 38.5 |
County Corn Production – 2013
County Corn County National Production Ranking – 2013
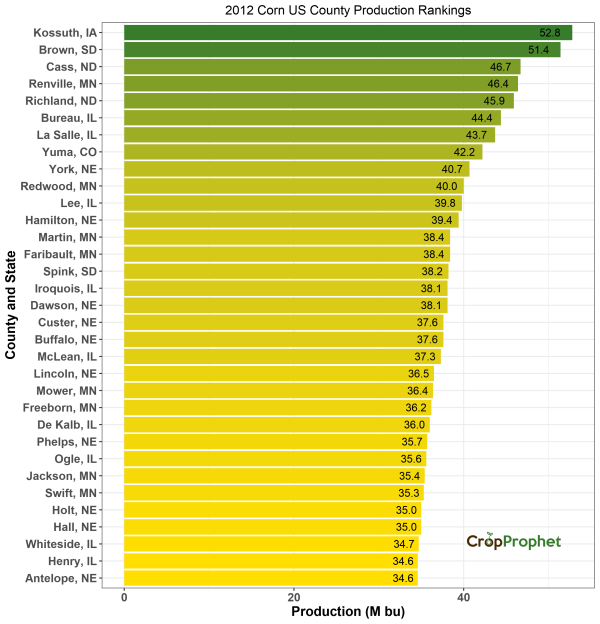
Corn Production by County: Top 33 of 2012
The top 33 corn-producing counties (and their total production) of 2012 was:
| County Production Rankings: 2012 | ||
| Rank | County, State | Production (M bu) |
|---|---|---|
| 1 | Kossuth, IA | 52.8 |
| 2 | Brown, SD | 51.4 |
| 3 | Cass, ND | 46.7 |
| 4 | Renville, MN | 46.4 |
| 5 | Richland, ND | 45.9 |
| 6 | Bureau, IL | 44.4 |
| 7 | La Salle, IL | 43.7 |
| 8 | Yuma, CO | 42.2 |
| 9 | York, NE | 40.7 |
| 10 | Redwood, MN | 40.0 |
| 11 | Lee, IL | 39.8 |
| 12 | Hamilton, NE | 39.4 |
| 13 | Martin, MN | 38.4 |
| 13 | Faribault, MN | 38.4 |
| 14 | Spink, SD | 38.2 |
| 15 | Iroquois, IL | 38.1 |
| 15 | Dawson, NE | 38.1 |
| 16 | Buffalo, NE | 37.6 |
| 16 | Custer, NE | 37.6 |
| 17 | McLean, IL | 37.3 |
| 18 | Lincoln, NE | 36.5 |
| 19 | Mower, MN | 36.4 |
| 20 | Freeborn, MN | 36.2 |
| 21 | De Kalb, IL | 36.0 |
| 22 | Phelps, NE | 35.7 |
| 23 | Ogle, IL | 35.6 |
| 24 | Jackson, MN | 35.4 |
| 25 | Swift, MN | 35.3 |
| 26 | Holt, NE | 35.0 |
| 26 | Hall, NE | 35.0 |
| 27 | Whiteside, IL | 34.7 |
| 28 | Henry, IL | 34.6 |
| 28 | Antelope, NE | 34.6 |
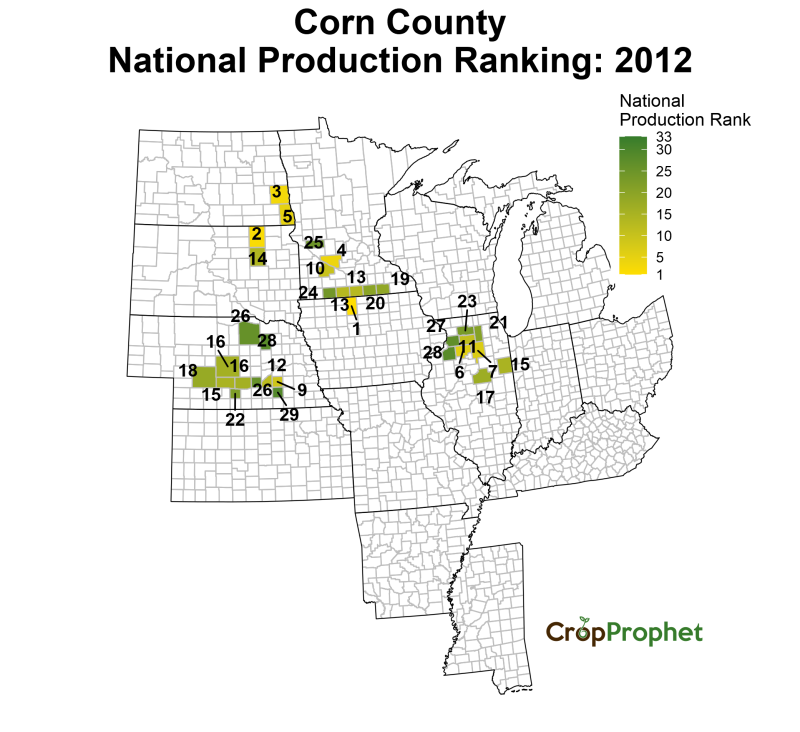
County Corn Production – 2012
County Corn County National Production Ranking – 2012
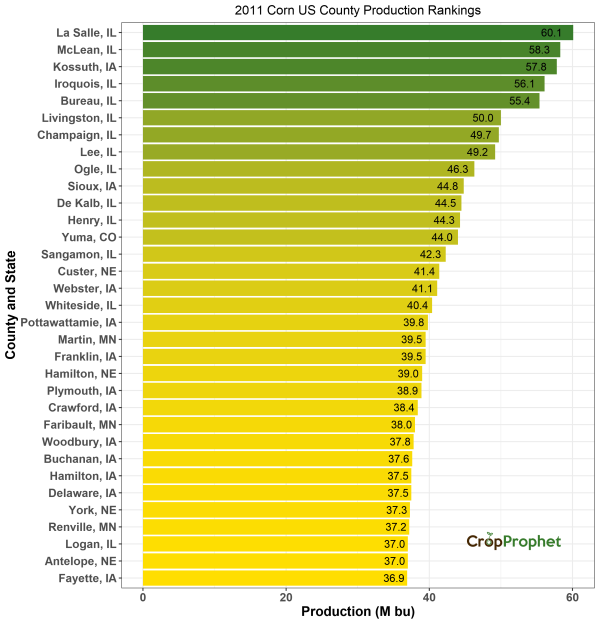
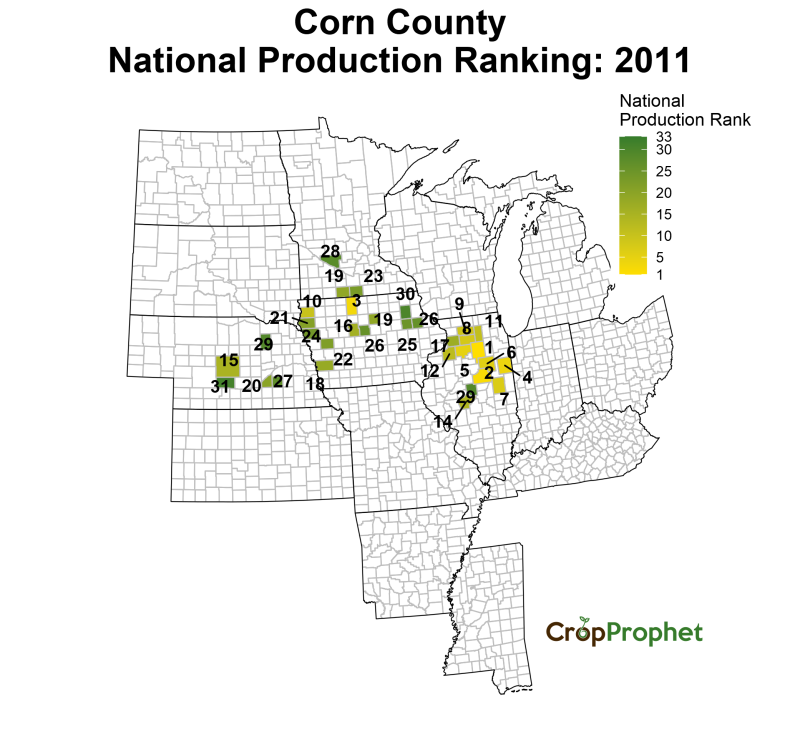
Corn Production by County: Top 33 of 2011
The top 33 corn-producing counties (and their total production) of 2011 was:
| County Production Rankings: 2011 | ||
| Rank | County, State | Production (M bu) |
|---|---|---|
| 1 | La Salle, IL | 60.1 |
| 2 | McLean, IL | 58.3 |
| 3 | Kossuth, IA | 57.8 |
| 4 | Iroquois, IL | 56.1 |
| 5 | Bureau, IL | 55.4 |
| 6 | Livingston, IL | 50.0 |
| 7 | Champaign, IL | 49.7 |
| 8 | Lee, IL | 49.2 |
| 9 | Ogle, IL | 46.3 |
| 10 | Sioux, IA | 44.8 |
| 11 | De Kalb, IL | 44.5 |
| 12 | Henry, IL | 44.3 |
| 13 | Yuma, CO | 44.0 |
| 14 | Sangamon, IL | 42.3 |
| 15 | Custer, NE | 41.4 |
| 16 | Webster, IA | 41.1 |
| 17 | Whiteside, IL | 40.4 |
| 18 | Pottawattamie, IA | 39.8 |
| 19 | Franklin, IA | 39.5 |
| 19 | Martin, MN | 39.5 |
| 20 | Hamilton, NE | 39.0 |
| 21 | Plymouth, IA | 38.9 |
| 22 | Crawford, IA | 38.4 |
| 23 | Faribault, MN | 38.0 |
| 24 | Woodbury, IA | 37.8 |
| 25 | Buchanan, IA | 37.6 |
| 26 | Delaware, IA | 37.5 |
| 26 | Hamilton, IA | 37.5 |
| 27 | York, NE | 37.3 |
| 28 | Renville, MN | 37.2 |
| 29 | Logan, IL | 37.0 |
| 29 | Antelope, NE | 37.0 |
| 30 | Fayette, IA | 36.9 |
County Corn Production – 2011
County Corn County National Production Ranking – 2011
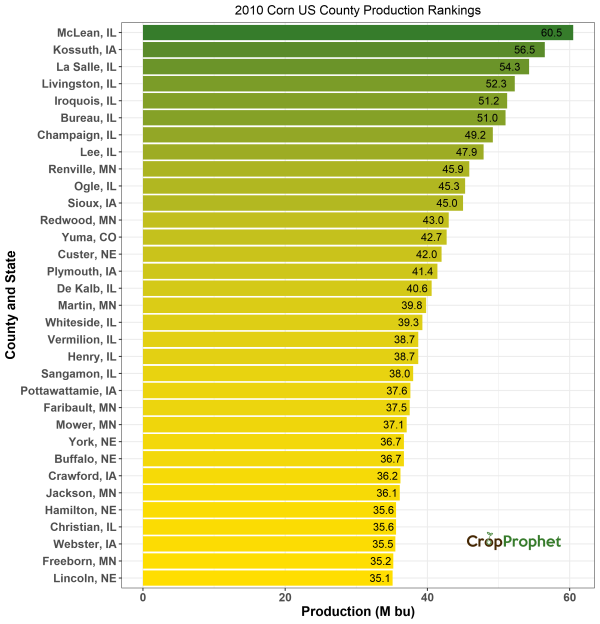
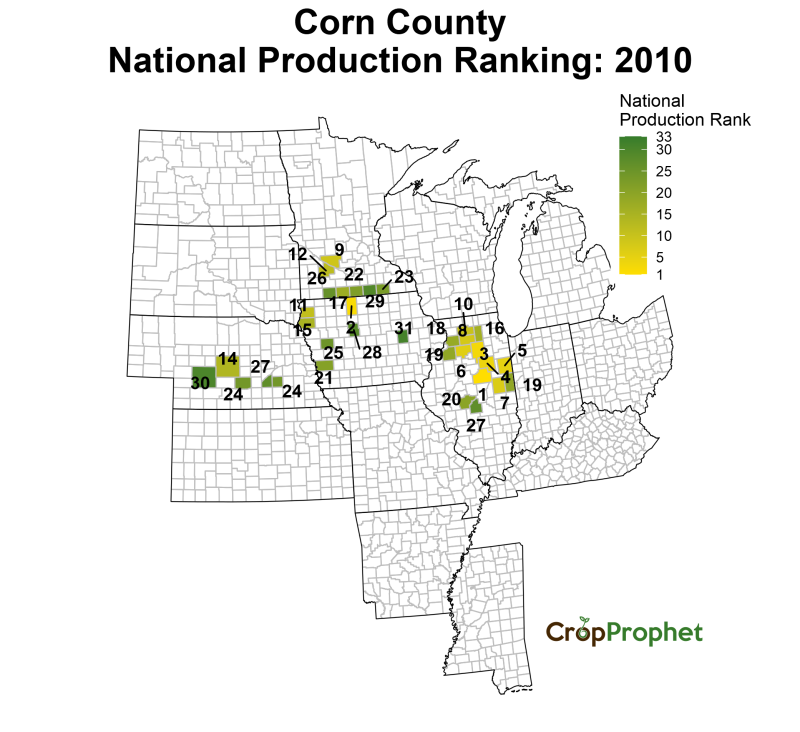
Corn Production by County: Top 33 of 2010
The top 33 corn-producing counties (and their total production) of 2010 was:
| County Production Rankings: 2010 | ||
| Rank | County, State | Production (M bu) |
|---|---|---|
| 1 | McLean, IL | 60.5 |
| 2 | Kossuth, IA | 56.5 |
| 3 | La Salle, IL | 54.3 |
| 4 | Livingston, IL | 52.3 |
| 5 | Iroquois, IL | 51.2 |
| 6 | Bureau, IL | 51.0 |
| 7 | Champaign, IL | 49.2 |
| 8 | Lee, IL | 47.9 |
| 9 | Renville, MN | 45.9 |
| 10 | Ogle, IL | 45.3 |
| 11 | Sioux, IA | 45.0 |
| 12 | Redwood, MN | 43.0 |
| 13 | Yuma, CO | 42.7 |
| 14 | Custer, NE | 42.0 |
| 15 | Plymouth, IA | 41.4 |
| 16 | De Kalb, IL | 40.6 |
| 17 | Martin, MN | 39.8 |
| 18 | Whiteside, IL | 39.3 |
| 19 | Henry, IL | 38.7 |
| 19 | Vermilion, IL | 38.7 |
| 20 | Sangamon, IL | 38.0 |
| 21 | Pottawattamie, IA | 37.6 |
| 22 | Faribault, MN | 37.5 |
| 23 | Mower, MN | 37.1 |
| 24 | Buffalo, NE | 36.7 |
| 24 | York, NE | 36.7 |
| 25 | Crawford, IA | 36.2 |
| 26 | Jackson, MN | 36.1 |
| 27 | Christian, IL | 35.6 |
| 27 | Hamilton, NE | 35.6 |
| 28 | Webster, IA | 35.5 |
| 29 | Freeborn, MN | 35.2 |
| 30 | Lincoln, NE | 35.1 |
County Corn Production – 2010
County Corn County National Production Ranking – 2010
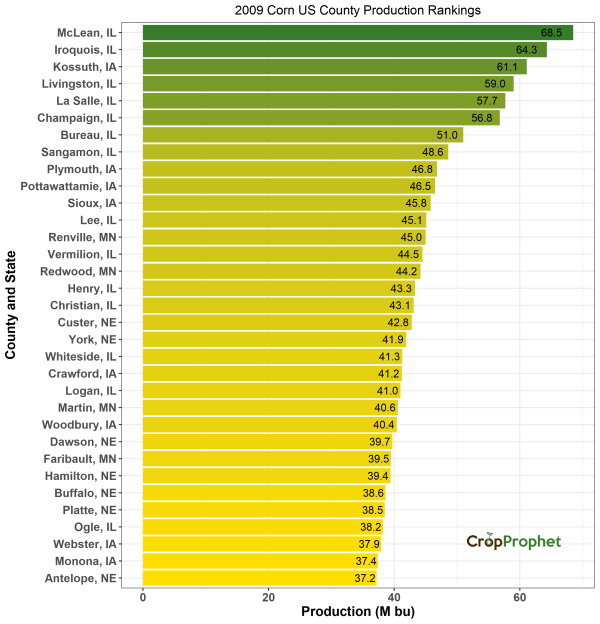
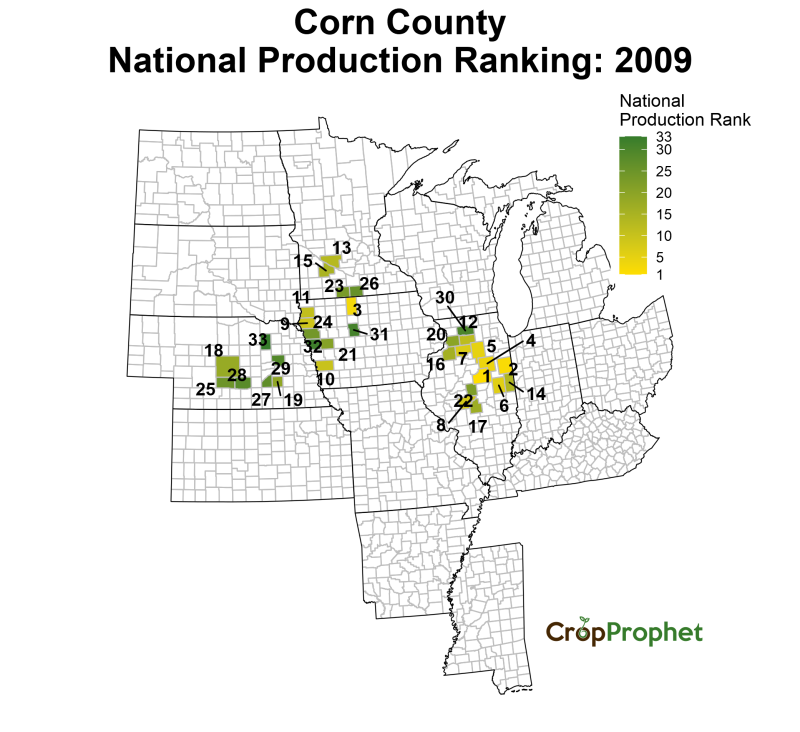
Corn Production by County: Top 33 of 2009
The top 33 corn-producing counties (and their total production) of 2009 was:
| County Production Rankings: 2009 | ||
| Rank | County, State | Production (M bu) |
|---|---|---|
| 1 | McLean, IL | 68.5 |
| 2 | Iroquois, IL | 64.3 |
| 3 | Kossuth, IA | 61.1 |
| 4 | Livingston, IL | 59.0 |
| 5 | La Salle, IL | 57.7 |
| 6 | Champaign, IL | 56.8 |
| 7 | Bureau, IL | 51.0 |
| 8 | Sangamon, IL | 48.6 |
| 9 | Plymouth, IA | 46.8 |
| 10 | Pottawattamie, IA | 46.5 |
| 11 | Sioux, IA | 45.8 |
| 12 | Lee, IL | 45.1 |
| 13 | Renville, MN | 45.0 |
| 14 | Vermilion, IL | 44.5 |
| 15 | Redwood, MN | 44.2 |
| 16 | Henry, IL | 43.3 |
| 17 | Christian, IL | 43.1 |
| 18 | Custer, NE | 42.8 |
| 19 | York, NE | 41.9 |
| 20 | Whiteside, IL | 41.3 |
| 21 | Crawford, IA | 41.2 |
| 22 | Logan, IL | 41.0 |
| 23 | Martin, MN | 40.6 |
| 24 | Woodbury, IA | 40.4 |
| 25 | Dawson, NE | 39.7 |
| 26 | Faribault, MN | 39.5 |
| 27 | Hamilton, NE | 39.4 |
| 28 | Buffalo, NE | 38.6 |
| 29 | Platte, NE | 38.5 |
| 30 | Ogle, IL | 38.2 |
| 31 | Webster, IA | 37.9 |
| 32 | Monona, IA | 37.4 |
| 33 | Antelope, NE | 37.2 |
County Corn Production – 2009
County Corn County National Production Ranking – 2009
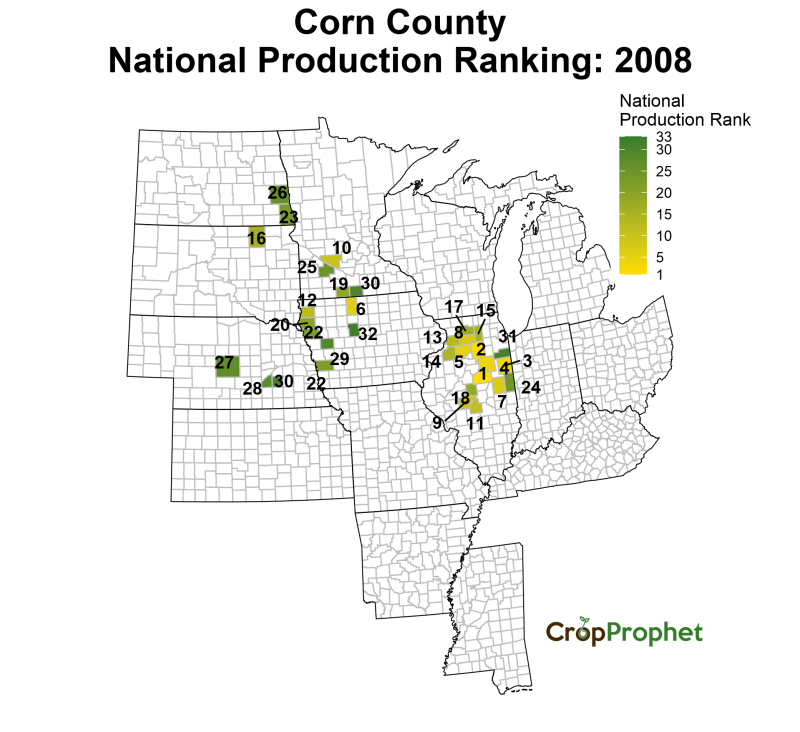
Corn Production by County: Top 33 of 2008
The top 33 corn-producing counties (and their total production) of 2008 was:
| County Production Rankings: 2008 | ||
| Rank | County, State | Production (M bu) |
|---|---|---|
| 1 | McLean, IL | 69.9 |
| 2 | La Salle, IL | 64.1 |
| 3 | Iroquois, IL | 62.1 |
| 4 | Livingston, IL | 60.0 |
| 5 | Bureau, IL | 59.2 |
| 6 | Kossuth, IA | 53.9 |
| 7 | Champaign, IL | 49.7 |
| 8 | Lee, IL | 49.6 |
| 9 | Sangamon, IL | 47.6 |
| 10 | Renville, MN | 46.9 |
| 11 | Christian, IL | 45.5 |
| 12 | Sioux, IA | 45.1 |
| 13 | Whiteside, IL | 44.4 |
| 14 | Henry, IL | 44.2 |
| 15 | De Kalb, IL | 43.8 |
| 16 | Brown, SD | 43.1 |
| 17 | Ogle, IL | 42.6 |
| 18 | Logan, IL | 42.1 |
| 19 | Martin, MN | 41.9 |
| 20 | Plymouth, IA | 41.4 |
| 21 | Yuma, CO | 40.7 |
| 22 | Pottawattamie, IA | 39.9 |
| 22 | Woodbury, IA | 39.9 |
| 23 | Richland, ND | 39.7 |
| 24 | Vermilion, IL | 39.5 |
| 25 | Redwood, MN | 39.1 |
| 26 | Cass, ND | 38.9 |
| 27 | Custer, NE | 38.7 |
| 28 | Hamilton, NE | 38.1 |
| 29 | Crawford, IA | 37.9 |
| 30 | Faribault, MN | 37.2 |
| 30 | York, NE | 37.2 |
| 31 | Kankakee, IL | 36.7 |
County Corn Production – 2008
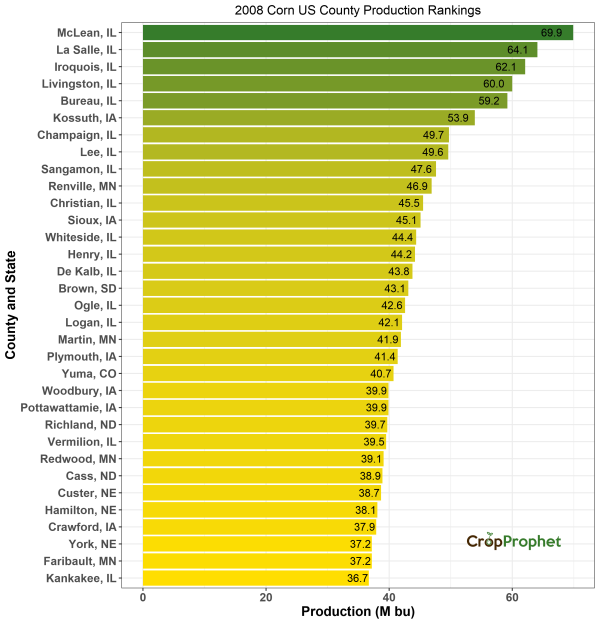
County Corn County National Production Ranking – 2008
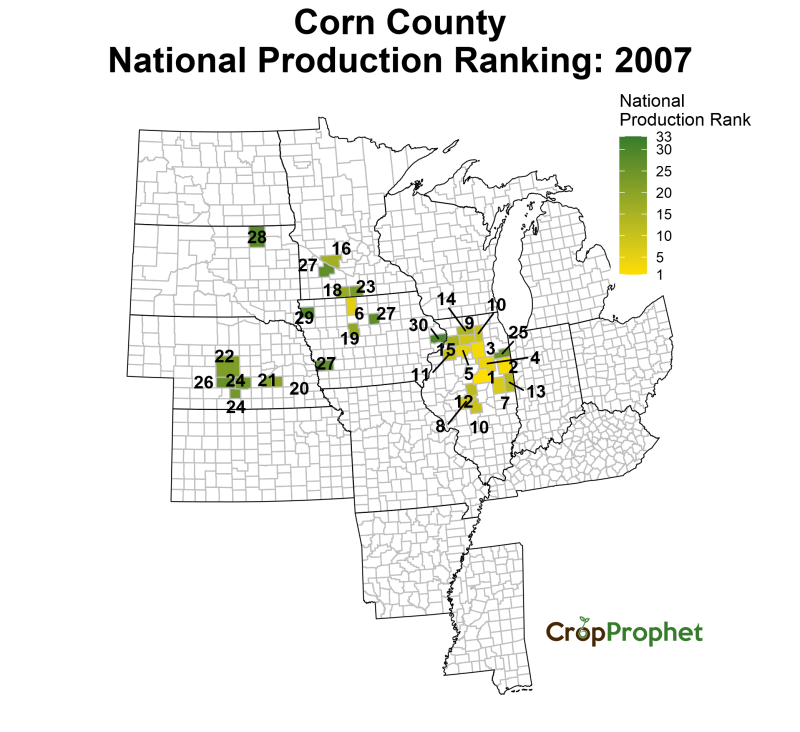
Corn Production by County: Top 33 of 2007
The top 33 corn-producing counties (and their total production) of 2007 was:
| County Production Rankings: 2007 | ||
| Rank | County, State | Production (M bu) |
|---|---|---|
| 1 | McLean, IL | 77.2 |
| 2 | Iroquois, IL | 68.0 |
| 3 | La Salle, IL | 64.2 |
| 4 | Livingston, IL | 64.1 |
| 5 | Bureau, IL | 60.2 |
| 6 | Kossuth, IA | 60.1 |
| 7 | Champaign, IL | 59.4 |
| 8 | Sangamon, IL | 53.8 |
| 9 | Lee, IL | 51.1 |
| 10 | Christian, IL | 48.6 |
| 10 | De Kalb, IL | 48.6 |
| 11 | Henry, IL | 48.0 |
| 12 | Logan, IL | 45.6 |
| 13 | Vermilion, IL | 45.5 |
| 14 | Ogle, IL | 45.4 |
| 15 | Whiteside, IL | 43.3 |
| 16 | Renville, MN | 43.2 |
| 17 | Yuma, CO | 42.5 |
| 18 | Martin, MN | 41.3 |
| 19 | Webster, IA | 40.4 |
| 20 | York, NE | 40.3 |
| 21 | Hamilton, NE | 40.1 |
| 22 | Custer, NE | 39.5 |
| 23 | Faribault, MN | 39.4 |
| 24 | Phelps, NE | 38.8 |
| 24 | Buffalo, NE | 38.8 |
| 25 | Kankakee, IL | 38.7 |
| 26 | Dawson, NE | 38.6 |
| 27 | Franklin, IA | 38.4 |
| 27 | Pottawattamie, IA | 38.4 |
| 27 | Redwood, MN | 38.4 |
| 28 | Brown, SD | 37.9 |
| 29 | Sioux, IA | 37.7 |
County Corn Production – 2007
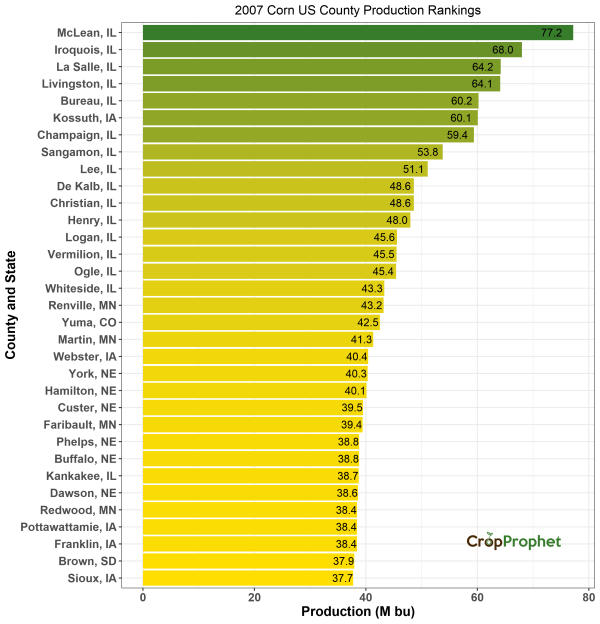
County Corn County National Production Ranking – 2007
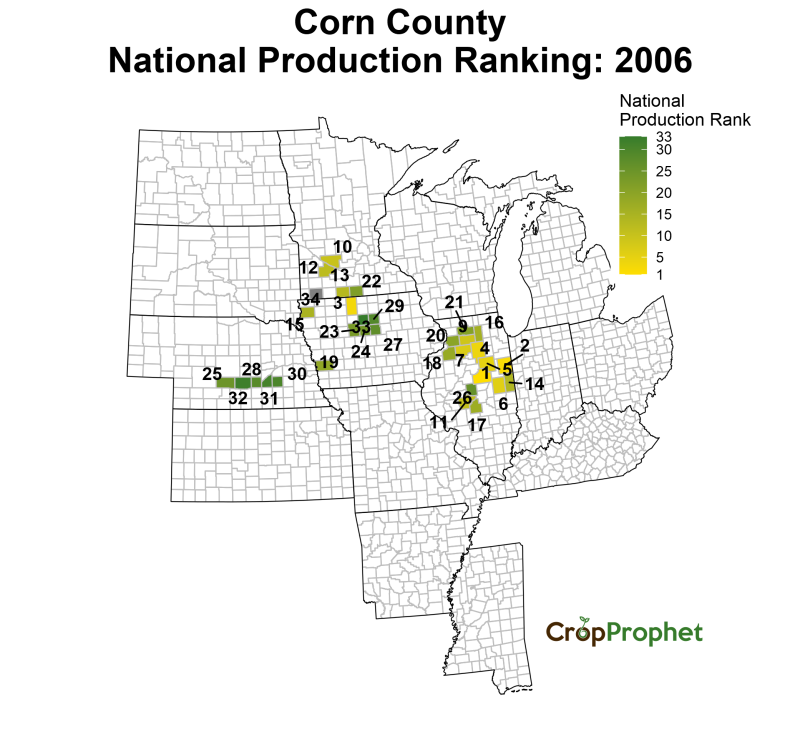
Corn Production by County: Top 33 of 2006
The top 33 corn-producing counties (and their total production) of 2006 was:
| County Production Rankings: 2006 | ||
| Rank | County, State | Production (M bu) |
|---|---|---|
| 1 | McLean, IL | 61.4 |
| 2 | Iroquois, IL | 55.0 |
| 3 | Kossuth, IA | 53.8 |
| 4 | La Salle, IL | 53.5 |
| 5 | Livingston, IL | 51.4 |
| 6 | Champaign, IL | 50.1 |
| 7 | Bureau, IL | 47.6 |
| 8 | Yuma, CO | 47.2 |
| 9 | Lee, IL | 46.4 |
| 10 | Renville, MN | 43.0 |
| 11 | Sangamon, IL | 41.5 |
| 12 | Redwood, MN | 41.3 |
| 13 | Martin, MN | 39.4 |
| 14 | Vermilion, IL | 39.0 |
| 15 | Sioux, IA | 38.2 |
| 16 | De Kalb, IL | 37.7 |
| 17 | Christian, IL | 37.4 |
| 18 | Henry, IL | 37.2 |
| 19 | Pottawattamie, IA | 37.1 |
| 20 | Whiteside, IL | 36.3 |
| 21 | Ogle, IL | 35.9 |
| 22 | Faribault, MN | 35.7 |
| 23 | Webster, IA | 34.1 |
| 24 | Hamilton, IA | 33.9 |
| 25 | Dawson, NE | 33.8 |
| 26 | Logan, IL | 33.6 |
| 27 | Hardin, IA | 33.5 |
| 28 | Hall, NE | 33.3 |
| 29 | Franklin, IA | 32.8 |
| 30 | York, NE | 32.5 |
| 31 | Hamilton, NE | 32.3 |
| 32 | Buffalo, NE | 32.1 |
| 33 | Wright, IA | 31.7 |
County Corn Production – 2006
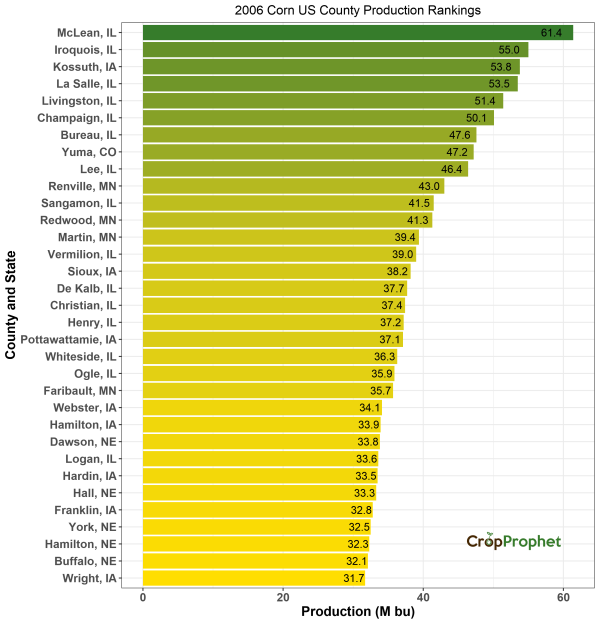
County Corn County National Production Ranking – 2006
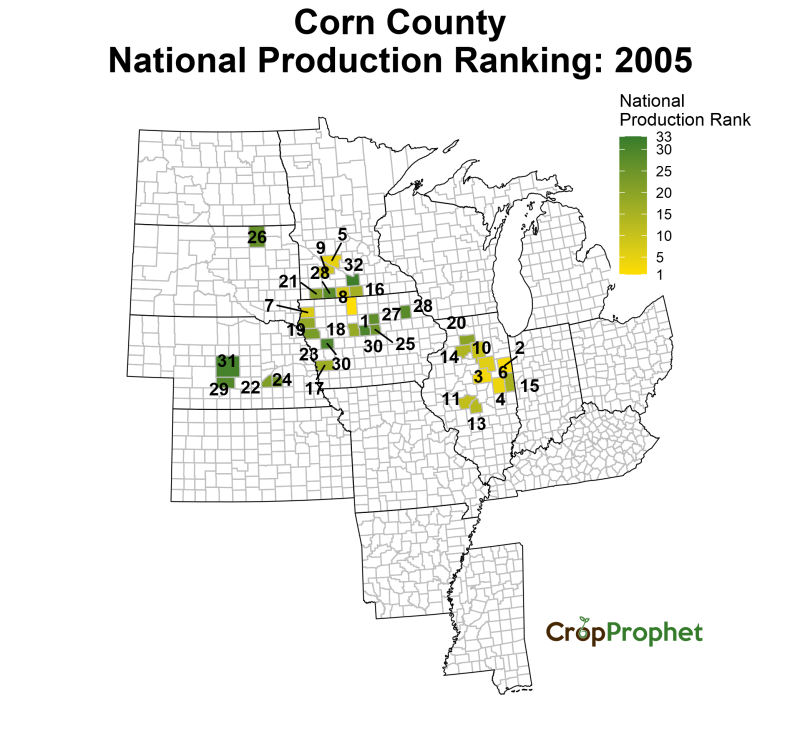
Corn Production by County: Top 33 of 2005
The top 33 corn-producing counties (and their total production) of 2005 was:
| County Production Rankings: 2005 | ||
| Rank | County, State | Production (M bu) |
|---|---|---|
| 1 | Kossuth, IA | 57.2 |
| 2 | Iroquois, IL | 57.1 |
| 3 | McLean, IL | 56.9 |
| 4 | Champaign, IL | 47.7 |
| 5 | Renville, MN | 46.8 |
| 6 | Livingston, IL | 44.6 |
| 7 | Sioux, IA | 43.7 |
| 8 | Martin, MN | 43.4 |
| 9 | Redwood, MN | 43.3 |
| 10 | La Salle, IL | 42.9 |
| 11 | Sangamon, IL | 41.1 |
| 12 | Yuma, CO | 40.2 |
| 13 | Christian, IL | 39.4 |
| 14 | Bureau, IL | 38.8 |
| 15 | Vermilion, IL | 38.7 |
| 16 | Faribault, MN | 38.1 |
| 17 | Pottawattamie, IA | 37.9 |
| 18 | Webster, IA | 37.7 |
| 19 | Plymouth, IA | 37.4 |
| 20 | Lee, IL | 36.4 |
| 21 | Nobles, MN | 36.2 |
| 22 | Hamilton, NE | 35.2 |
| 23 | Woodbury, IA | 35.0 |
| 24 | York, NE | 34.7 |
| 25 | Hardin, IA | 34.5 |
| 26 | Brown, SD | 34.4 |
| 27 | Franklin, IA | 34.3 |
| 28 | Jackson, MN | 33.6 |
| 28 | Fayette, IA | 33.6 |
| 29 | Dawson, NE | 33.5 |
| 30 | Crawford, IA | 33.3 |
| 30 | Hamilton, IA | 33.3 |
| 31 | Custer, NE | 33.2 |
County Corn Production – 2005
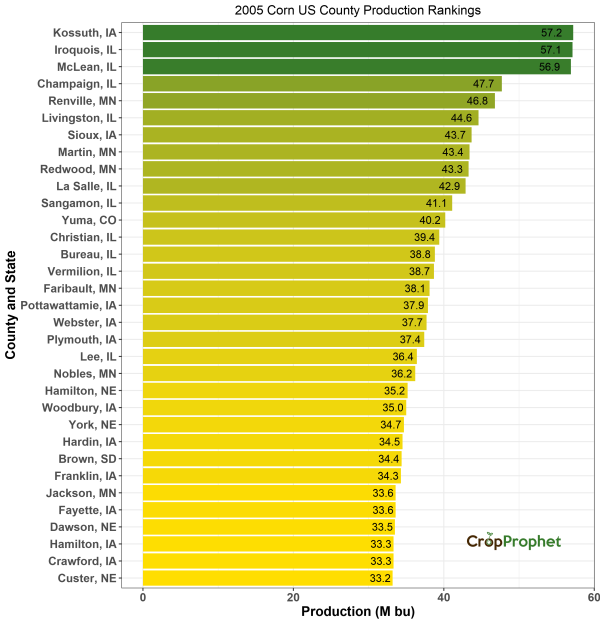
County Corn County National Production Ranking – 2005
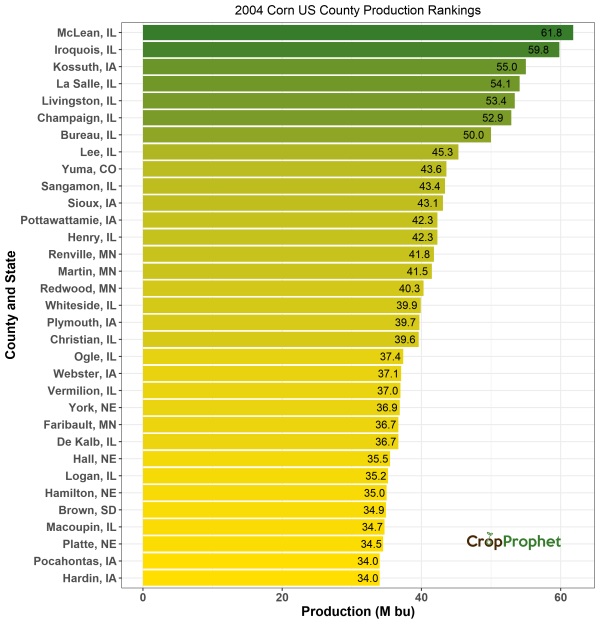
Corn Production by County: Top 33 of 2004
The top 33 corn-producing counties (and their total production) of 2004 was:
| County Production Rankings: 2004 | ||
| Rank | County, State | Production (M bu) |
|---|---|---|
| 1 | McLean, IL | 61.8 |
| 2 | Iroquois, IL | 59.8 |
| 3 | Kossuth, IA | 55.0 |
| 4 | La Salle, IL | 54.1 |
| 5 | Livingston, IL | 53.4 |
| 6 | Champaign, IL | 52.9 |
| 7 | Bureau, IL | 50.0 |
| 8 | Lee, IL | 45.3 |
| 9 | Yuma, CO | 43.6 |
| 10 | Sangamon, IL | 43.4 |
| 11 | Sioux, IA | 43.1 |
| 12 | Henry, IL | 42.3 |
| 12 | Pottawattamie, IA | 42.3 |
| 13 | Renville, MN | 41.8 |
| 14 | Martin, MN | 41.5 |
| 15 | Redwood, MN | 40.3 |
| 16 | Whiteside, IL | 39.9 |
| 17 | Plymouth, IA | 39.7 |
| 18 | Christian, IL | 39.6 |
| 19 | Ogle, IL | 37.4 |
| 20 | Webster, IA | 37.1 |
| 21 | Vermilion, IL | 37.0 |
| 22 | York, NE | 36.9 |
| 23 | De Kalb, IL | 36.7 |
| 23 | Faribault, MN | 36.7 |
| 24 | Hall, NE | 35.5 |
| 25 | Logan, IL | 35.2 |
| 26 | Hamilton, NE | 35.0 |
| 27 | Brown, SD | 34.9 |
| 28 | Macoupin, IL | 34.7 |
| 29 | Platte, NE | 34.5 |
| 30 | Pocahontas, IA | 34.0 |
| 30 | Hardin, IA | 34.0 |
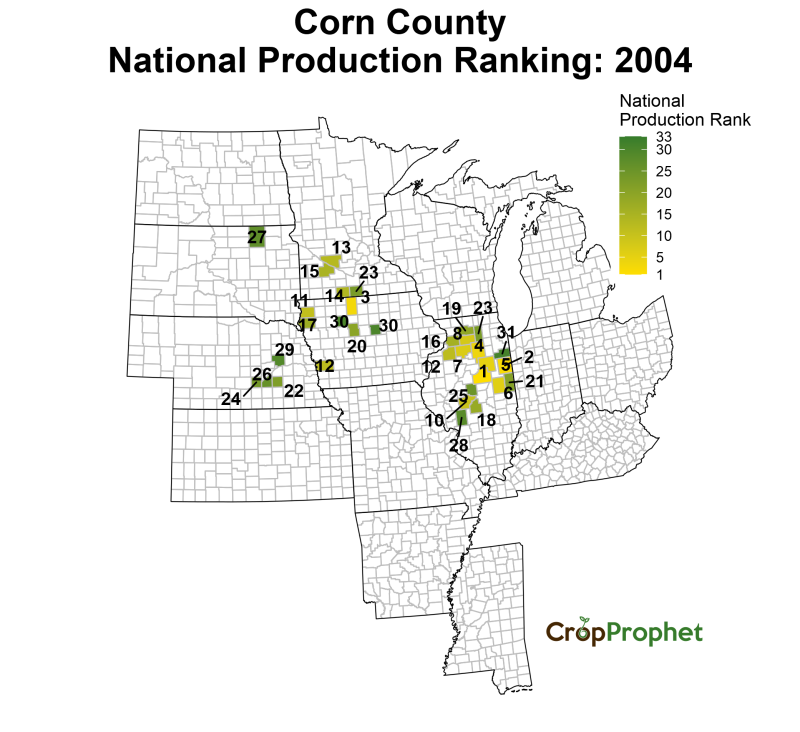
County Corn Production – 2004
County Corn County National Production Ranking – 2004
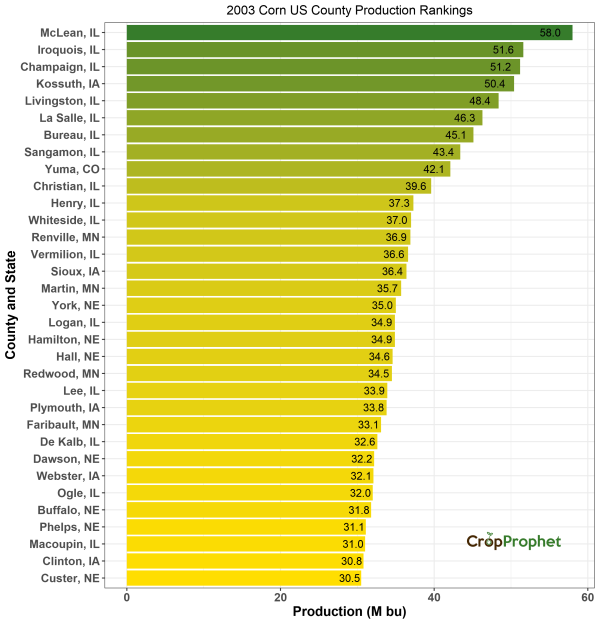
Corn Production by County: Top 33 of 2003
The top 33 corn-producing counties (and their total production) of 2003 was:
| County Production Rankings: 2003 | ||
| Rank | County, State | Production (M bu) |
|---|---|---|
| 1 | McLean, IL | 58.0 |
| 2 | Iroquois, IL | 51.6 |
| 3 | Champaign, IL | 51.2 |
| 4 | Kossuth, IA | 50.4 |
| 5 | Livingston, IL | 48.4 |
| 6 | La Salle, IL | 46.3 |
| 7 | Bureau, IL | 45.1 |
| 8 | Sangamon, IL | 43.4 |
| 9 | Yuma, CO | 42.1 |
| 10 | Christian, IL | 39.6 |
| 11 | Henry, IL | 37.3 |
| 12 | Whiteside, IL | 37.0 |
| 13 | Renville, MN | 36.9 |
| 14 | Vermilion, IL | 36.6 |
| 15 | Sioux, IA | 36.4 |
| 16 | Martin, MN | 35.7 |
| 17 | York, NE | 35.0 |
| 18 | Logan, IL | 34.9 |
| 18 | Hamilton, NE | 34.9 |
| 19 | Hall, NE | 34.6 |
| 20 | Redwood, MN | 34.5 |
| 21 | Lee, IL | 33.9 |
| 22 | Plymouth, IA | 33.8 |
| 23 | Faribault, MN | 33.1 |
| 24 | De Kalb, IL | 32.6 |
| 25 | Dawson, NE | 32.2 |
| 26 | Webster, IA | 32.1 |
| 27 | Ogle, IL | 32.0 |
| 28 | Buffalo, NE | 31.8 |
| 29 | Phelps, NE | 31.1 |
| 30 | Macoupin, IL | 31.0 |
| 31 | Clinton, IA | 30.8 |
| 32 | Custer, NE | 30.5 |
County Corn Production – 2003
County Corn County National Production Ranking – 2003

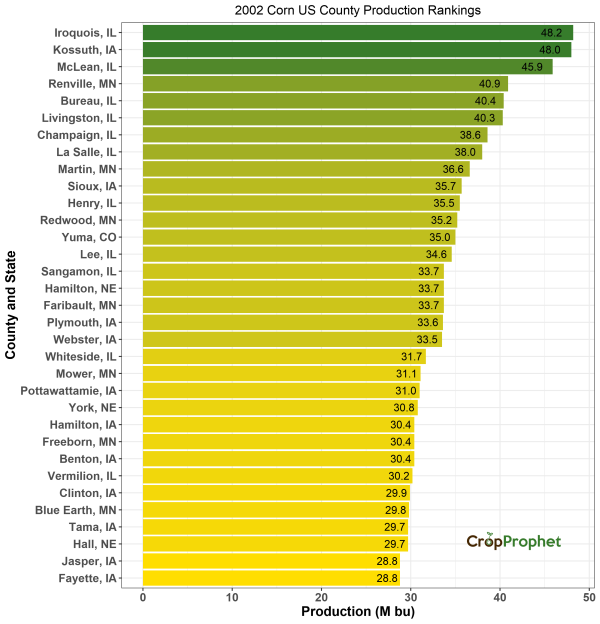
Corn Production by County: Top 33 of 2002
The top 33 corn-producing counties (and their total production) of 2002 was:
| County Production Rankings: 2002 | ||
| Rank | County, State | Production (M bu) |
|---|---|---|
| 1 | Iroquois, IL | 48.2 |
| 2 | Kossuth, IA | 48.0 |
| 3 | McLean, IL | 45.9 |
| 4 | Renville, MN | 40.9 |
| 5 | Bureau, IL | 40.4 |
| 6 | Livingston, IL | 40.3 |
| 7 | Champaign, IL | 38.6 |
| 8 | La Salle, IL | 38.0 |
| 9 | Martin, MN | 36.6 |
| 10 | Sioux, IA | 35.7 |
| 11 | Henry, IL | 35.5 |
| 12 | Redwood, MN | 35.2 |
| 13 | Yuma, CO | 35.0 |
| 14 | Lee, IL | 34.6 |
| 15 | Faribault, MN | 33.7 |
| 15 | Sangamon, IL | 33.7 |
| 15 | Hamilton, NE | 33.7 |
| 16 | Plymouth, IA | 33.6 |
| 17 | Webster, IA | 33.5 |
| 18 | Whiteside, IL | 31.7 |
| 19 | Mower, MN | 31.1 |
| 20 | Pottawattamie, IA | 31.0 |
| 21 | York, NE | 30.8 |
| 22 | Freeborn, MN | 30.4 |
| 22 | Benton, IA | 30.4 |
| 22 | Hamilton, IA | 30.4 |
| 23 | Vermilion, IL | 30.2 |
| 24 | Clinton, IA | 29.9 |
| 25 | Blue Earth, MN | 29.8 |
| 26 | Hall, NE | 29.7 |
| 26 | Tama, IA | 29.7 |
| 27 | Fayette, IA | 28.8 |
| 27 | Jasper, IA | 28.8 |
County Corn Production – 2002
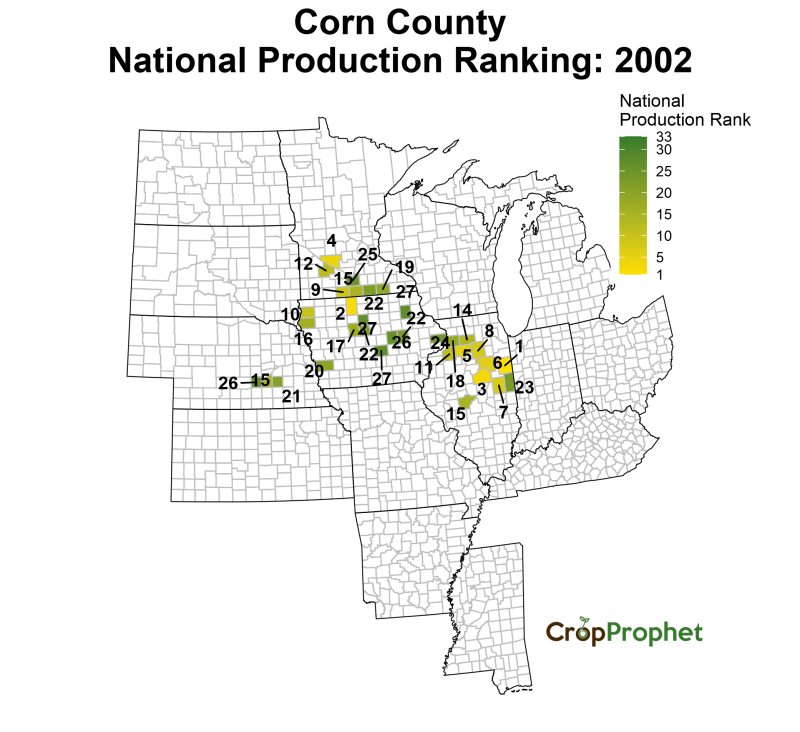
County Corn County National Production Ranking – 2002
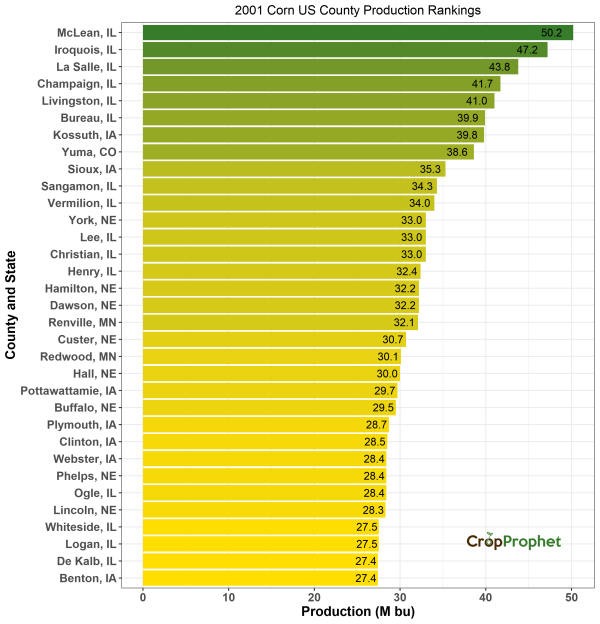
Corn Production by County: Top 33 of 2001
The top 33 corn-producing counties (and their total production) of 2001 was:
| County Production Rankings: 2001 | ||
| Rank | County, State | Production (M bu) |
|---|---|---|
| 1 | McLean, IL | 50.2 |
| 2 | Iroquois, IL | 47.2 |
| 3 | La Salle, IL | 43.8 |
| 4 | Champaign, IL | 41.7 |
| 5 | Livingston, IL | 41.0 |
| 6 | Bureau, IL | 39.9 |
| 7 | Kossuth, IA | 39.8 |
| 8 | Yuma, CO | 38.6 |
| 9 | Sioux, IA | 35.3 |
| 10 | Sangamon, IL | 34.3 |
| 11 | Vermilion, IL | 34.0 |
| 12 | Christian, IL | 33.0 |
| 12 | York, NE | 33.0 |
| 12 | Lee, IL | 33.0 |
| 13 | Henry, IL | 32.4 |
| 14 | Hamilton, NE | 32.2 |
| 14 | Dawson, NE | 32.2 |
| 15 | Renville, MN | 32.1 |
| 16 | Custer, NE | 30.7 |
| 17 | Redwood, MN | 30.1 |
| 18 | Hall, NE | 30.0 |
| 19 | Pottawattamie, IA | 29.7 |
| 20 | Buffalo, NE | 29.5 |
| 21 | Plymouth, IA | 28.7 |
| 22 | Clinton, IA | 28.5 |
| 23 | Ogle, IL | 28.4 |
| 23 | Phelps, NE | 28.4 |
| 23 | Webster, IA | 28.4 |
| 24 | Lincoln, NE | 28.3 |
| 25 | Whiteside, IL | 27.5 |
| 25 | Logan, IL | 27.5 |
| 26 | Benton, IA | 27.4 |
| 26 | De Kalb, IL | 27.4 |
County Corn Production – 2001
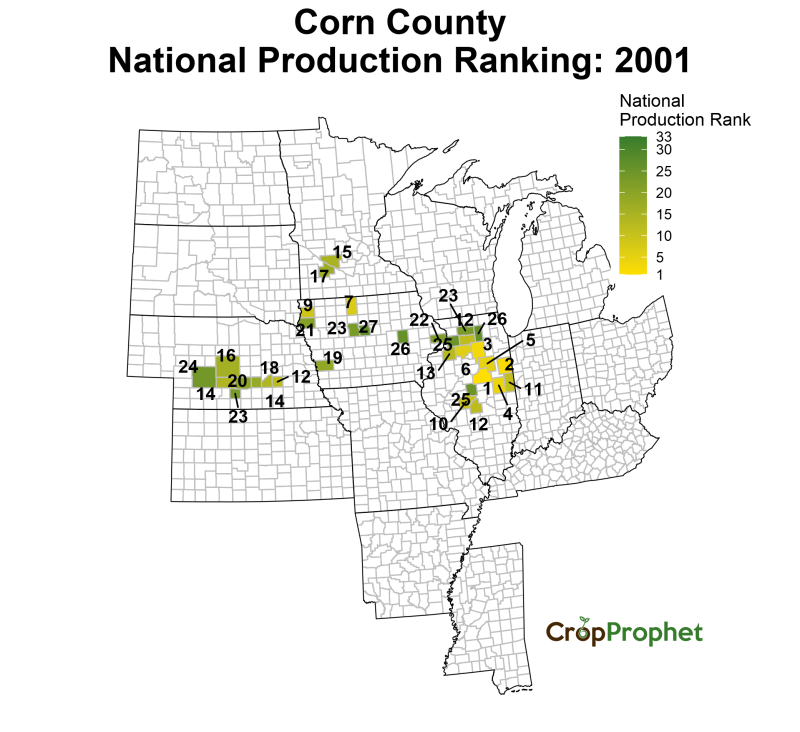
County Corn County National Production Ranking – 2001
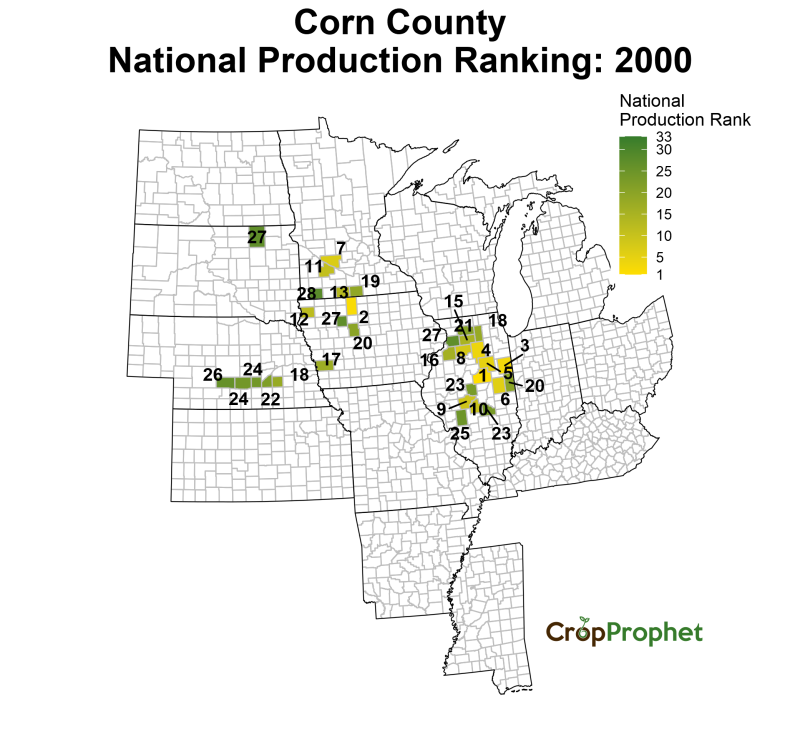
Corn Production by County: Top 33 of 2000
The top 33 corn-producing counties (and their total production) of 2000 was:
| County Production Rankings: 2000 | ||
| Rank | County, State | Production (M bu) |
|---|---|---|
| 1 | McLean, IL | 51.1 |
| 2 | Kossuth, IA | 47.6 |
| 3 | Iroquois, IL | 45.5 |
| 4 | La Salle, IL | 42.8 |
| 5 | Livingston, IL | 42.3 |
| 6 | Champaign, IL | 40.0 |
| 7 | Renville, MN | 38.0 |
| 8 | Bureau, IL | 36.6 |
| 9 | Sangamon, IL | 35.6 |
| 10 | Christian, IL | 34.6 |
| 11 | Redwood, MN | 34.3 |
| 12 | Sioux, IA | 34.2 |
| 13 | Martin, MN | 33.5 |
| 14 | Yuma, CO | 33.3 |
| 15 | Lee, IL | 31.6 |
| 16 | Henry, IL | 31.3 |
| 17 | Pottawattamie, IA | 30.7 |
| 18 | De Kalb, IL | 30.5 |
| 18 | York, NE | 30.5 |
| 19 | Faribault, MN | 30.2 |
| 20 | Vermilion, IL | 29.9 |
| 20 | Webster, IA | 29.9 |
| 21 | Ogle, IL | 29.7 |
| 22 | Hamilton, NE | 29.6 |
| 23 | Logan, IL | 29.3 |
| 23 | Shelby, IL | 29.3 |
| 24 | Buffalo, NE | 28.8 |
| 24 | Hall, NE | 28.8 |
| 25 | Macoupin, IL | 28.5 |
| 26 | Dawson, NE | 27.6 |
| 27 | Brown, SD | 27.0 |
| 27 | Whiteside, IL | 27.0 |
| 27 | Pocahontas, IA | 27.0 |
County Corn Production – 2000
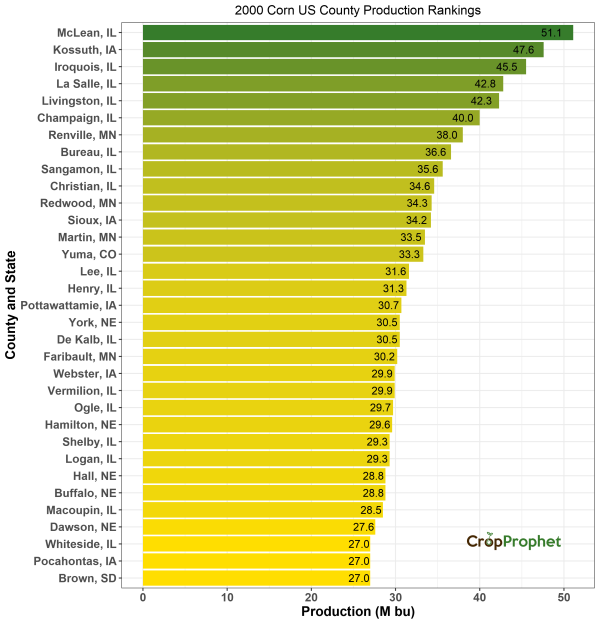
County Corn County National Production Ranking – 2000