USDA Crop Condition Reports & Weather
The USDA crop condition reports are a proxy for grain trading markets to digest the impact of weather on crops. This post examines the relationship between weather conditions and changes in the USDA crop condition reports. The USDA crop conditions report influences grain market futures prices, suggesting a systematic grain trading strategy might be possible if crop condition reports can be predicted.
What are the USDA Crop Condition Reports?
The USDA releases weekly crop condition reports for crops, including corn and soybeans, during the growing season. We could summarize the procedure used to survey producers and develop the report, but we think it’s best to quote the USDA directly. The description below comes verbatim from this document.
“Overview of Crop Condition Report Raw County Data
NASS provides crop progress and condition estimates for selected crops on a weekly basis during the crop-specific growing season.
Crop Condition Survey Procedures
Crop progress and condition estimates are obtained from data provided by the non-probability crop progress and condition survey. NASS reports typically cover the full U.S. growing season and are based on survey data collected each week from early April through the end of November. The non-probability crop progress and condition surveys include input from approximately 3,600 respondents whose occupations provide them opportunities to make visual observations and frequently bring them in contact with farmers in their counties. Based on standard definitions, these respondents subjectively estimate the progress of crops through various stages of development, as well as the progress of producer activities. They also provide subjective evaluations of crop conditions. Weekly reports are reviewed for reasonableness and consistency. Aggregation of the data to state and national levels relies on weights derived from historical NASS acreage estimates, the original county reports are unweighted.
Crop Condition Report Reporting Procedure
Most respondents complete their questionnaires on Friday or early Monday morning and submit them to their local state NASS Field Office by mail, telephone, fax, e-mail, or through a secured internet website. A small number of reports are completed on Thursday, Saturday, and Sunday. Regardless of when questionnaires are completed, respondents are asked to report for the entire week ending on Sunday. For reports submitted prior to the Sunday reference date, respondents must make projections for weekend changes in progress and condition. The majority of reports are submitted on Monday morning, via the secure website. Respondents are sent written reporting instructions at the beginning of each season and are contacted periodically to ensure proper reporting. Terms and definitions of crop stages and condition categories used as reporting guidelines are available on the NASS website at www.nass.usda.gov/Publications/National_Crop_Progress.”
In summary, the crop condition reports provide survey-based data from approximately 3600 people each week of the growing season from a wide swath of US crop-growing regions. The reports are generally released on Mondays or the nearest non-holiday weekday when Monday is a national holiday. The submitted crop assessments are valid for a prior week-long period ending the Sunday before the reports are issued.
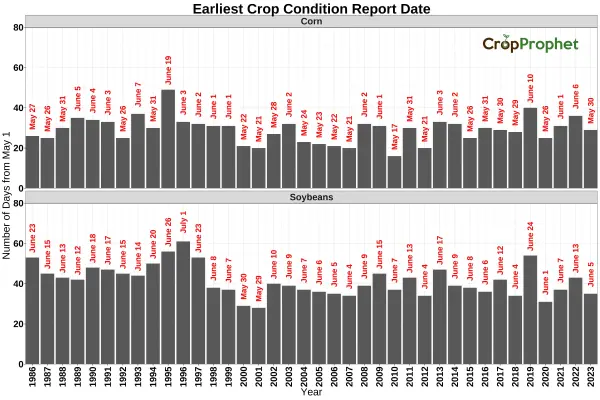
When Are the First Crop Condition Reports Released?
The graphic below shows the historical dates of the first corn and soybean crop condition reports since 1986. Corn crop condition reports tend to be released from late May to early June. Soybean crop condition reports tend to be first released in early to mid-June.
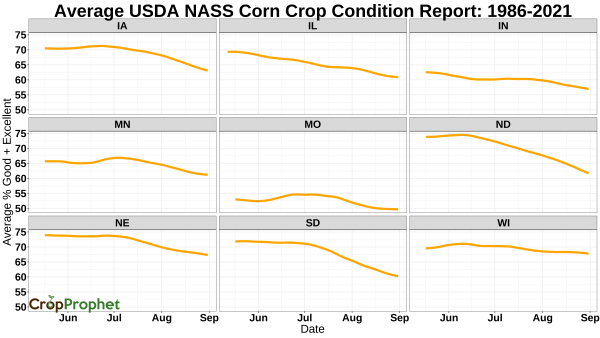
The Browning Effect in Crop Condition Reports
The browning effect is a phrase coined by commodity market analyst Darin Newsom to describe the progression of the average USDA crop condition report for corn and soybeans during the growing season. The browning effect describes the gradual decline of a particular aspect of USDA crop condition reports averaged over many years from June to September, as shown for several states in Figure 1 below.
In a recent discussion with Darin, he surmised that because the crop conditions reports decline during the season, the USDA crop condition reports contain little useful information that actually describes the crop condition. In fact, not only is Darin adamant that the crop condition reports are essentially useless but he told this posts author that “your introduction doesn’t lay out the irrelevancy of NASS numbers adequately?”
We take a more sanguine view of the information contained in the USDA crop condition reports and are confident they contain useful information. For example, our state-level corn, soybean, and winter wheat yield and production forecasts leverage a proprietary model dependent on the history of USDA crop condition reports. This suggests the crop condition reports contain statistically significant predictive information regarding the end-of-season crop yield. That fact alone suggests that the crop condition reports contain useful information. Grain markets follow the crop condition reports because they are a proxy for a real-time grain yield forecast.
To answer the question, “Do the USDA crop condition reports contain useful information?” we might ask “What’s the impact of weather conditions on the crop condition reports for corn and soybeans?” If changes in the crop condition reports are consistent with changes in crop season weather conditions, we can conclude the crop condition reports do have useful information. That’s the very question we answer in this blog post.
We conducted an additional analysis on the first non-zero USDA crop progress reports for both corn and soybeans.

Weather and USDA Crop Conditions
This study uses two data sources. The first is the history of USDA crop condition reports for corn and soybeans. The second data source is the US county-level daily temperature and precipitation data. Both data sets are available in the CropProphet Modeler data set.
Crop Condition Report Data
The crop condition reports provide an estimate of the percentage of the crop in the following categories:
- Excellent
- Good
- Fair
- Poor
- Very poor
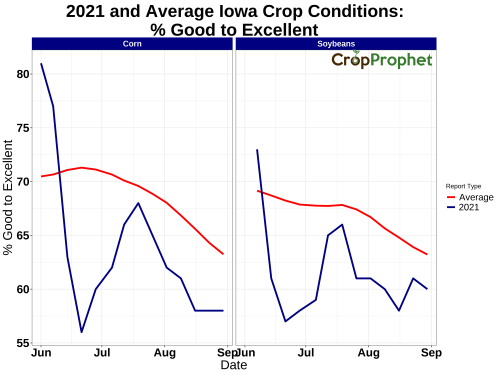
To simplify the interpretation of the data, the grain industry combines the top two categories and reports the percentage of the crop rated in the good and excellent categories. Figure 2 below shows the 2021 Iowa corn and soybean USDA good + excellent percentage for each week and the 1986-2021 average crop condition report.
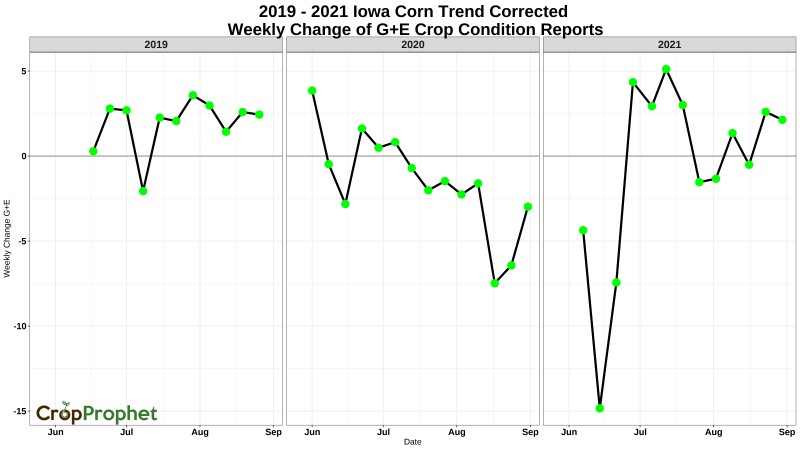
Correcting for the Trend in Crop Condition Reports
We calculate the week-to-week change in the crop condition reports to examine the weather’s impact on the crop condition report,. To achieve that, we simply subtract the previous week’s report from the “current” week throughout the crop report history.
However, as shown in Figure 1, the crop condition report decreases on average through the growing season. The Iowa corn crop condition report of good + excellent declines an average of -0.77% per week from mid-June to September. So, a mid-July crop rating decline of one percent is approximately no change in crop conditions.
The average decline in crop ratings should be taken into account for the average decline of the condition reports. We calculate the weekly change of the crop condition reports as:
![]()
Where ge is the crop condition report percentage of good to excellent for any week i during the growing season. y denotes a specific year, and the overbar indicates the average of the crop condition reports from 1986 to 2021.
Said in plain words, the weekly change of the historical crop condition reports is equal to the current week’s report good + excellent rating minus the previous week’s good+excellent rating minus the change in the average good + excellent rating for that week.
Figure 3 below shows the most recent three years of Iowa corn trend adjusted weekly good+excellent crop condition change by week.
CropProphet Weather Data
The CropProphet weather dataset provides daily, US county-level observational weather of variables such as temperature, precipitation, relative humidity, and growing degree days.
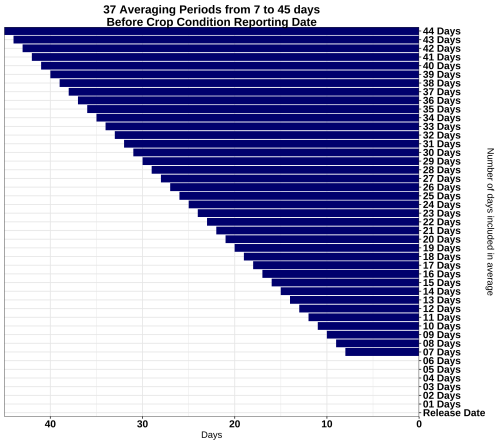
To identify the impact of weather on the crop condition reports, we calculate crop production weighted average temperature and accumulated precipitation over many periods ending the Sunday before each weekly crop condition report is released from 1986 to 2021. We calculate the average temperature for each period between 7 and 45 days up to the Sunday before each crop condition report release date. .
The averaging period concept is demonstrated in Figure 4 below, a schematic diagram illustrating the averaging and accumulating periods used.
State temperature and precipitation indices are created by calculating state crop production-weighted daily average temperature and accumulated precipitation. Each is normalized by removing its mean and dividing by its standard deviation, which facilitates comparisons between the different averaging periods.
Crop Condition Reports – Impact of Precipitation
There are quite a few corn-growing states in the United States. For this analysis, we’ll only examine states with significant corn production totals.
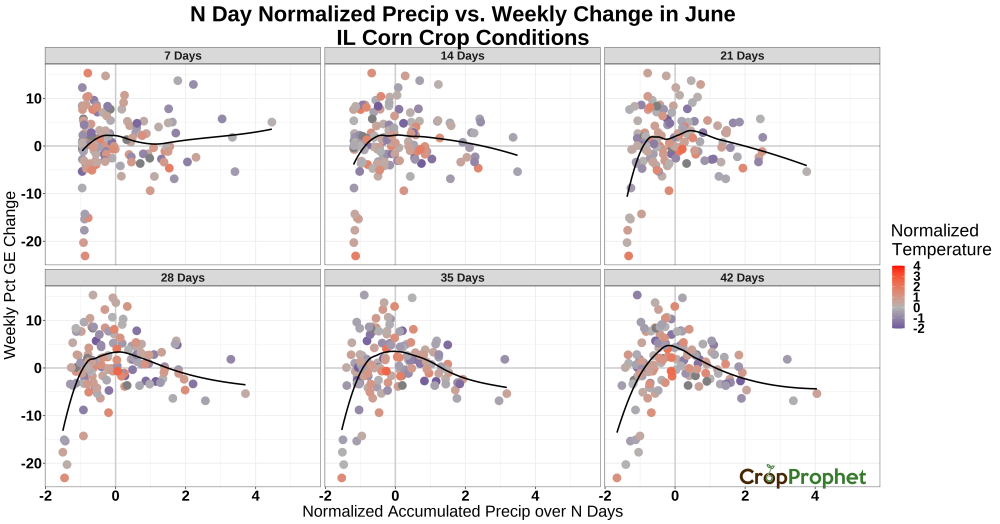
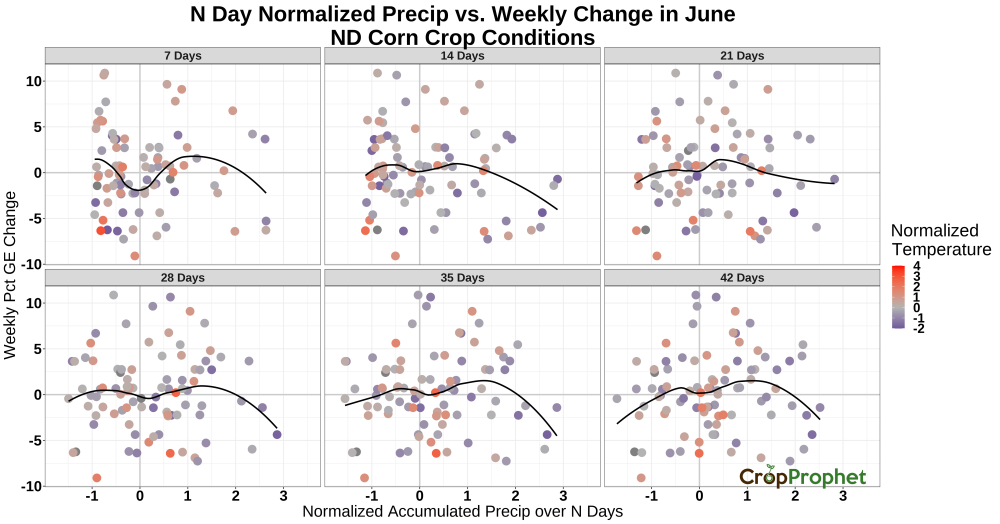
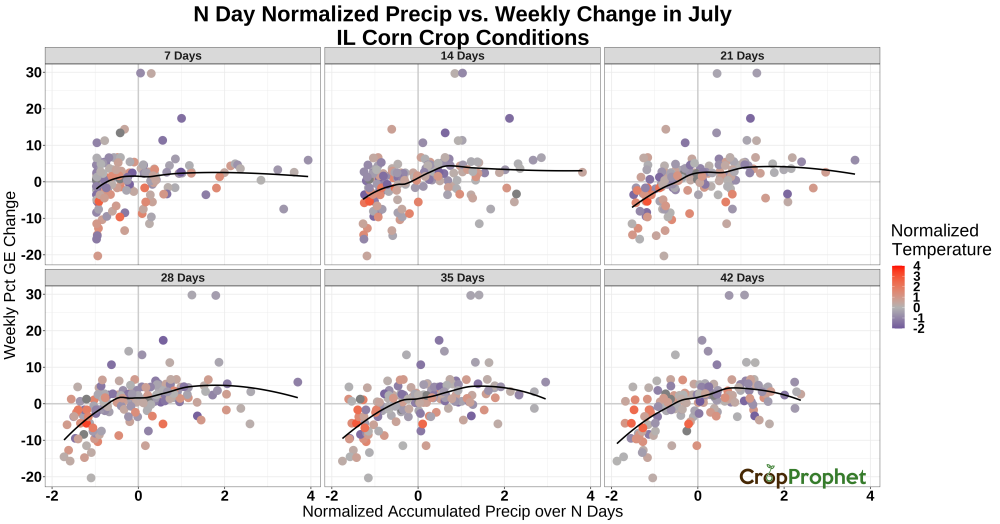
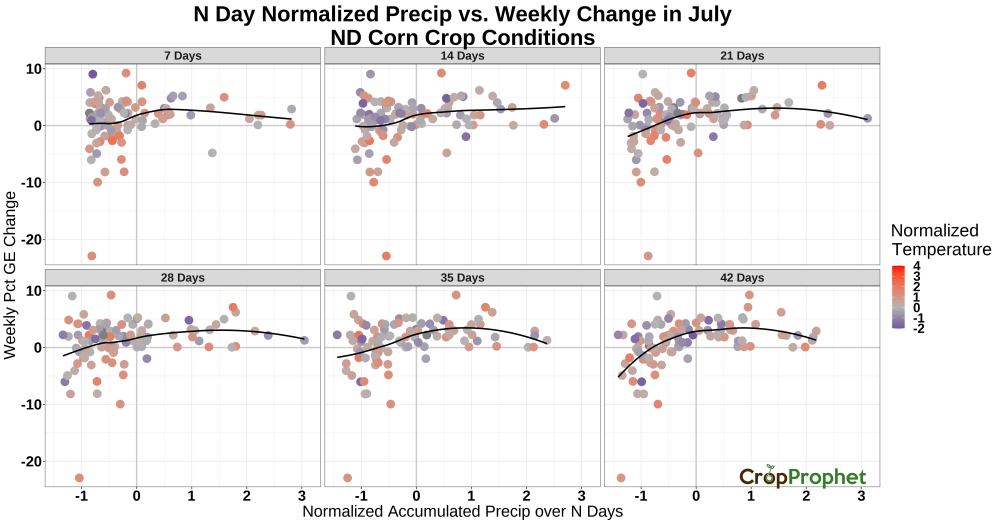
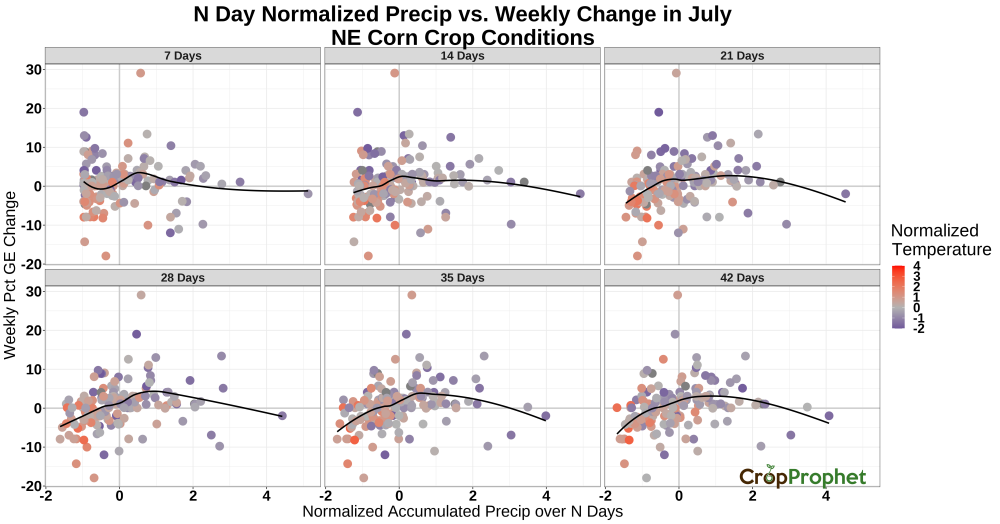
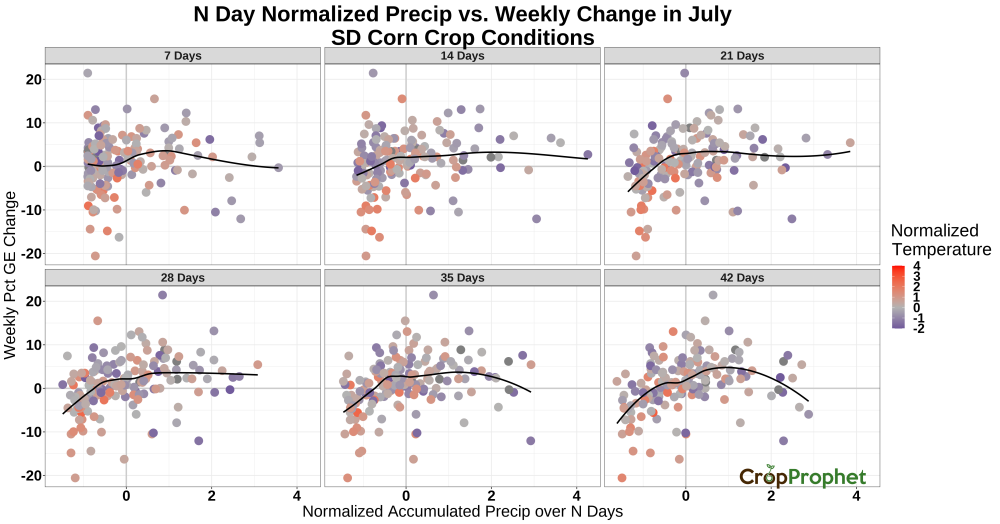
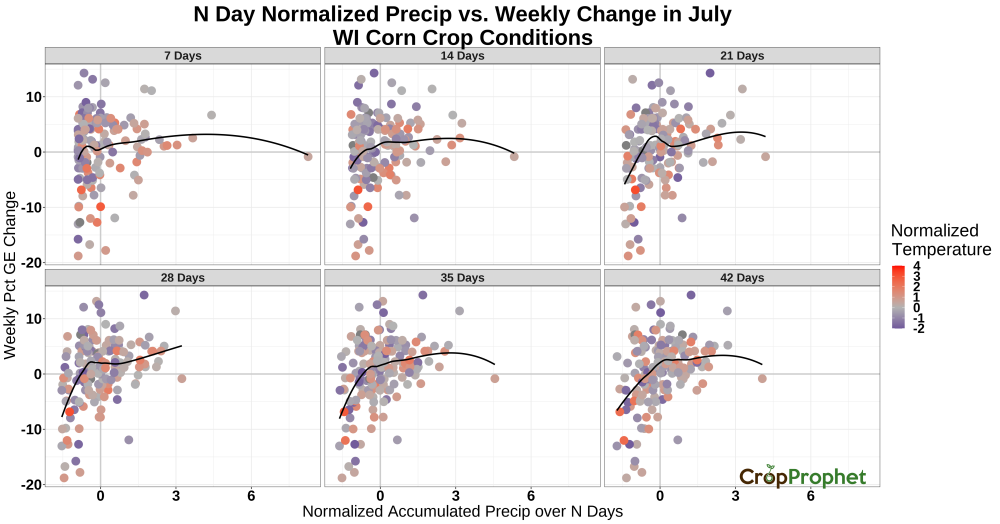
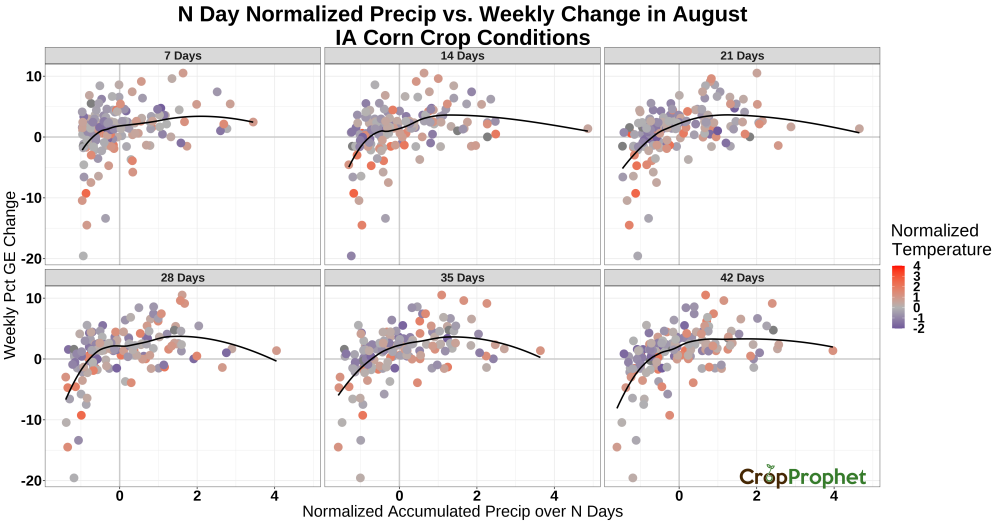
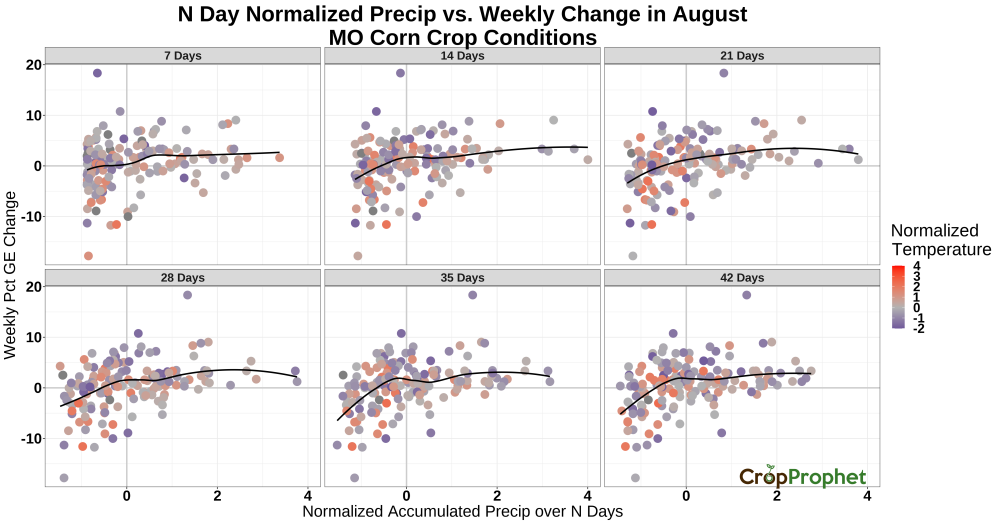
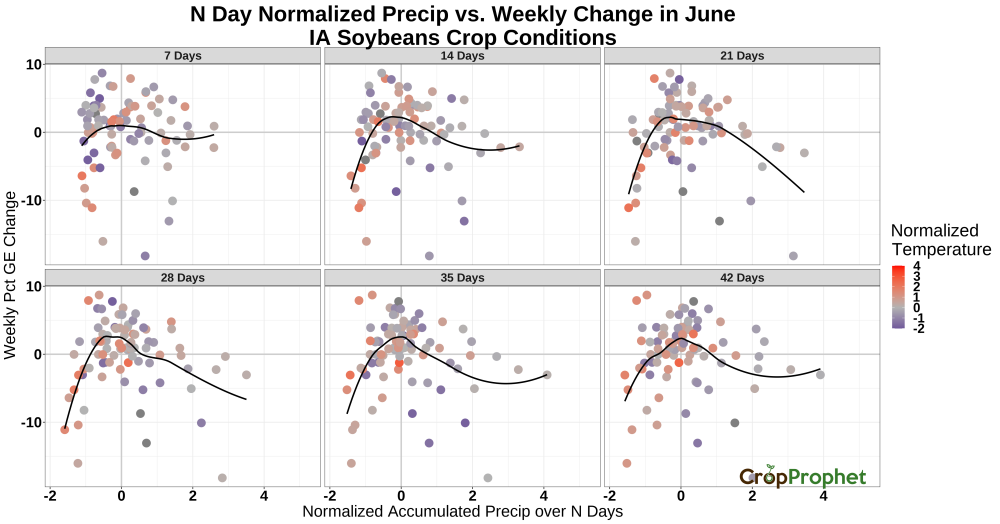
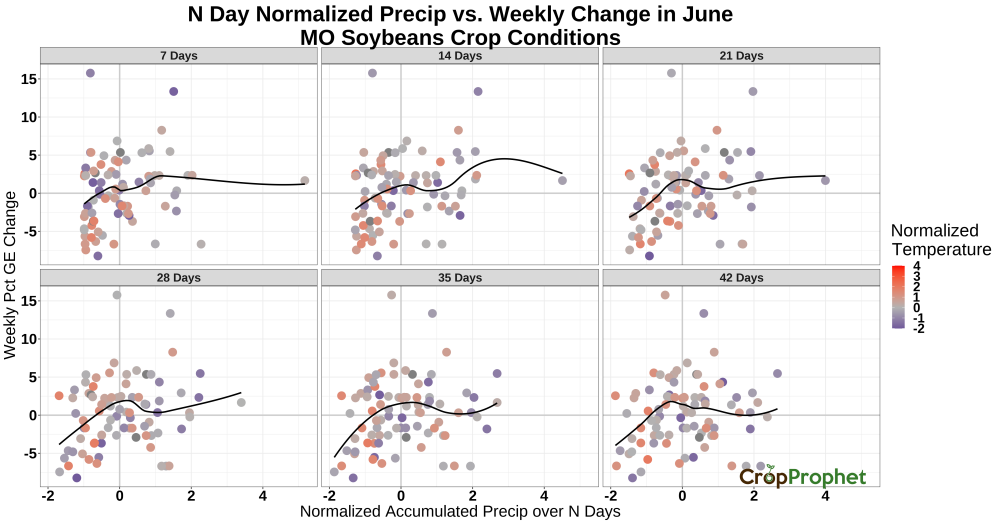
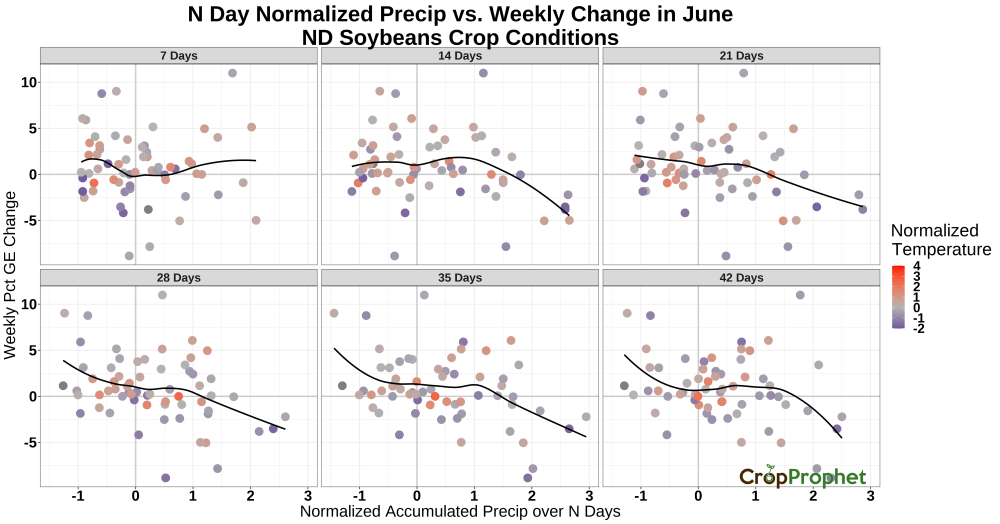
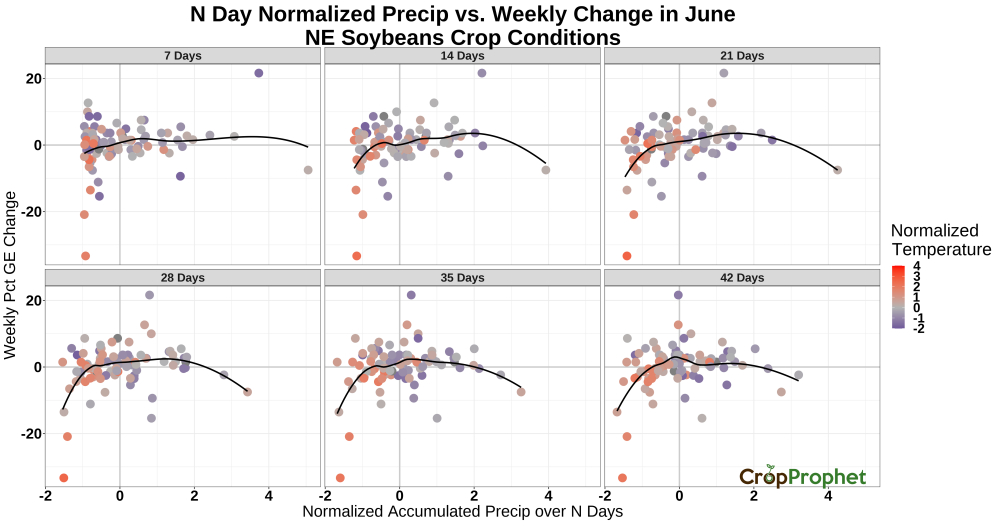
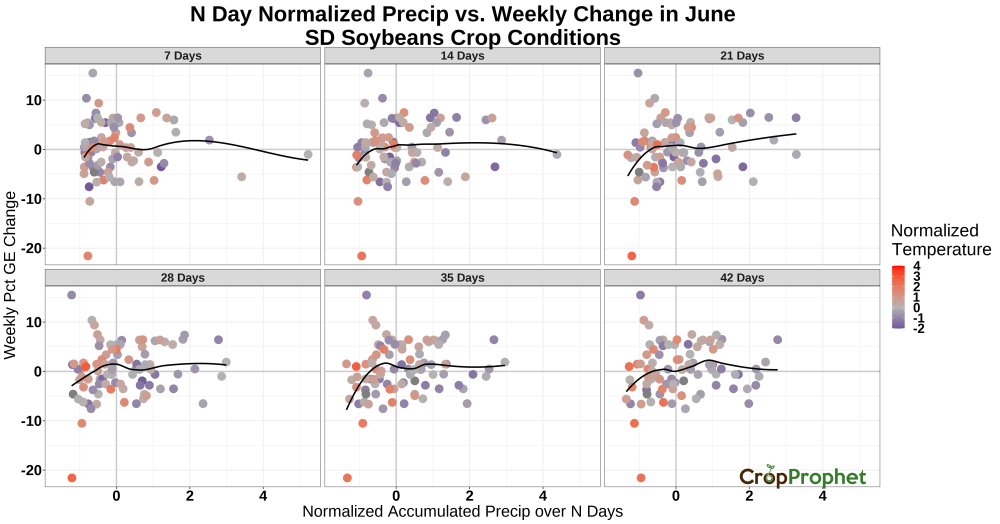
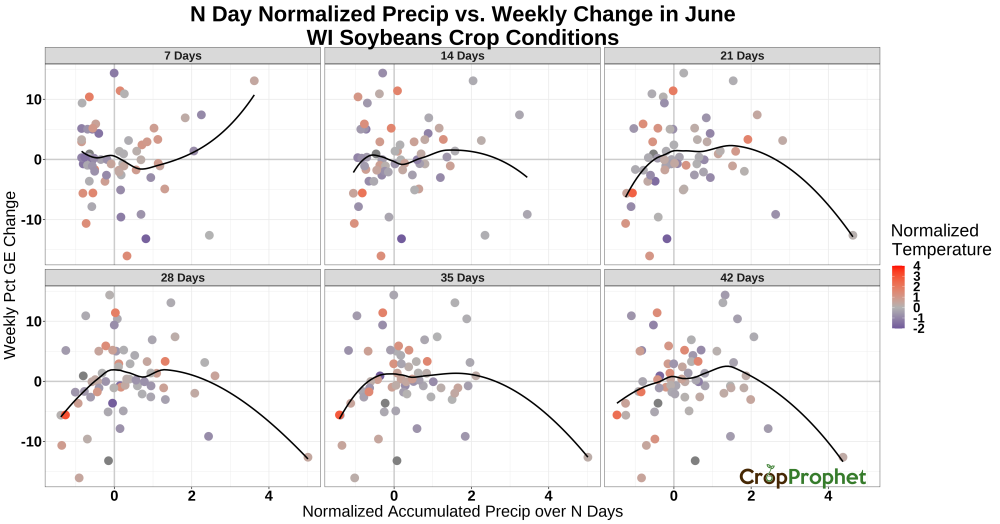
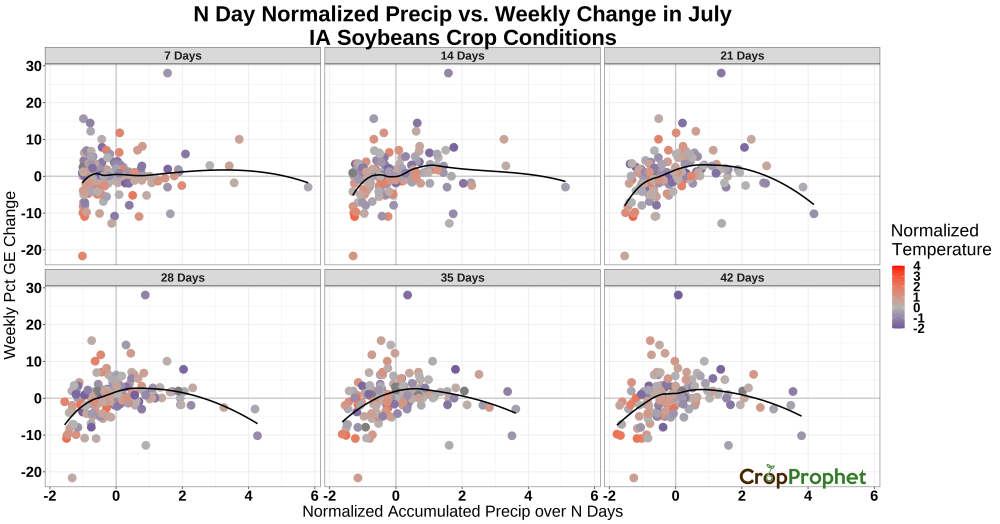
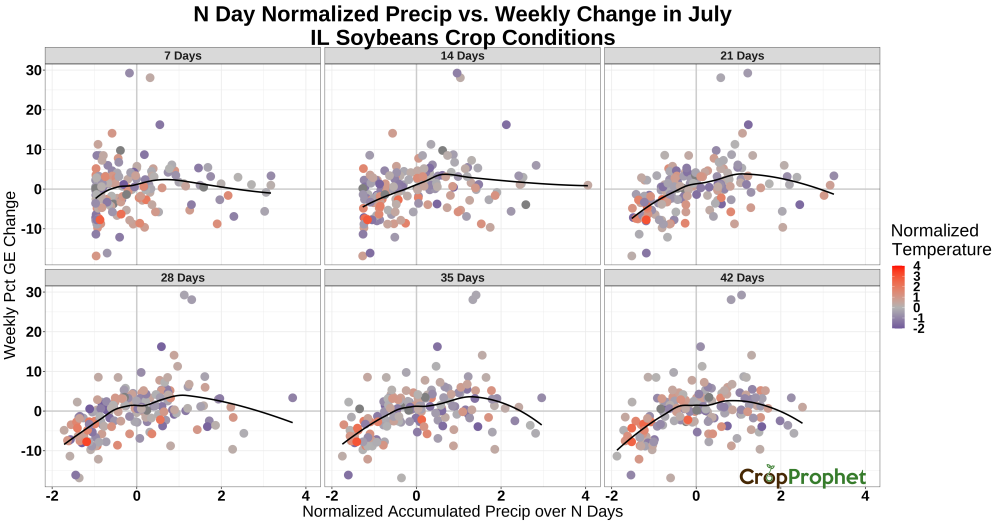
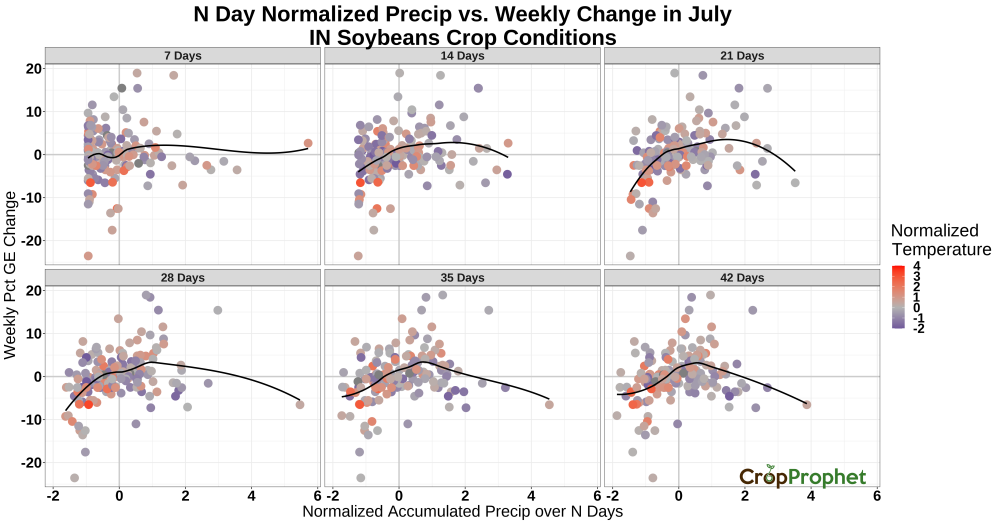
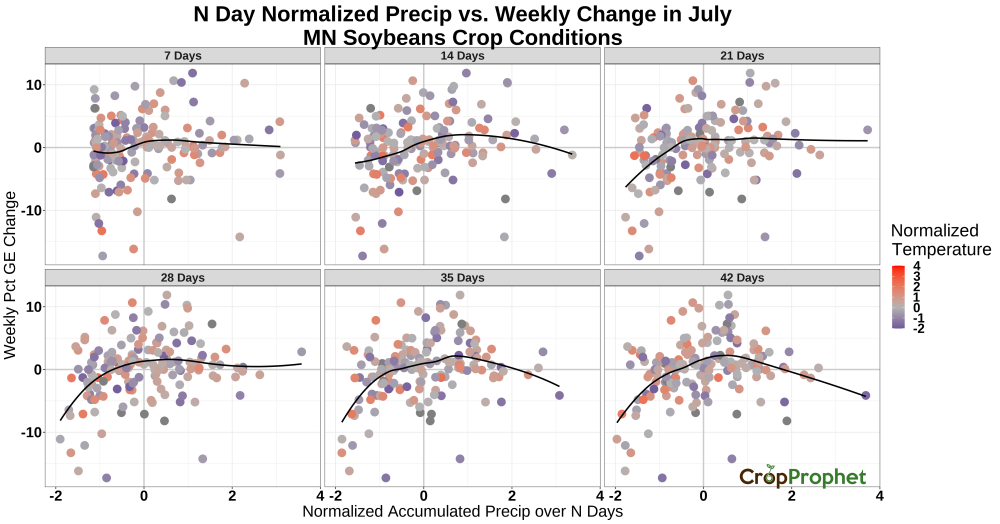
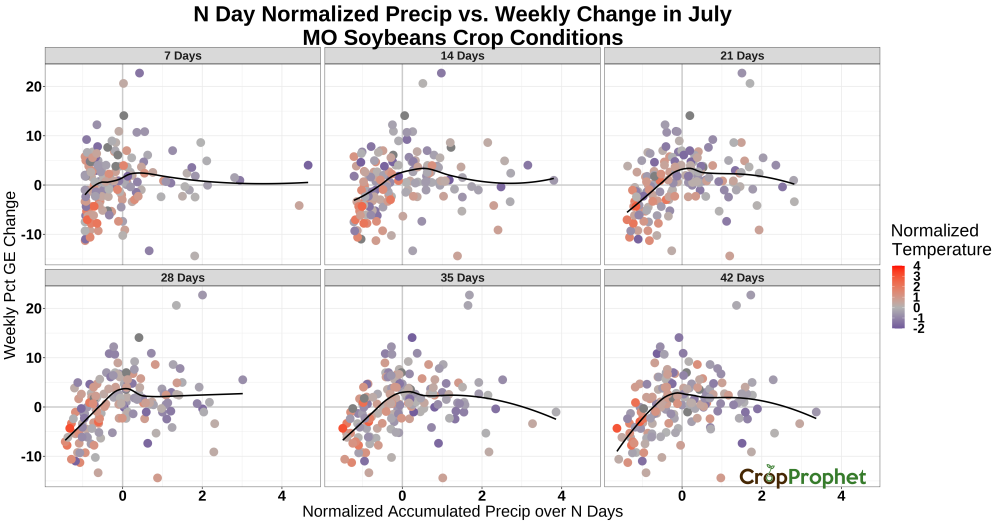
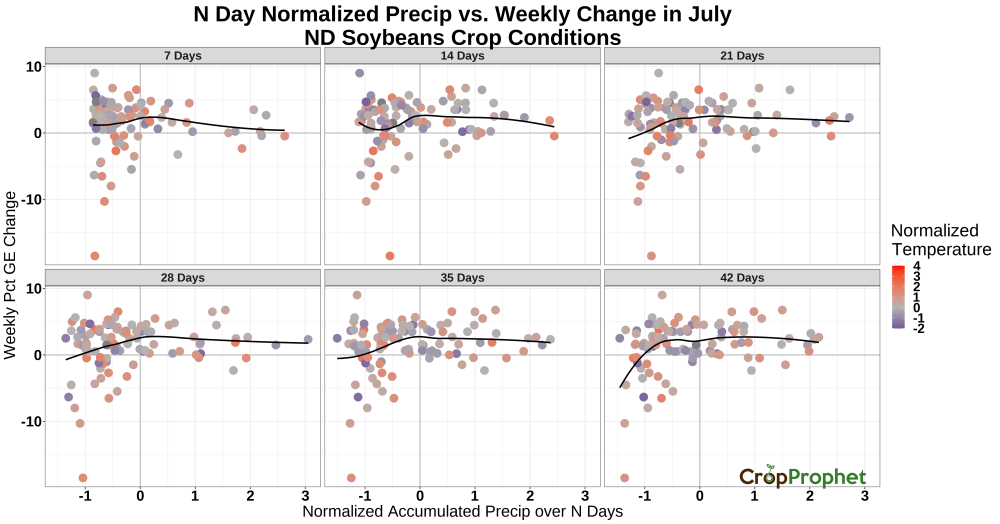
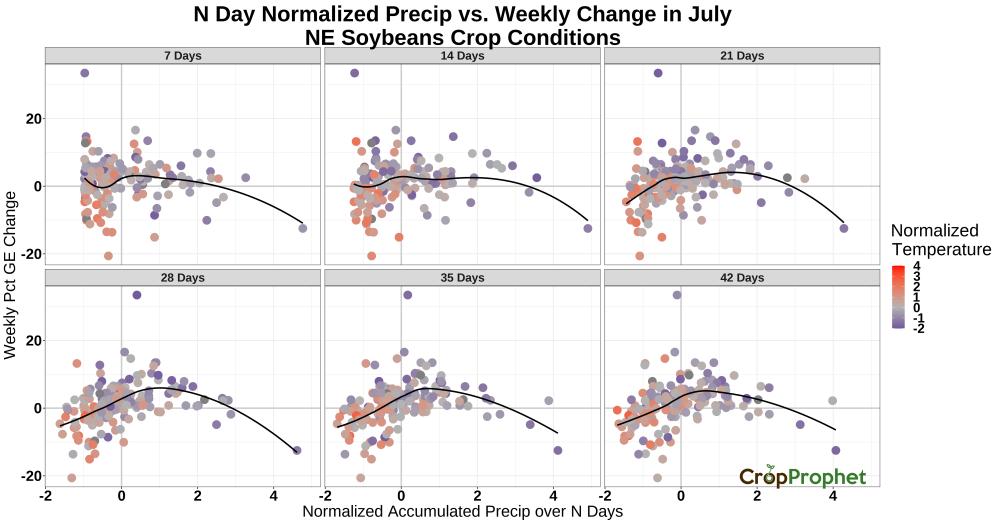
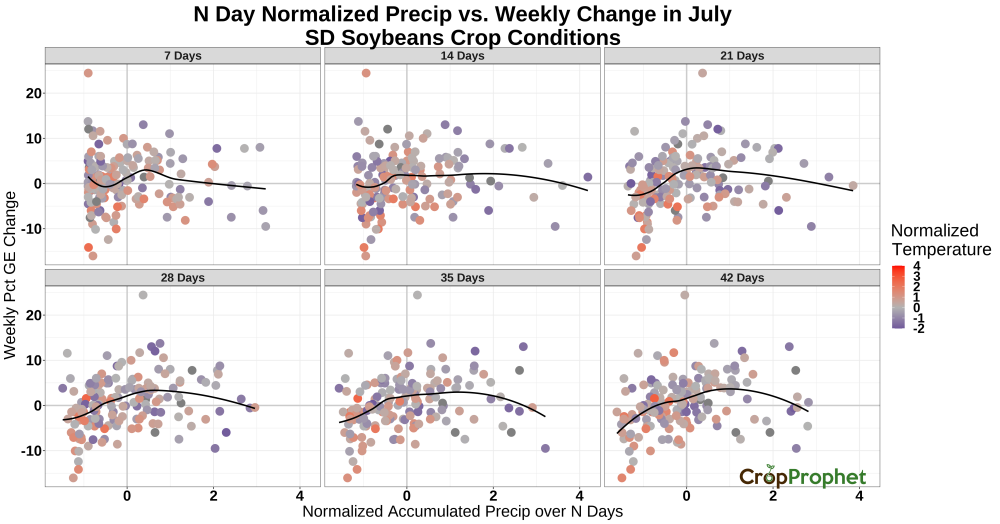
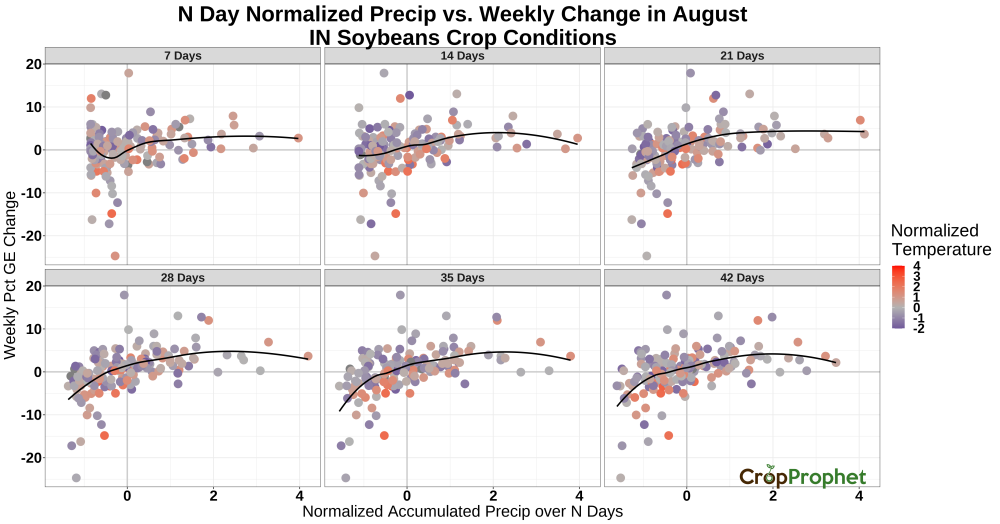
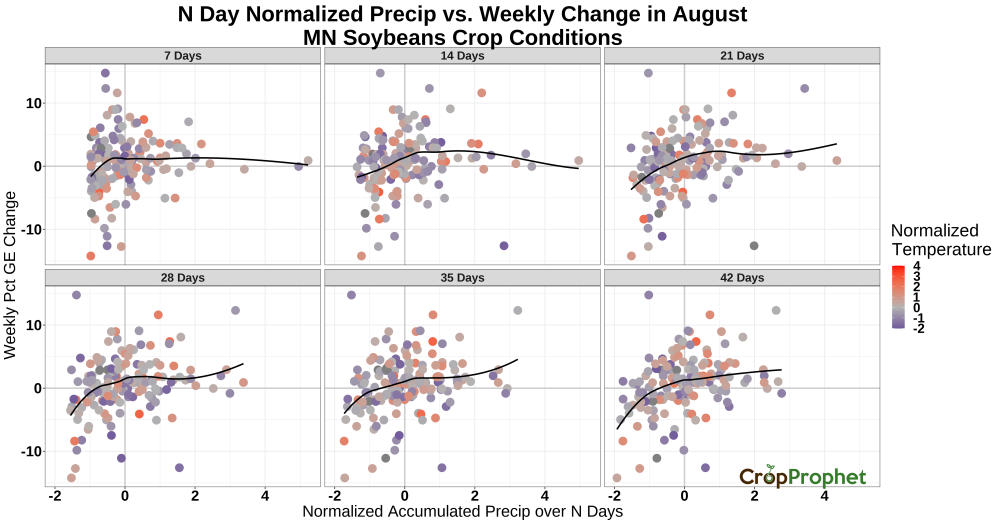
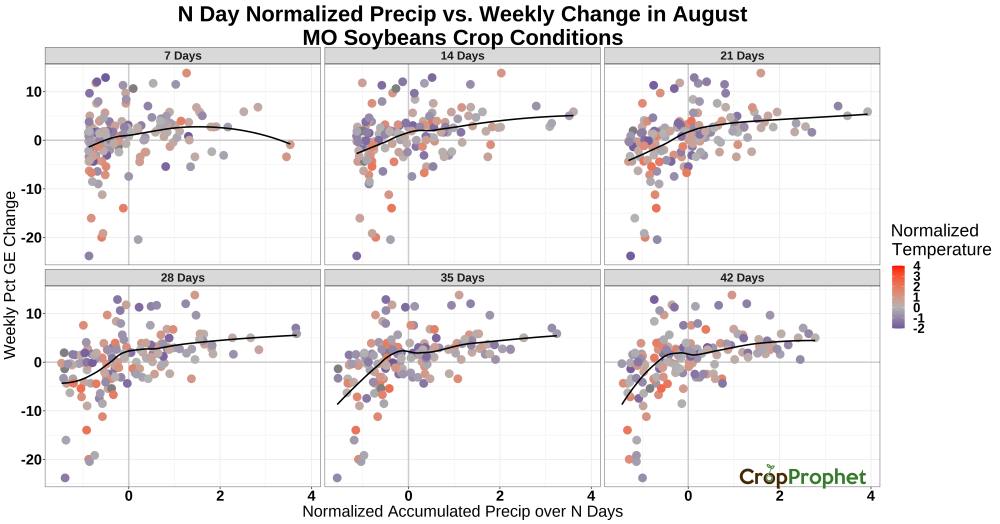
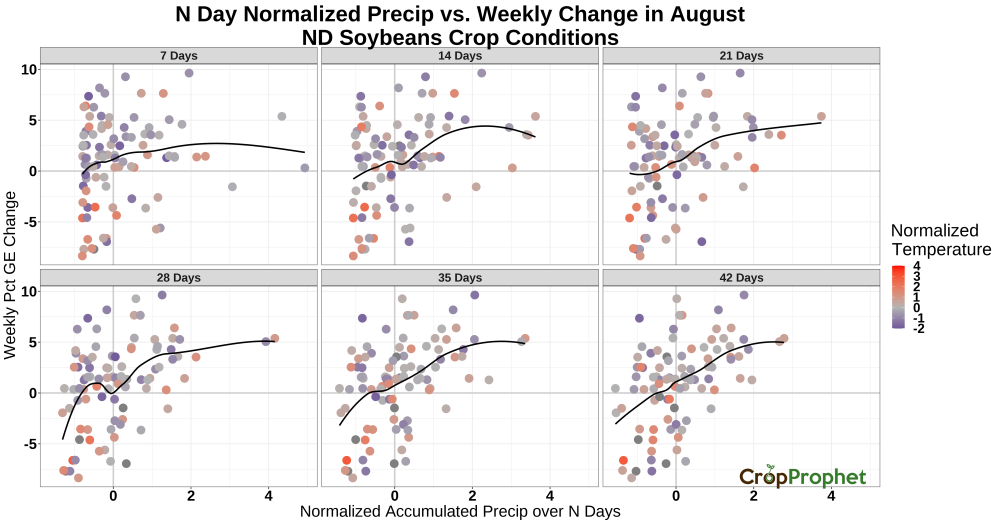
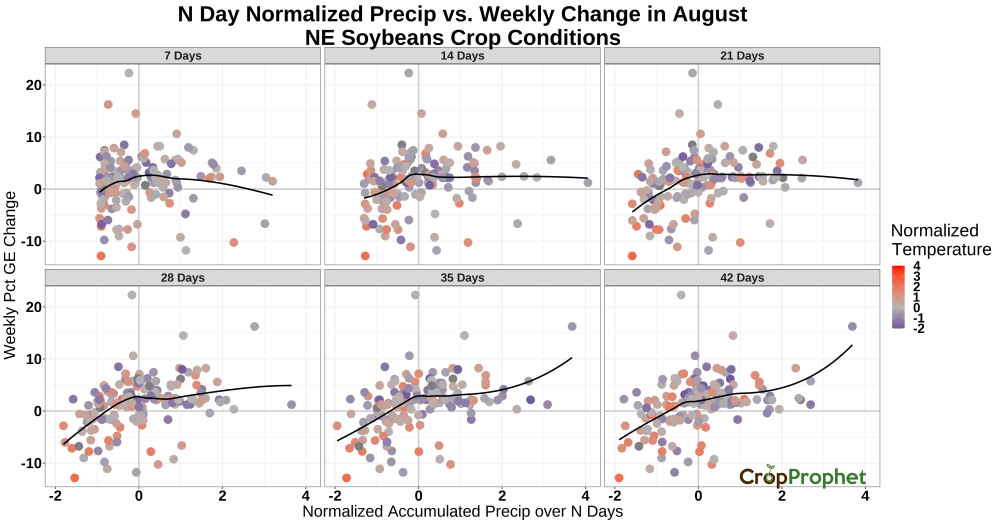
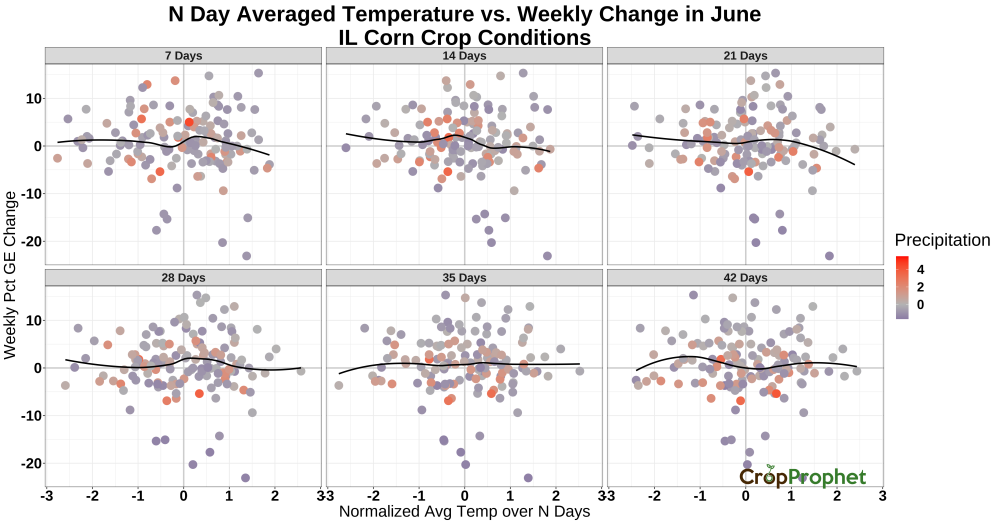
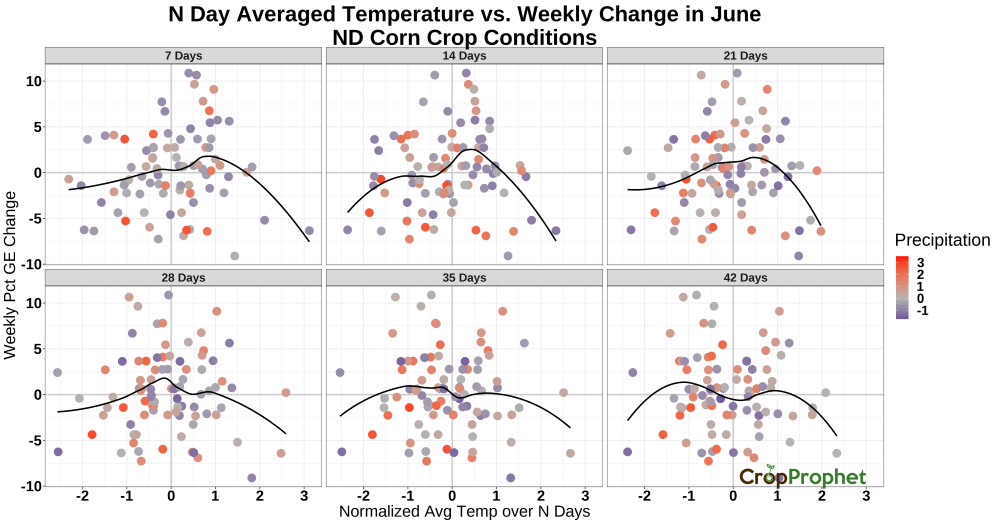
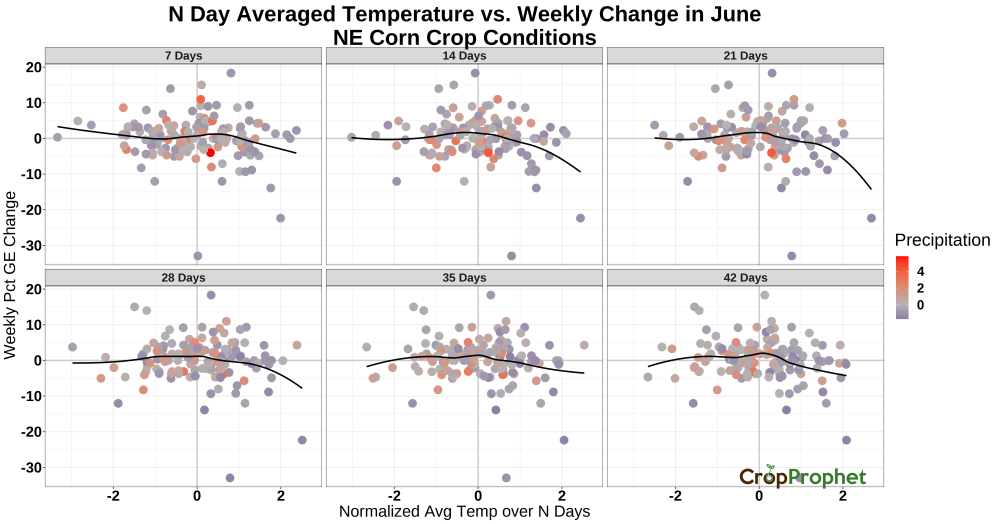
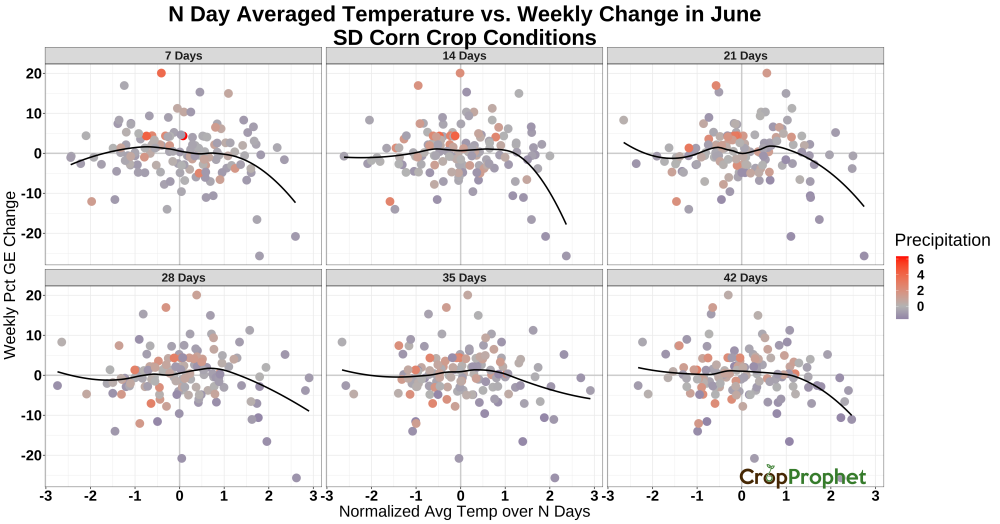
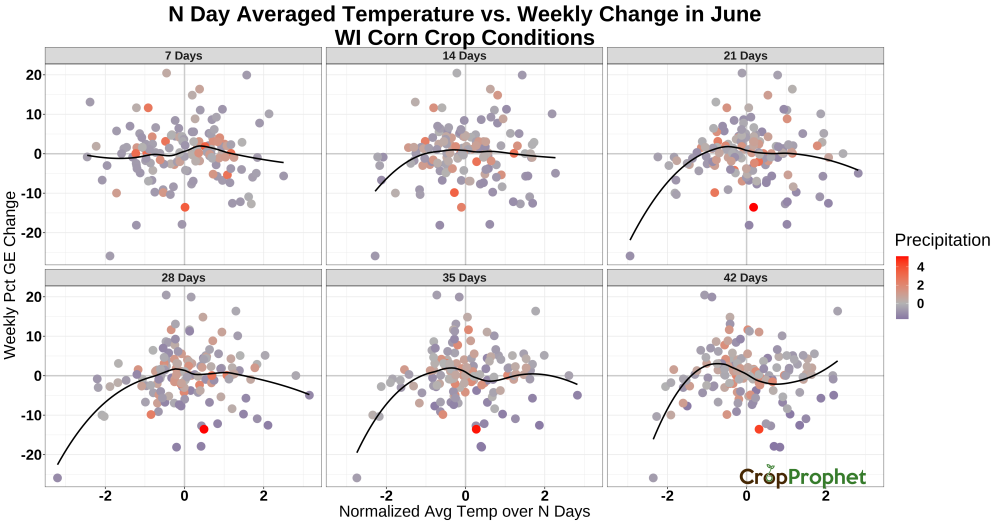
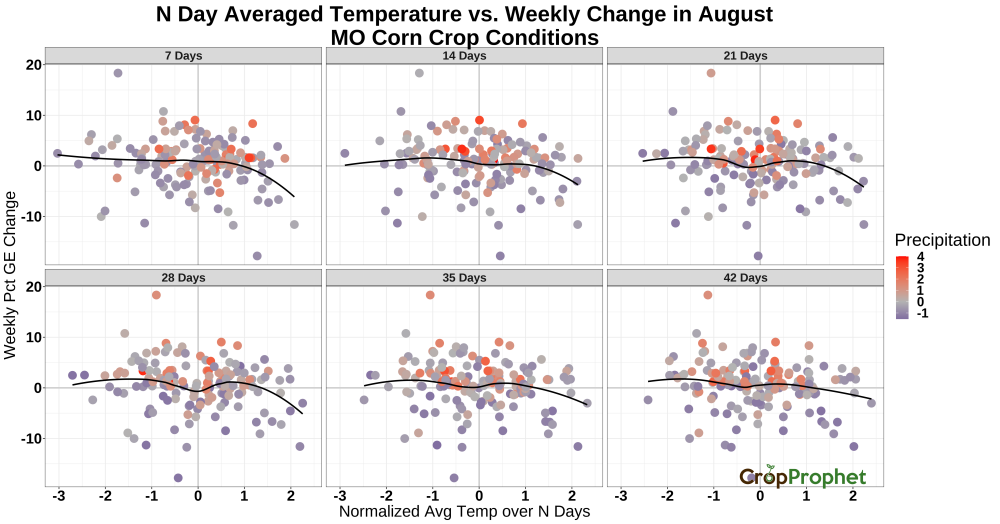
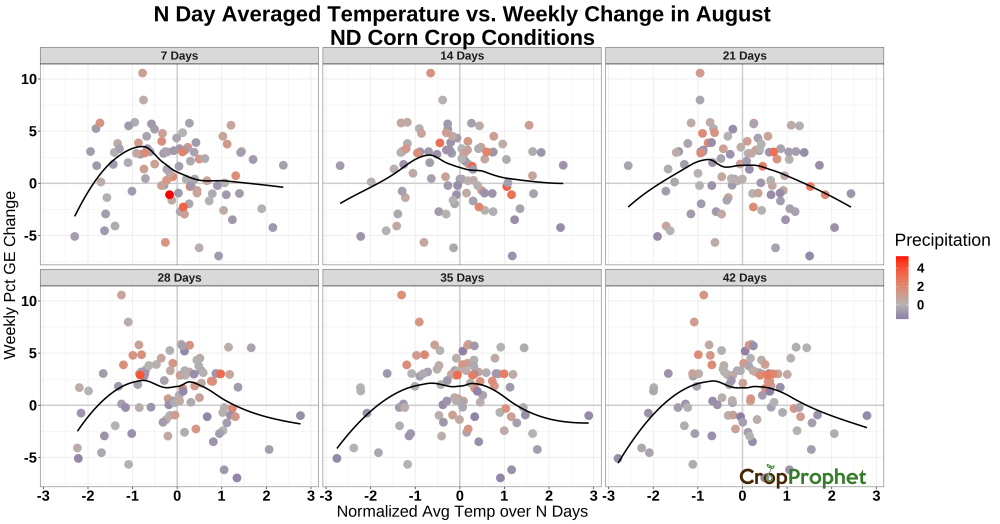
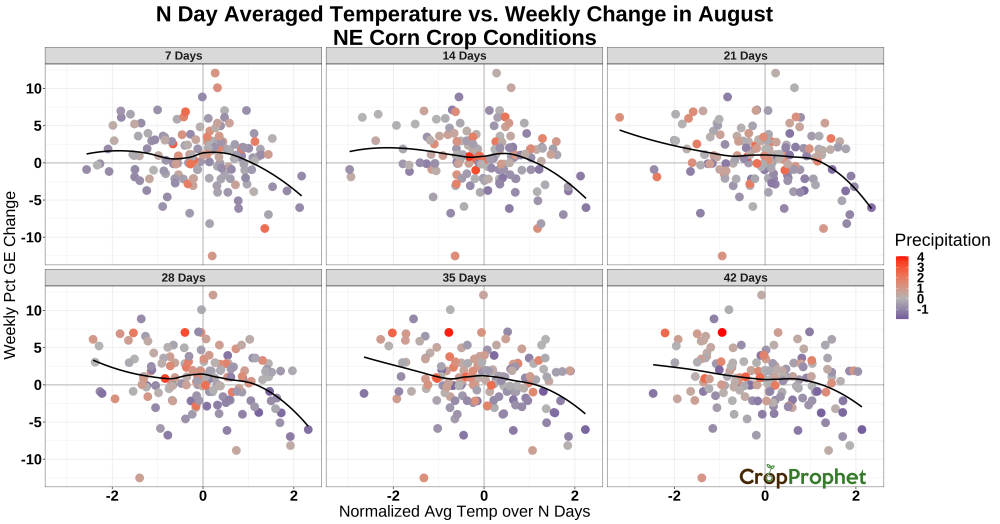
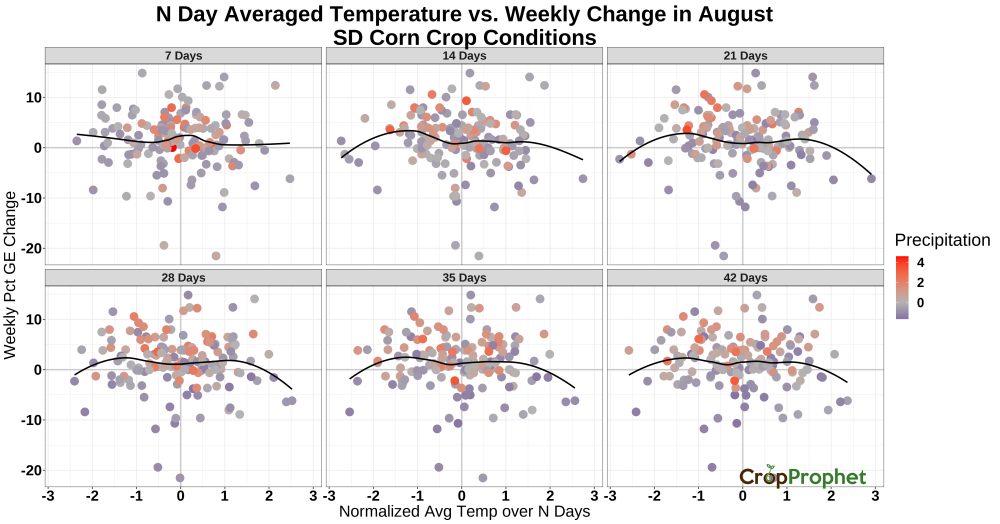
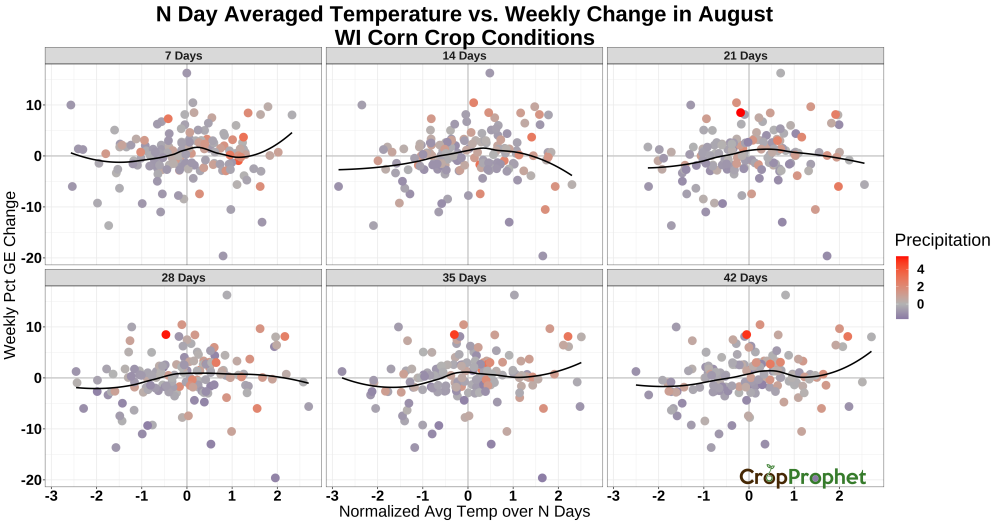
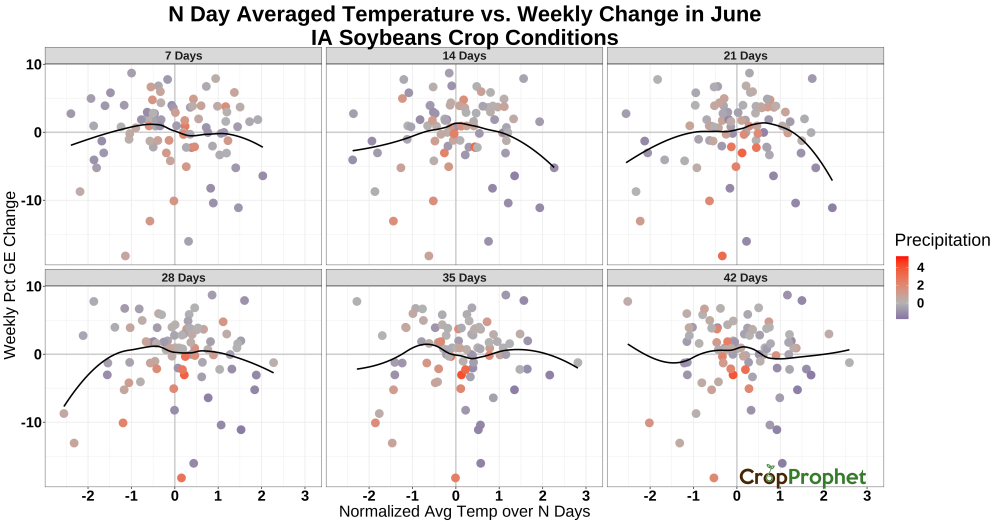
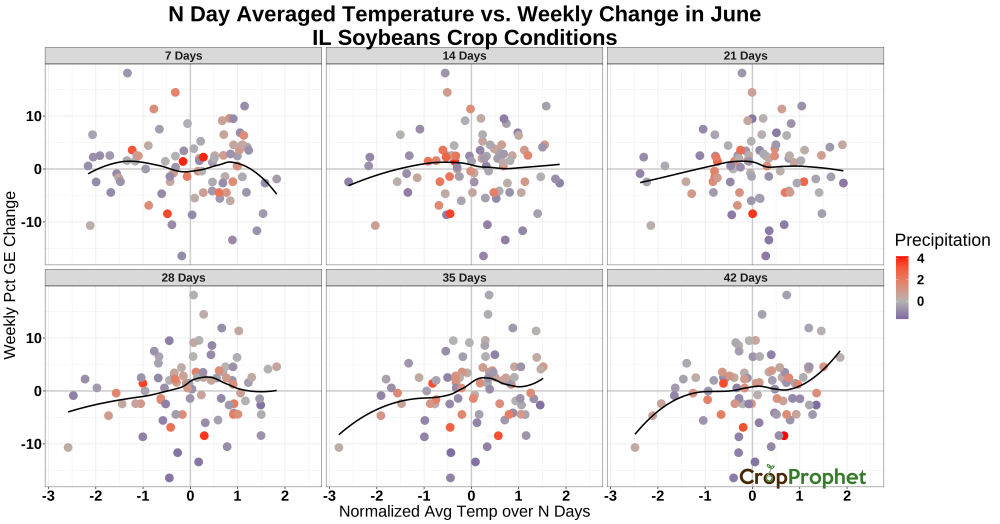
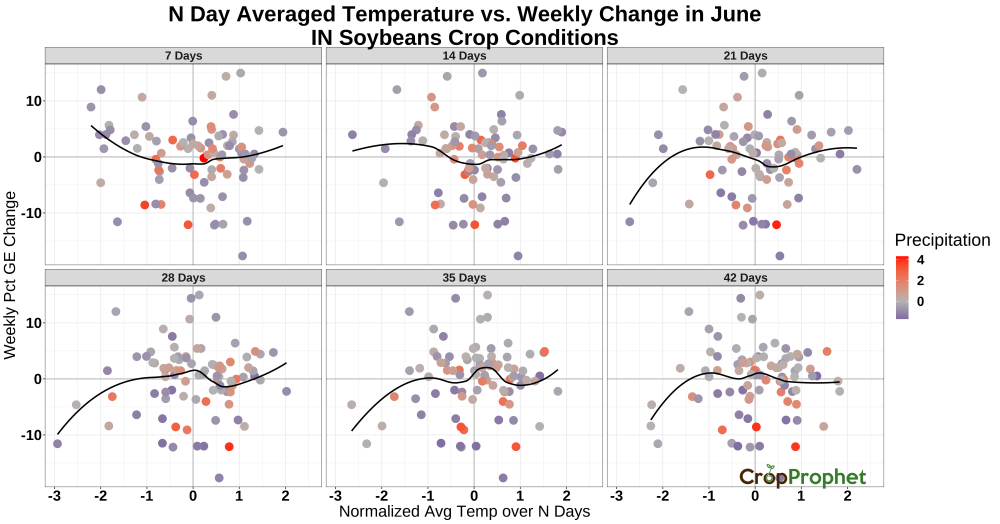
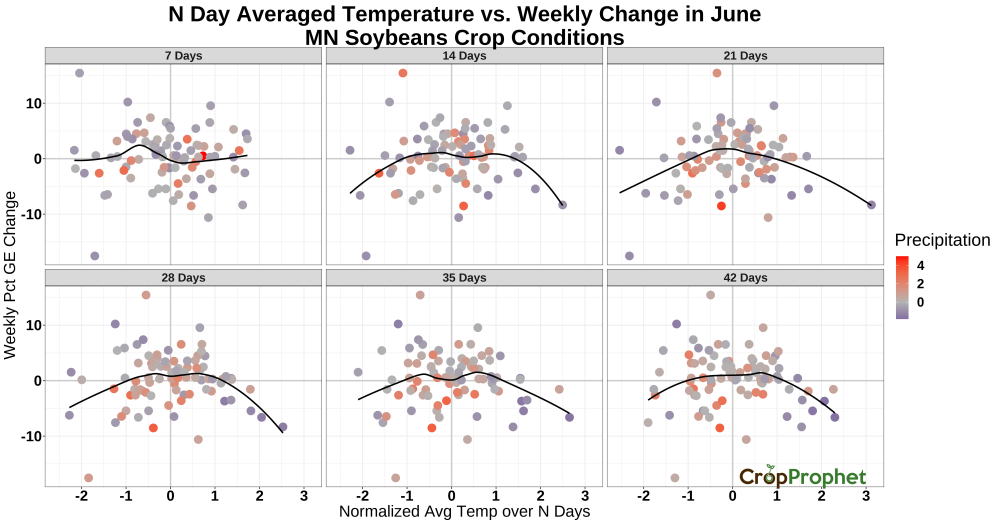
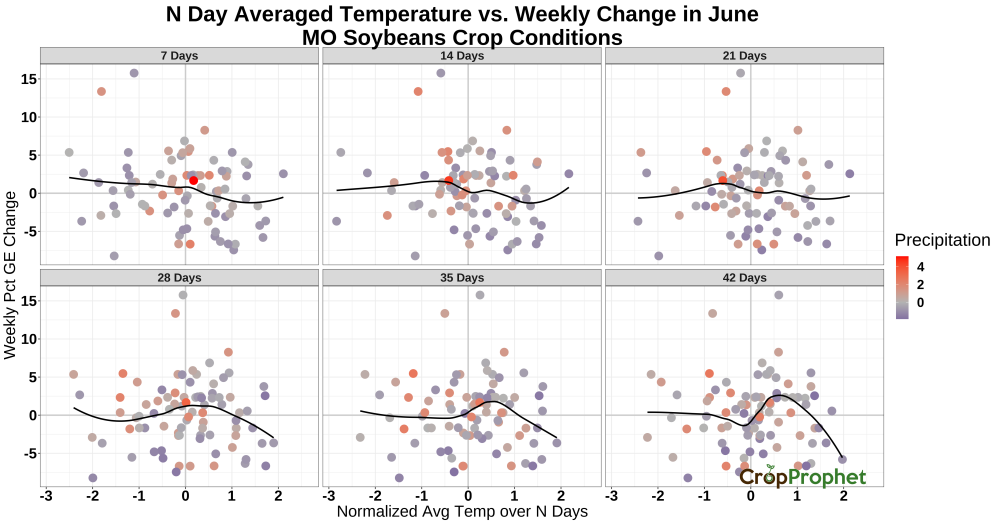
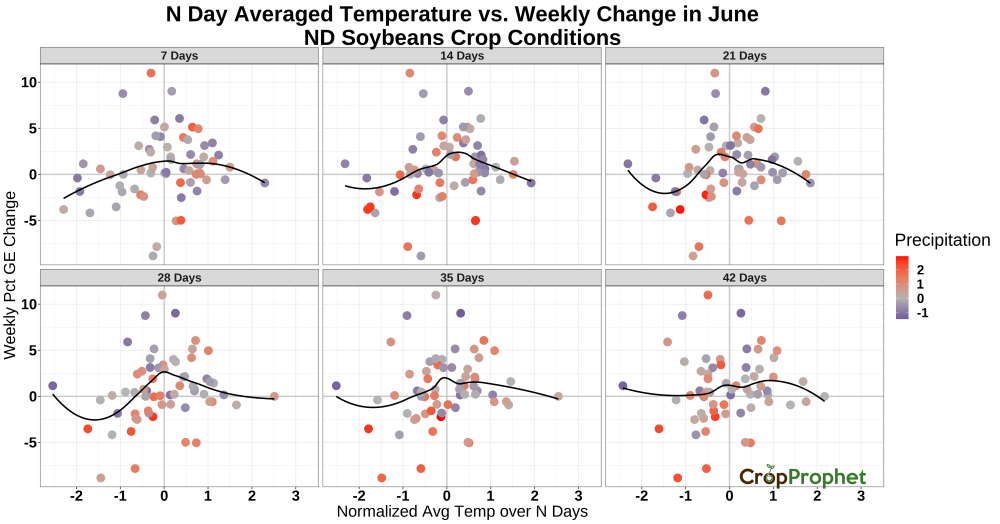
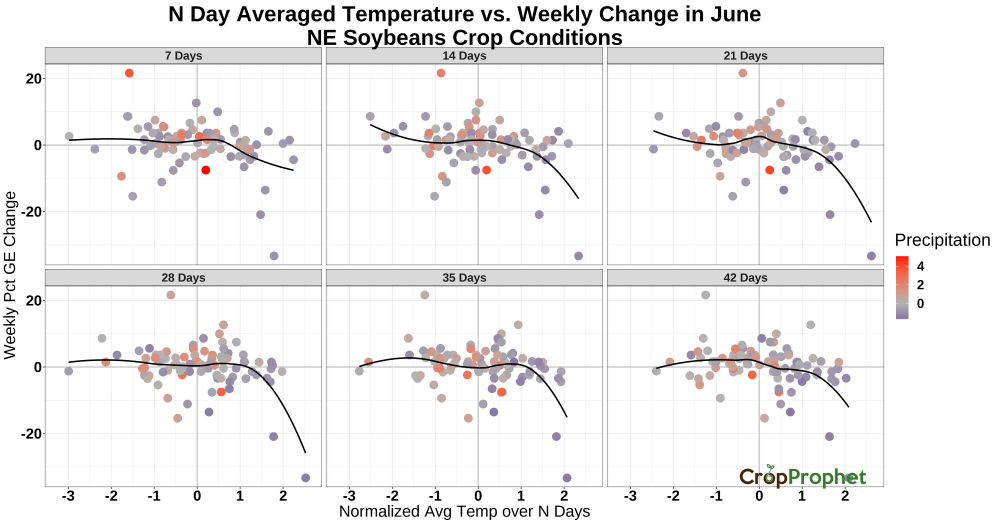
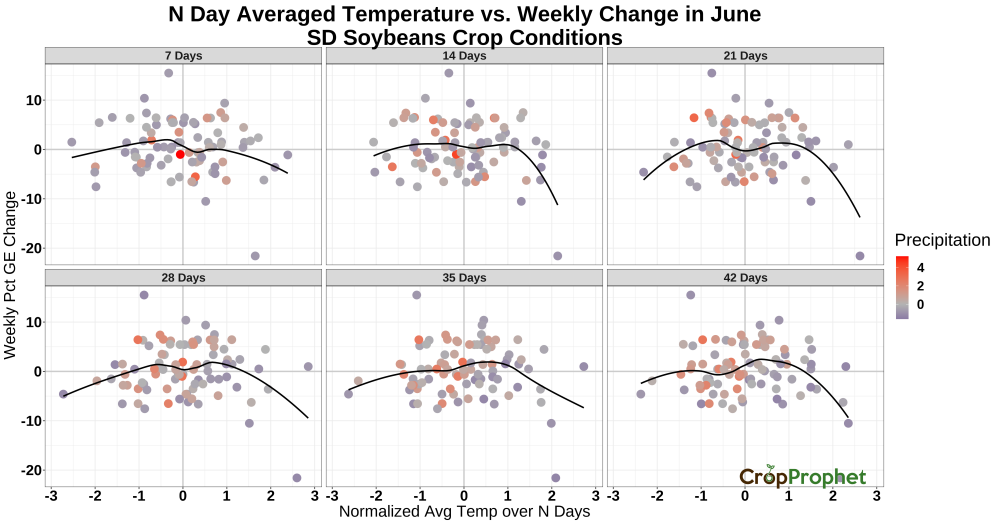
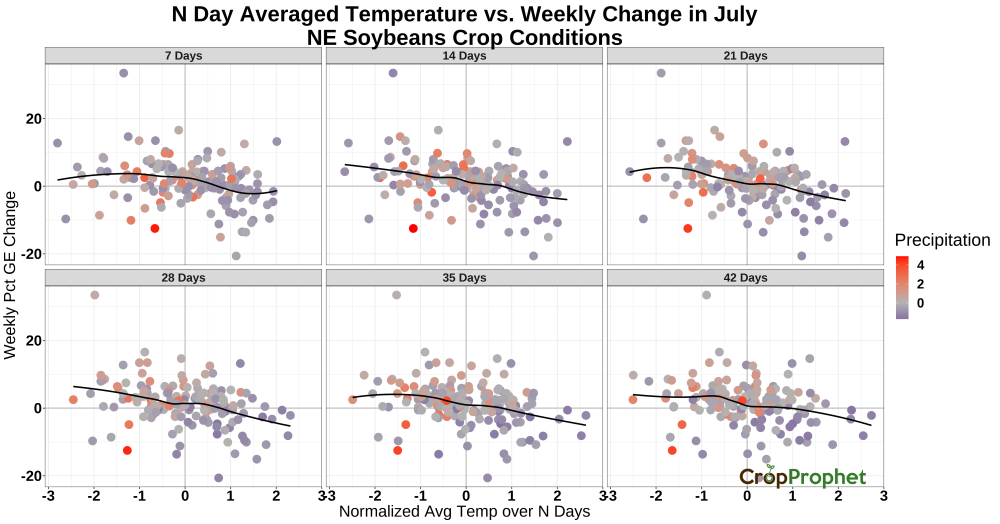
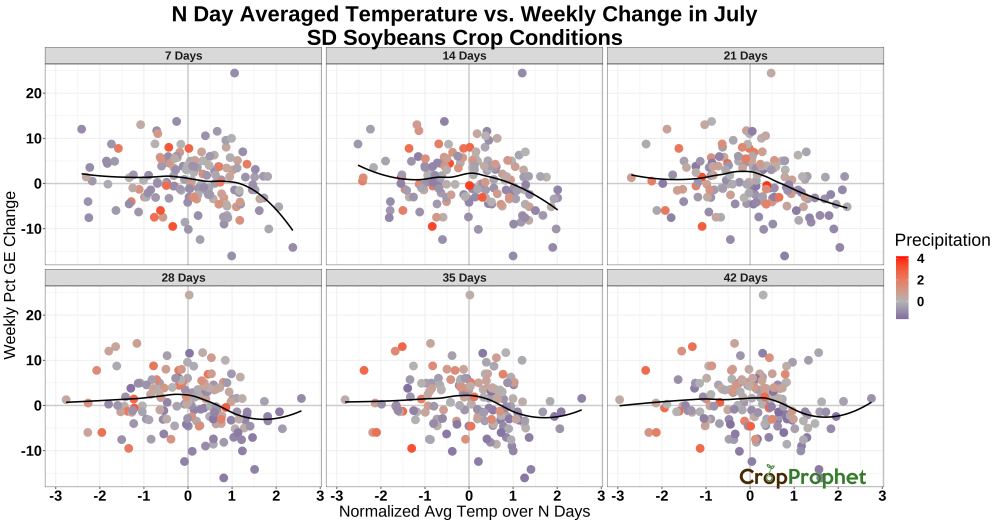
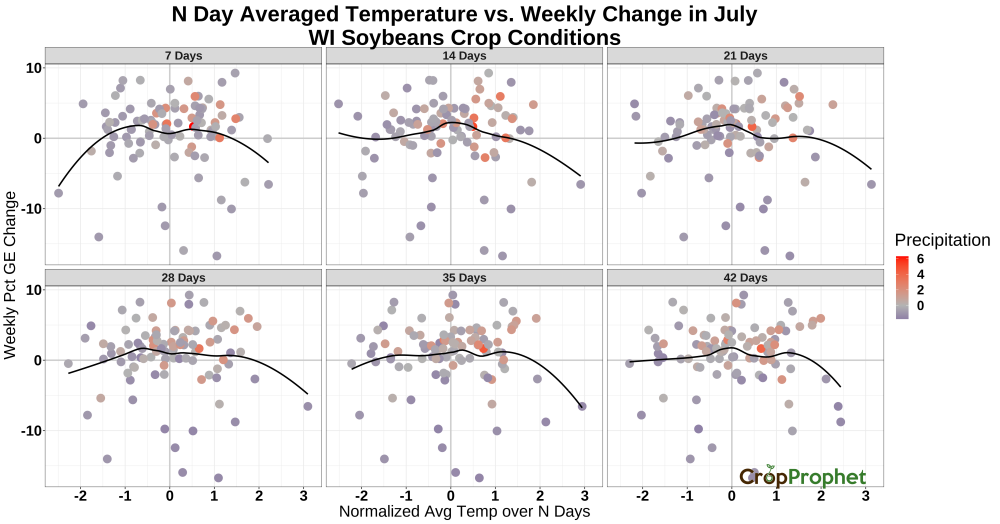
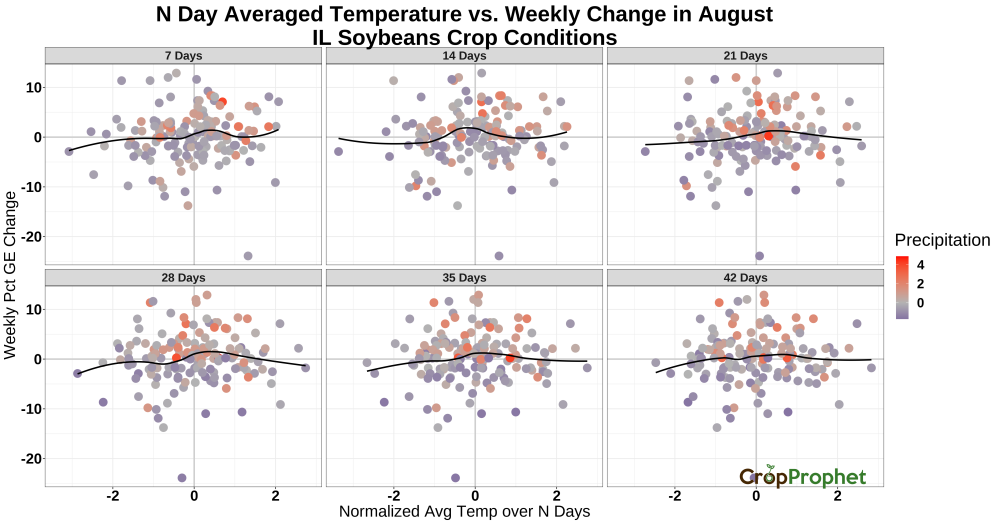
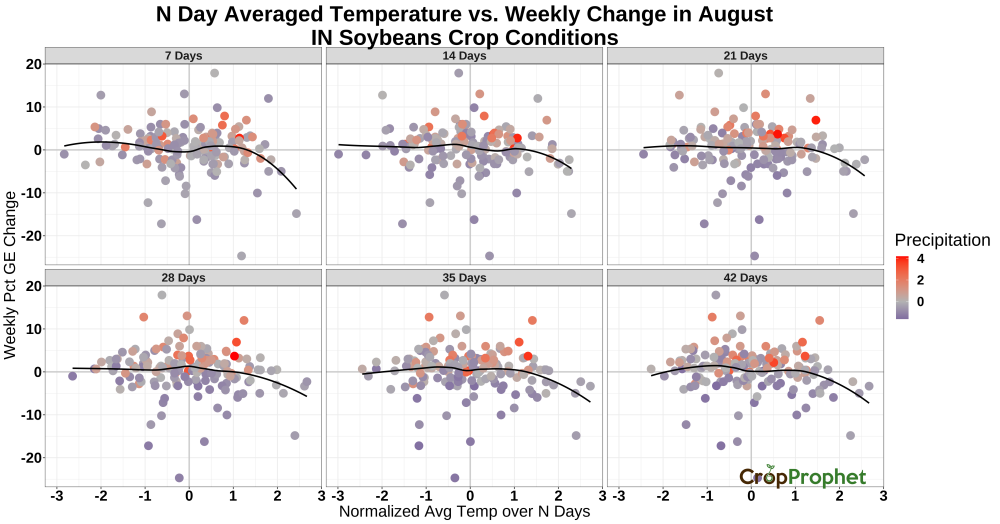
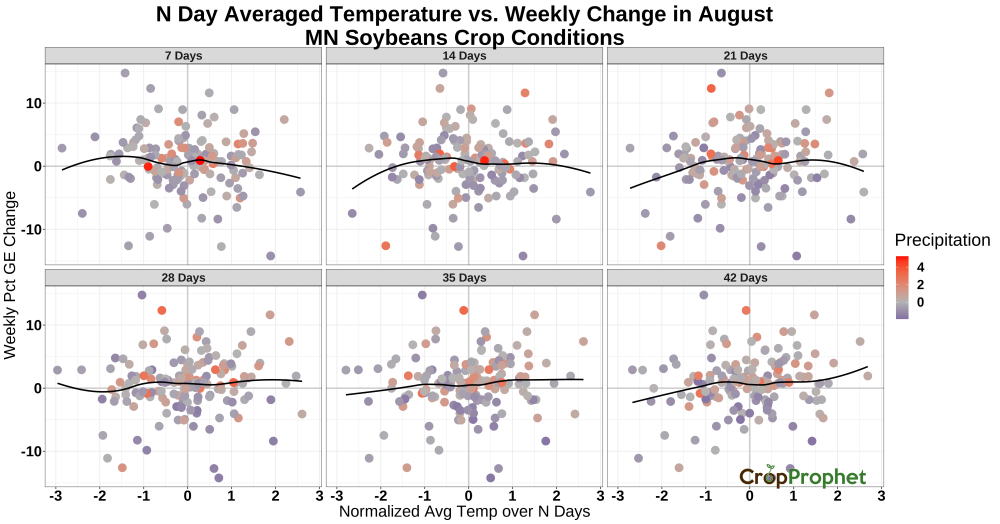
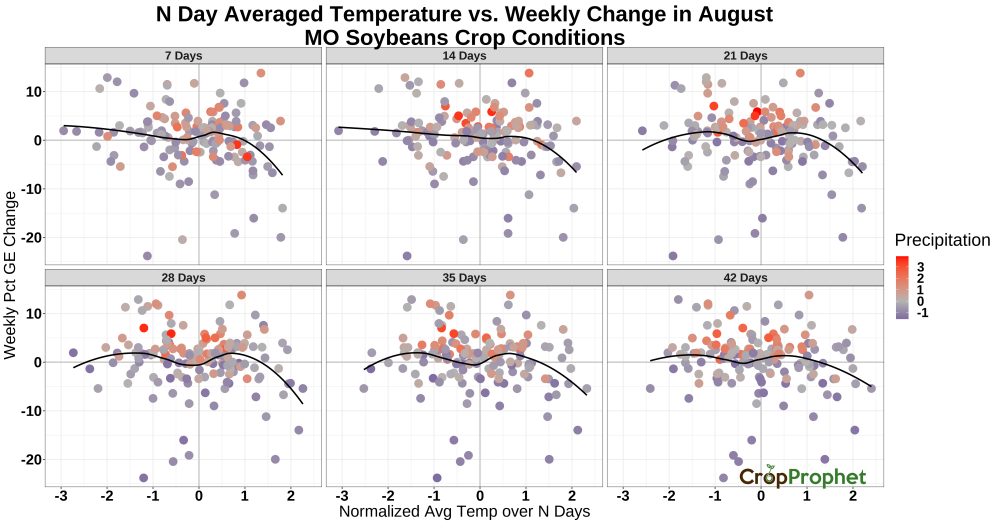
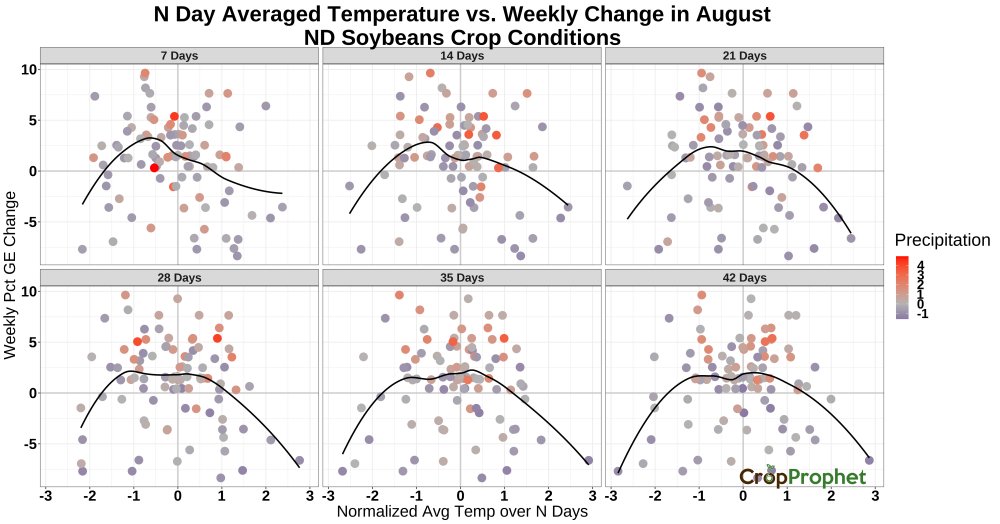
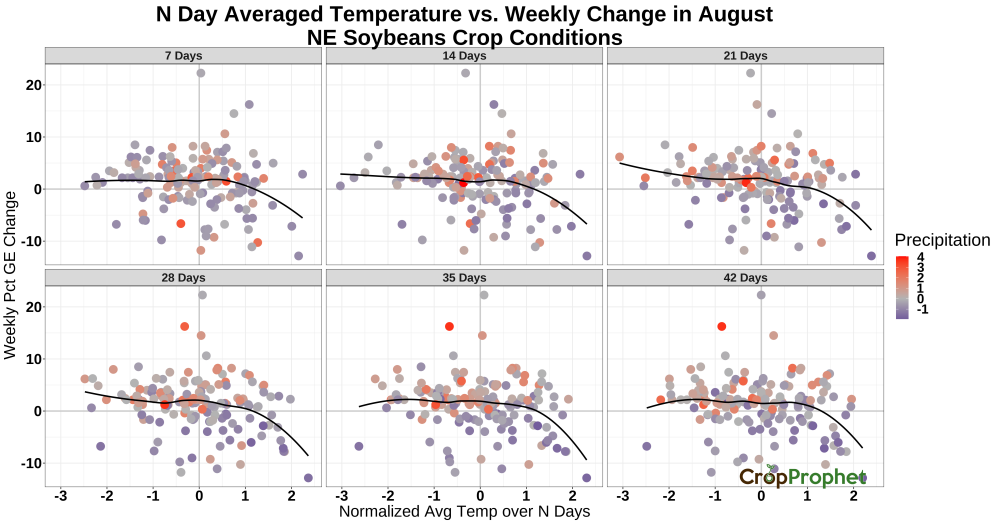
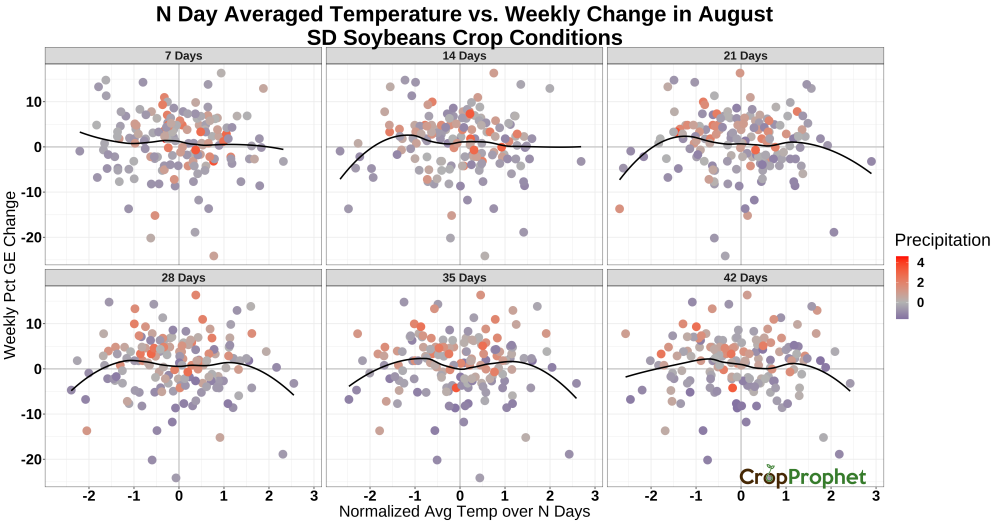
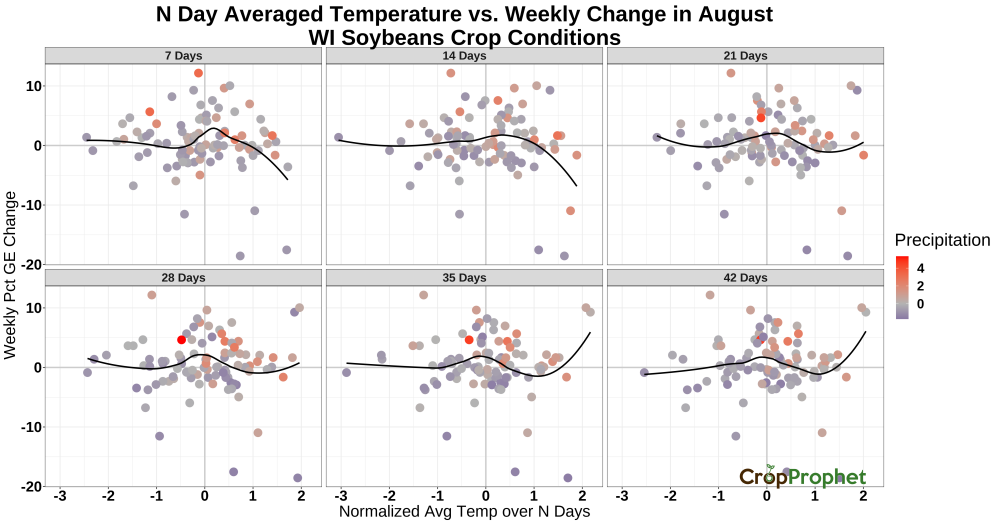
To demonstrate the full data analysis for each averaging period, Figure XX below shows the impact of corn production weighted precipitation calculated as normalized daily accumulated values from seven to 45 days before the crop condition report. The x-axis shows normalized average precipitation, while the y-axis shows the weekly change of good + excellent crop ratings in July crop condition reports from 1986 to 2021.
Each plot includes a line fit through the data using LOESS (locally estimated scatterplot smoothing) regression. This method uses only nearby points to find, in effect, the moving average along the normalized weather variable values (i.e., the x-axis).
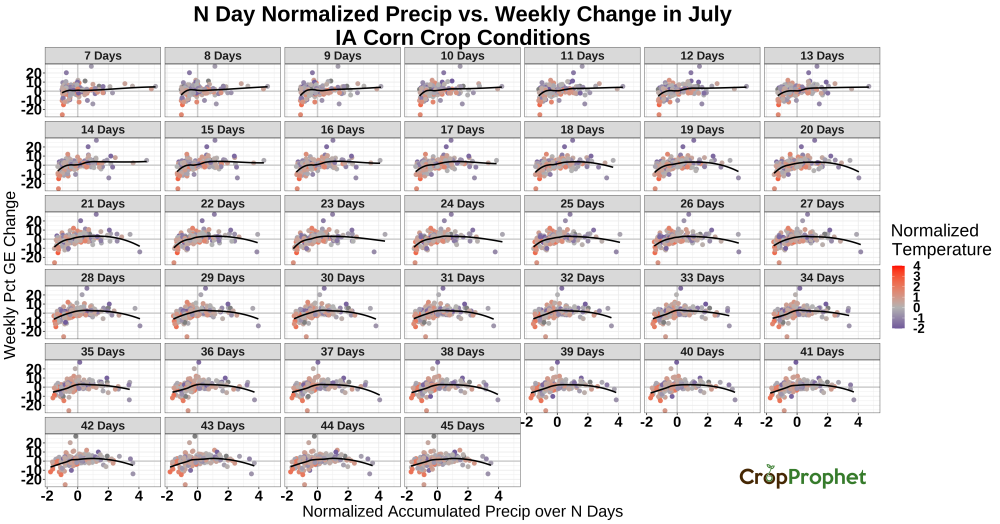
We see in Figure 5 that short time averages (i.e., seven to ten days) suggest that low precipitation in the week before the crop condition report is causing declines in the ratings. This relationship becomes much clearer by about the 20-day averages. The data indicates, which should come as no surprise, that both too little and too much precipitation can cause declines in the July Iowa crop ratings.
Showing each averaging period is overkill. In the graphics available below, we limit to the averaging periods to increments of 7-days.
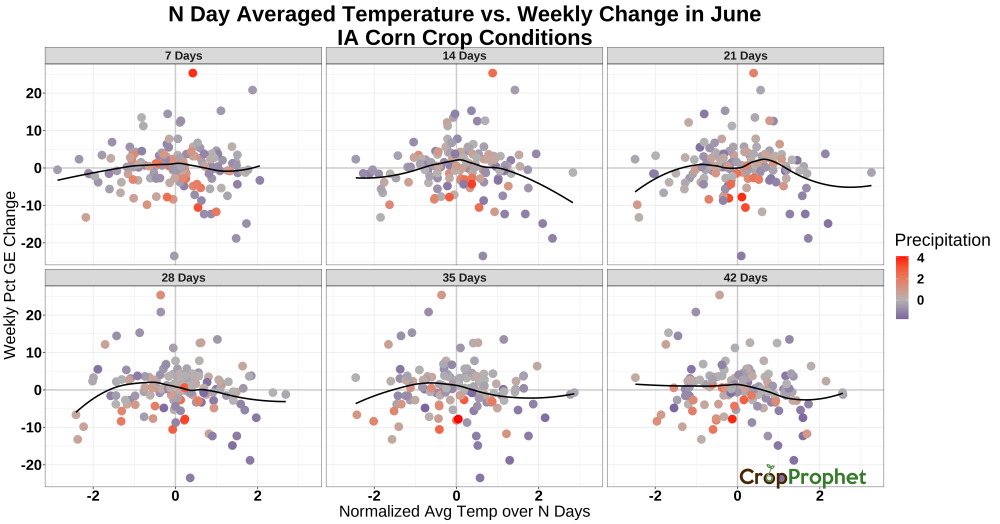
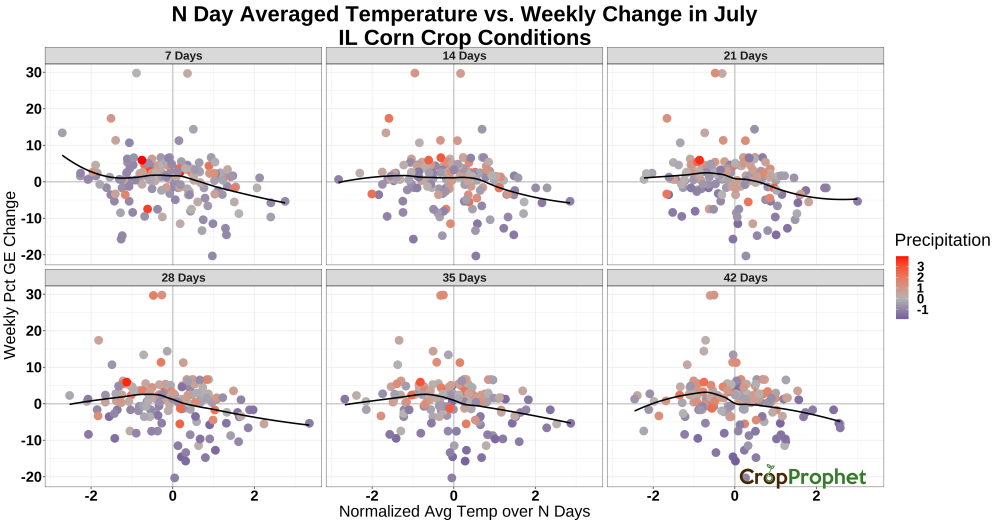
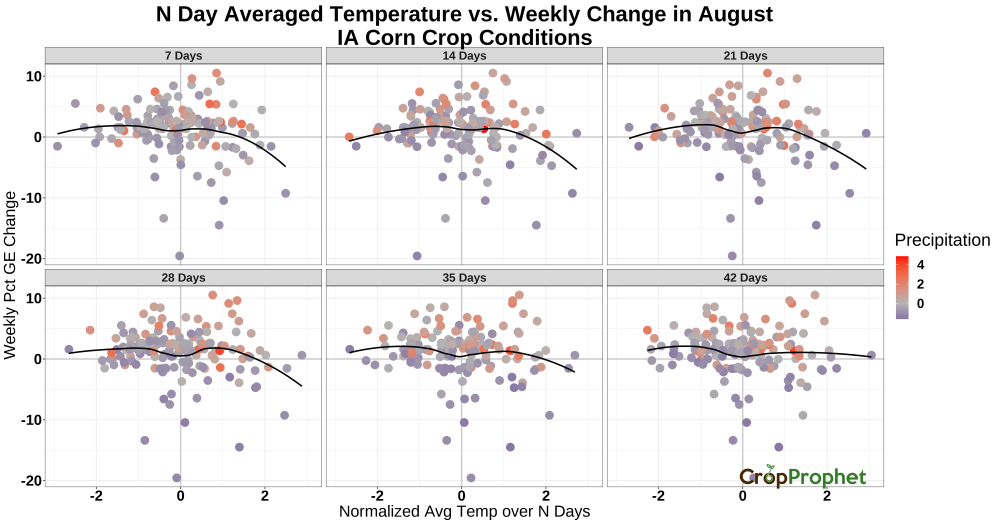
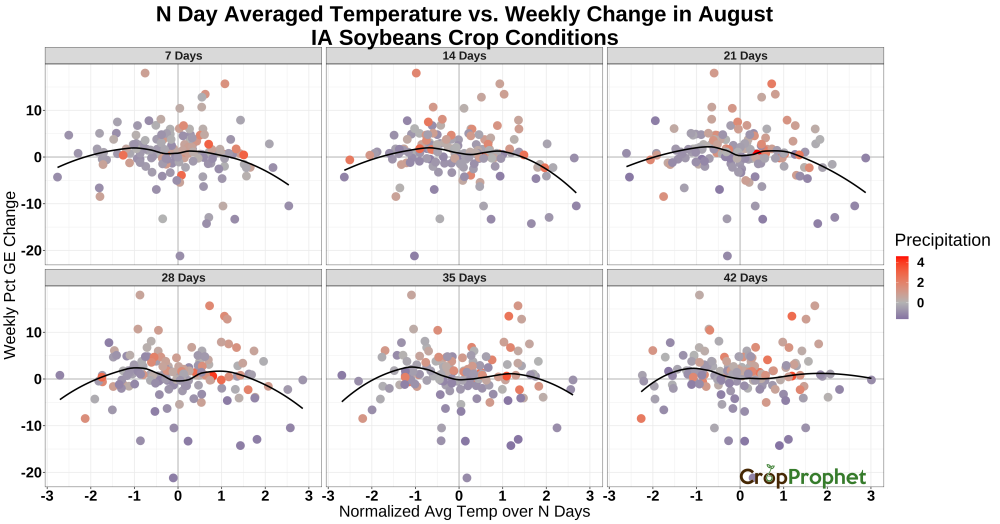
Crop Condition Reports – Impact of Temperature
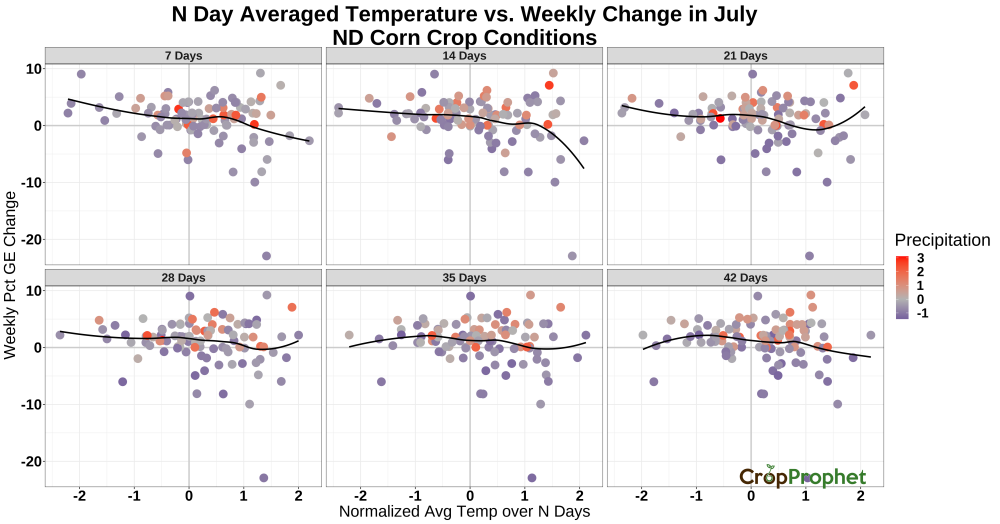
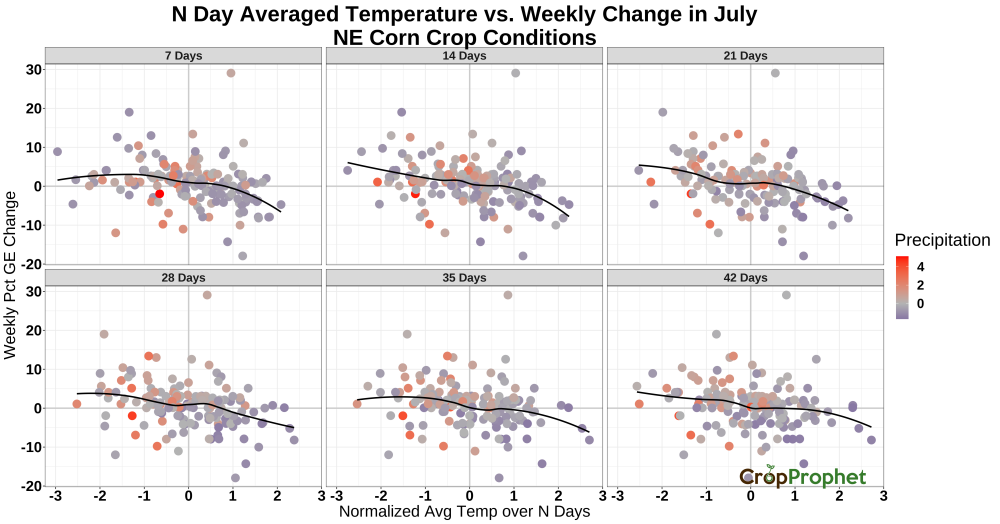
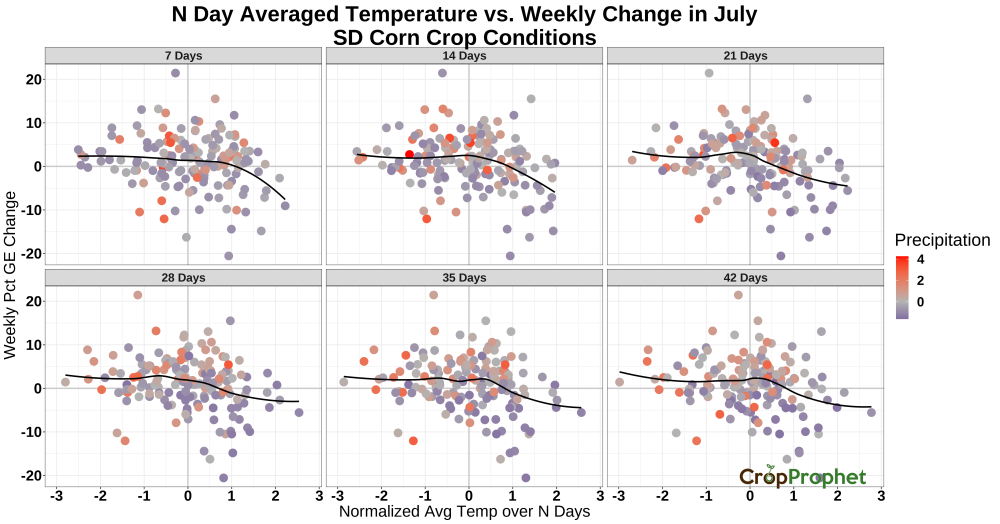
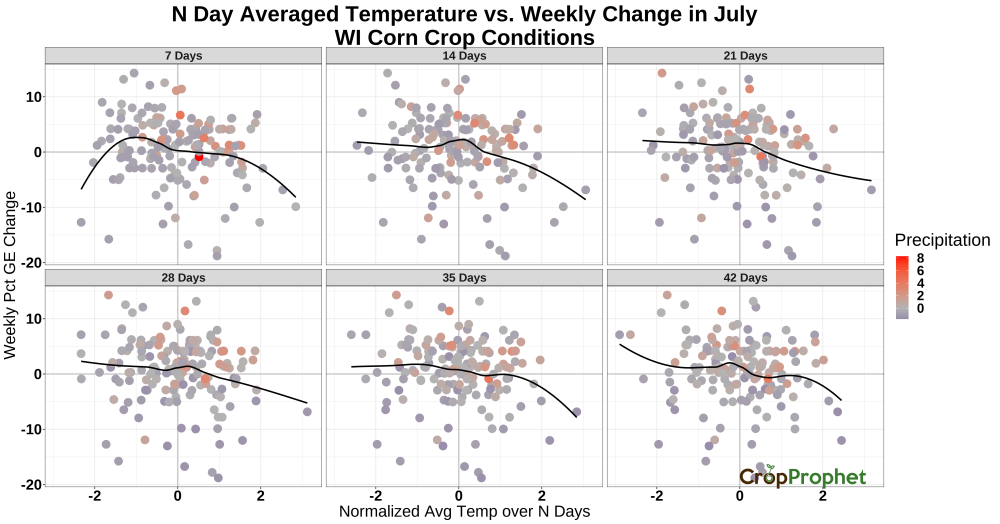
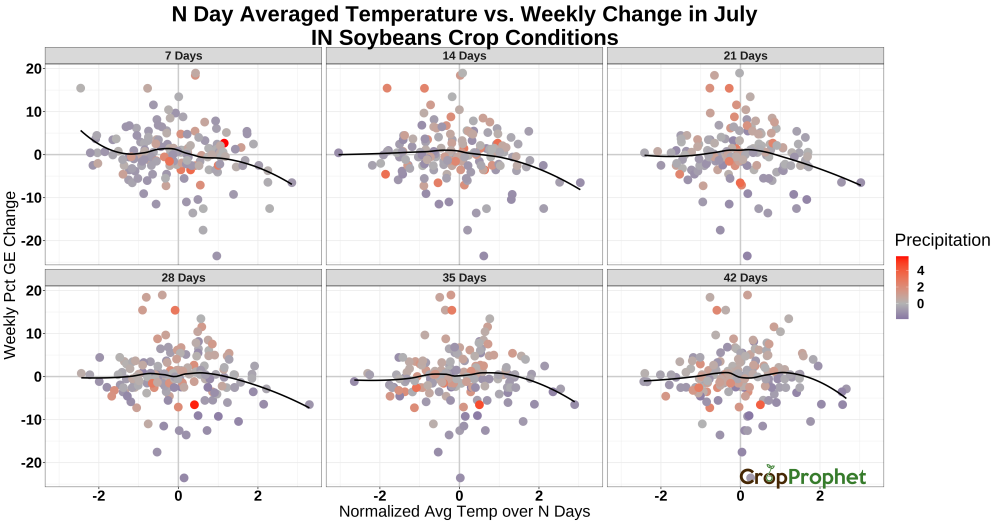
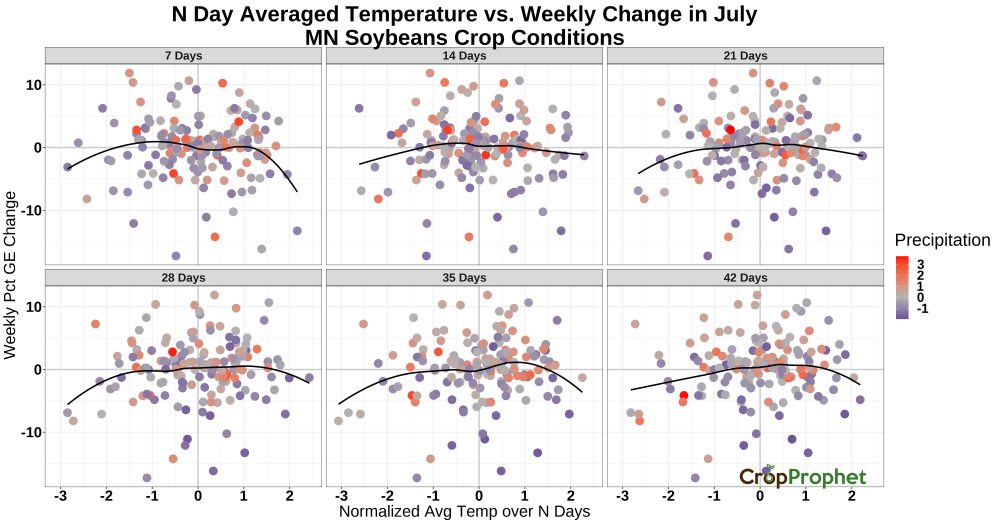
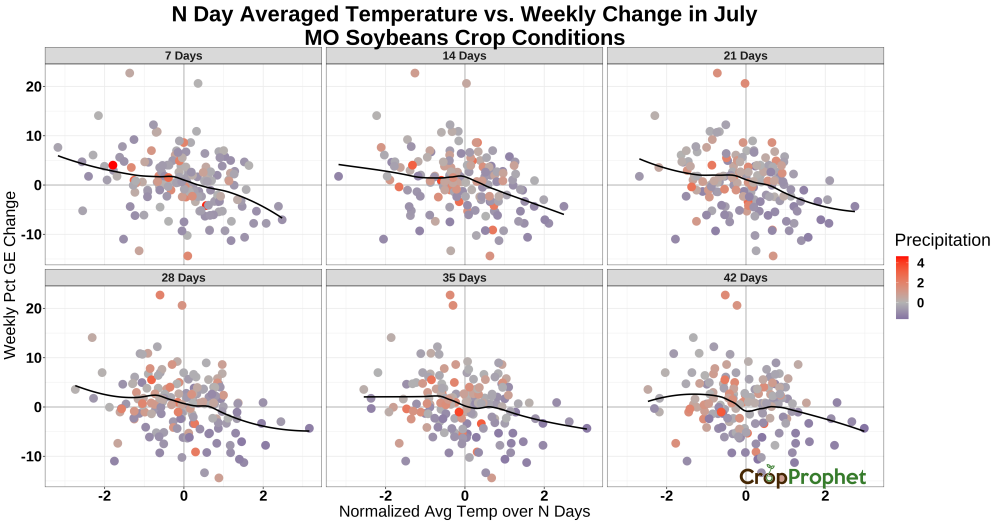
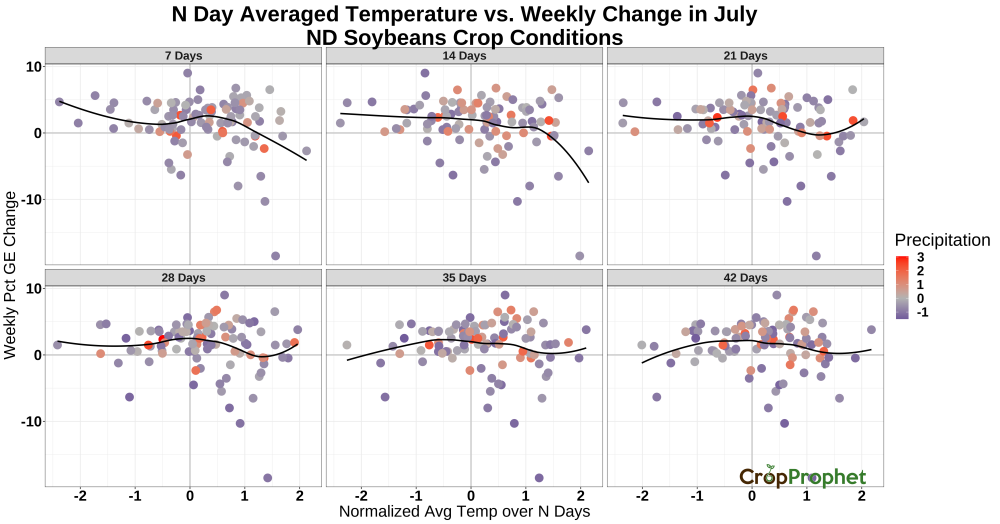
To mirror the Iowa July precipitation corn crop condition reports above, the temperature analysis is presented in Figure 6, but in only 7-day increments.
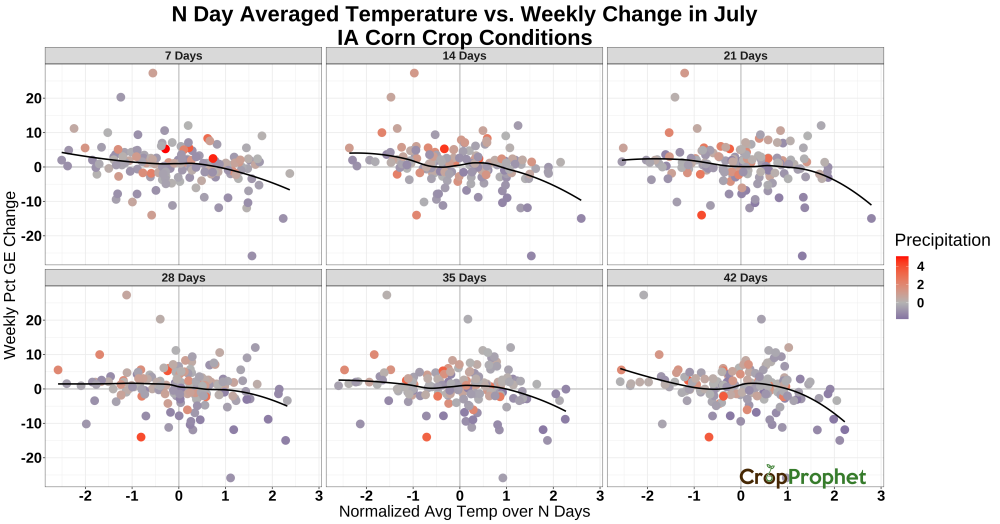
Figure 6 suggests the impact of temperature is not as significant as the impact of precipitation, at least for July. However, the 42-day average temperature graphic suggests that temperatures around two standard deviations above normal are responsible for declines in the corn crop condition reports. The dot in each graphic is colored according to the normalized precipitation anomaly for the same accumulation period. The 42-day average graphic also indicates relatively low precipitation during periods of high temperatures. The impact of weather on crop conditions is certainly a combination of precipitation and temperature, as described by the 42-day graphic. Additional advanced techniques are available to examine the co-relationship between temperature and precipitation but are not applied in this post.
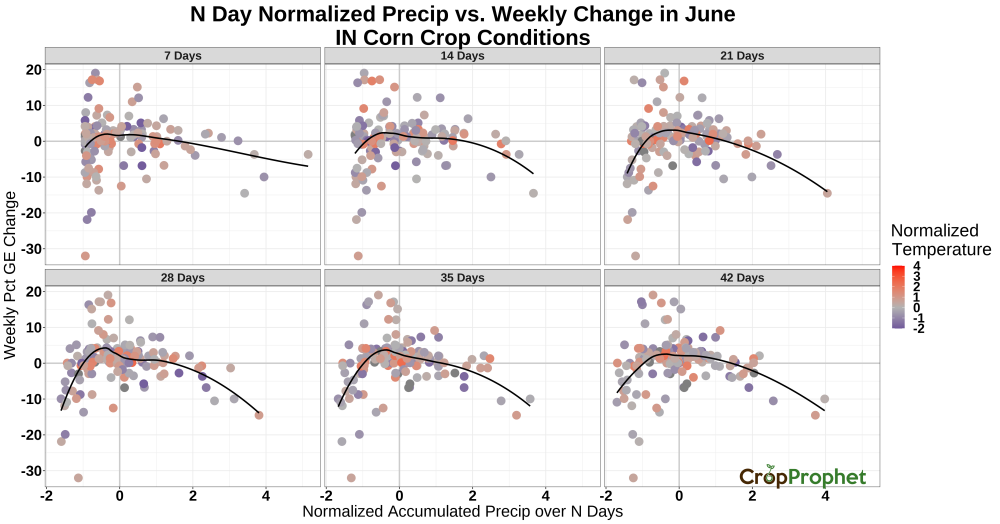
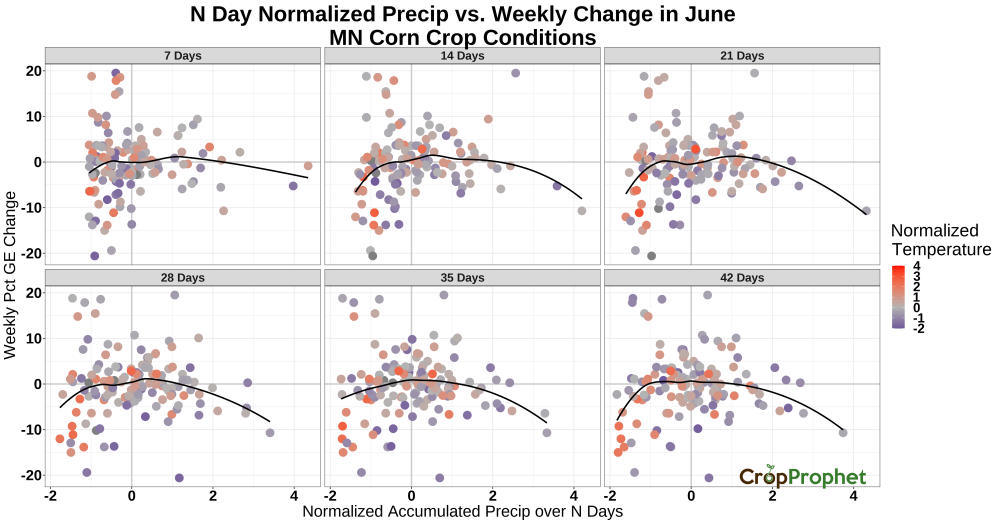
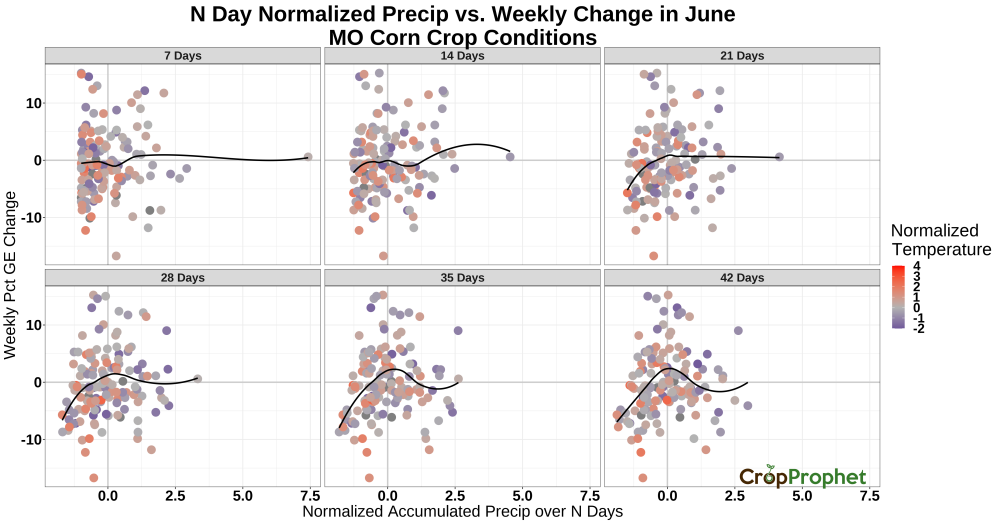
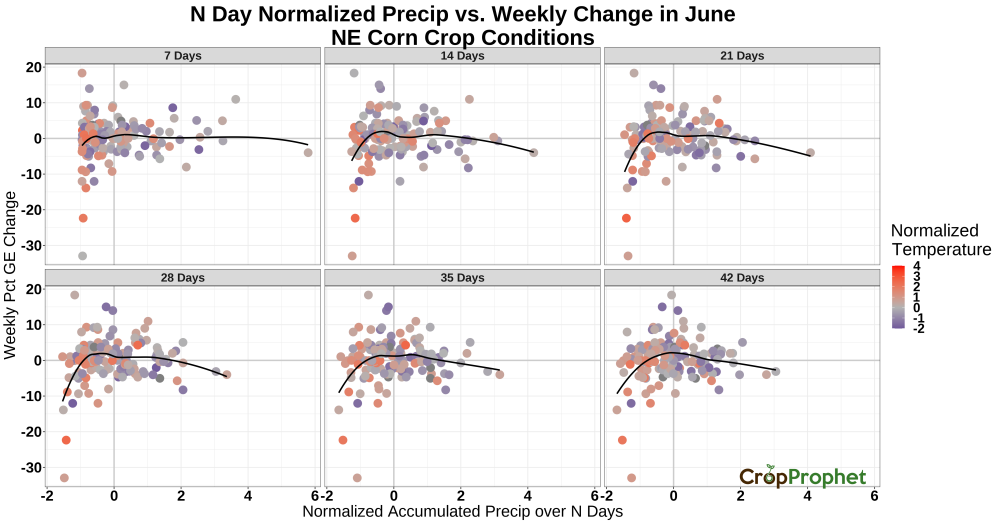
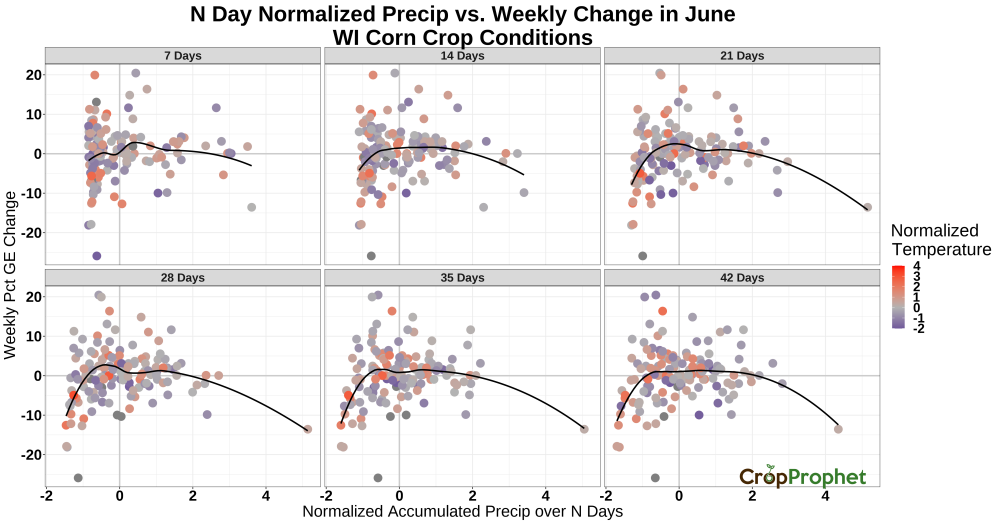
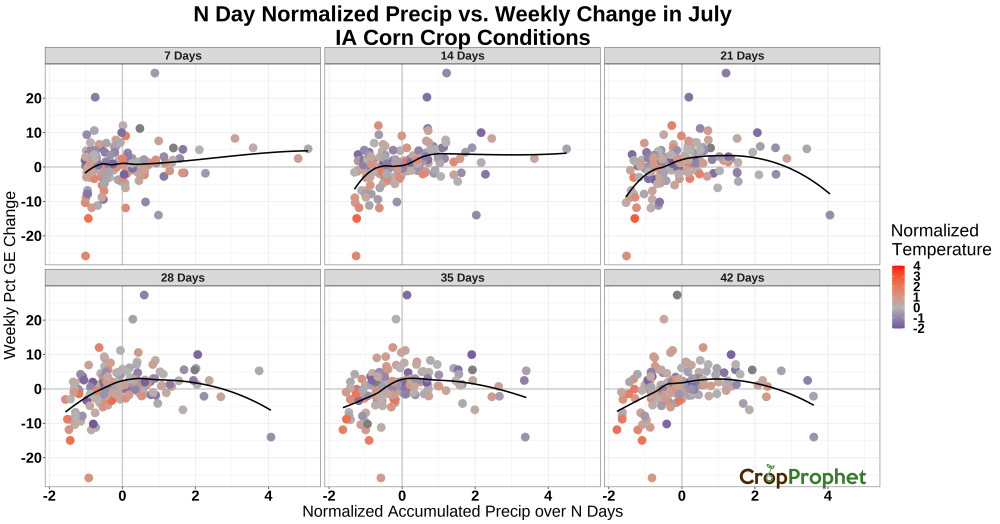
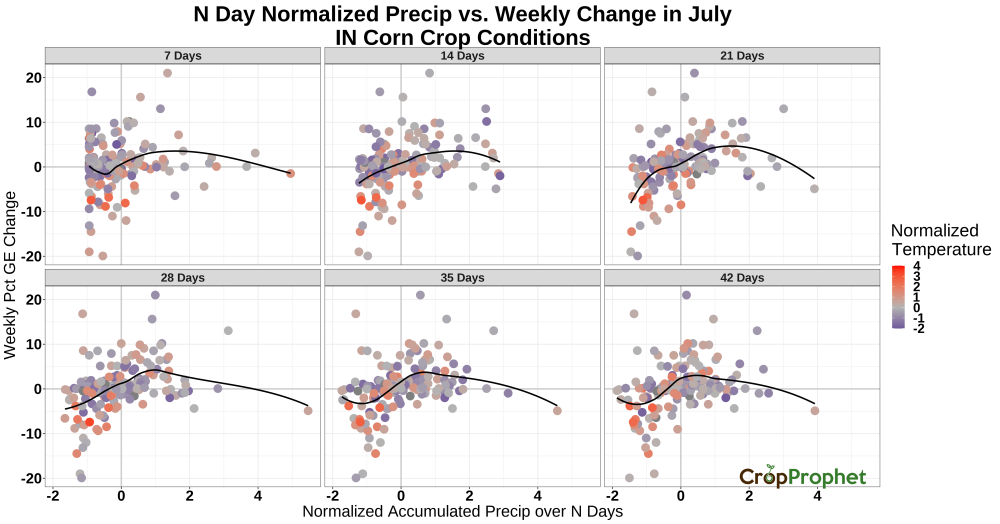
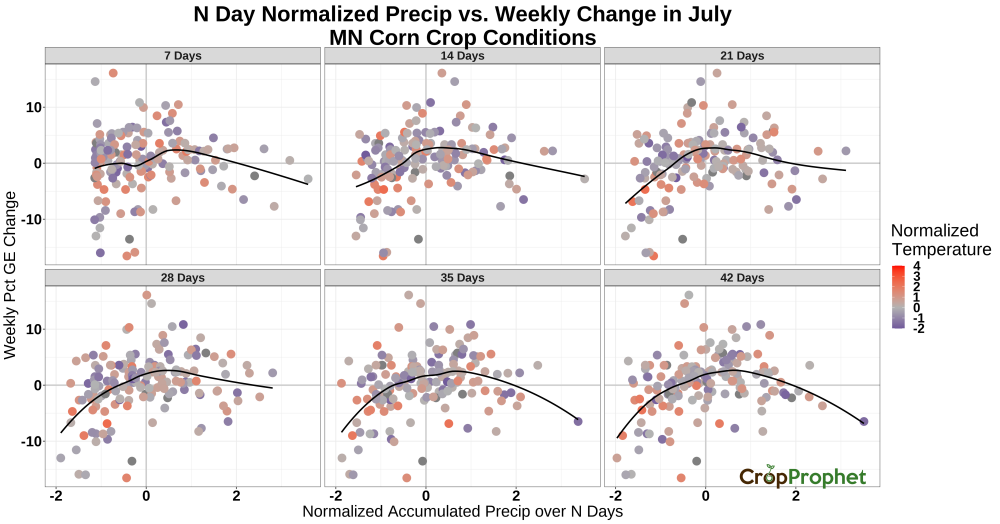
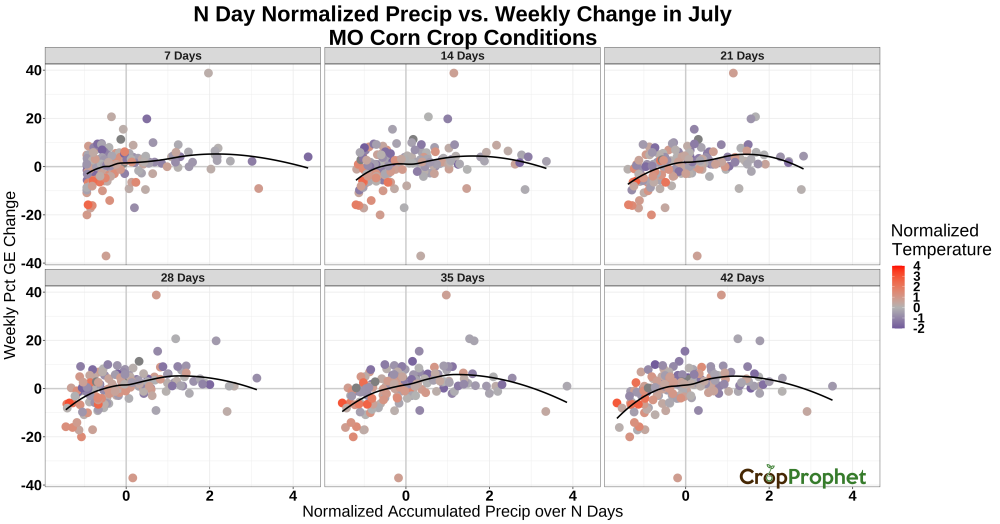
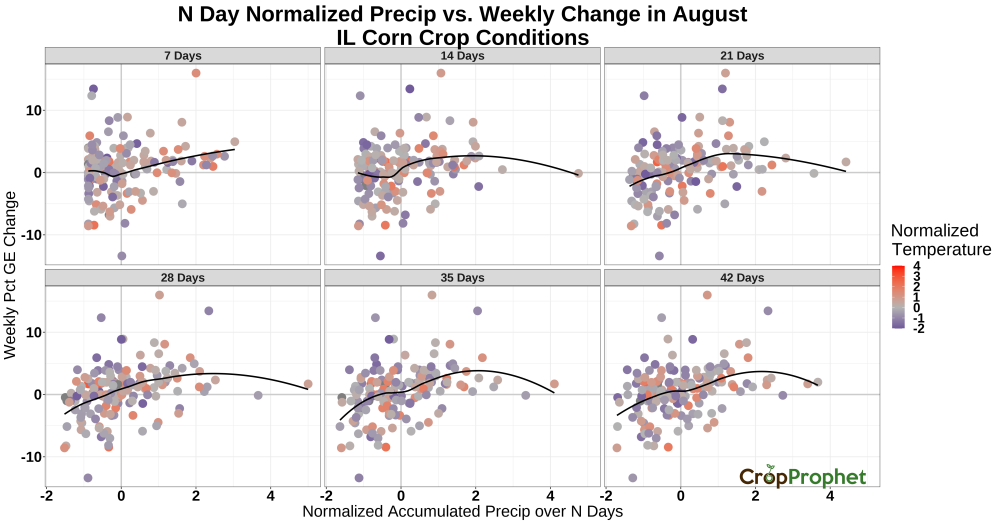
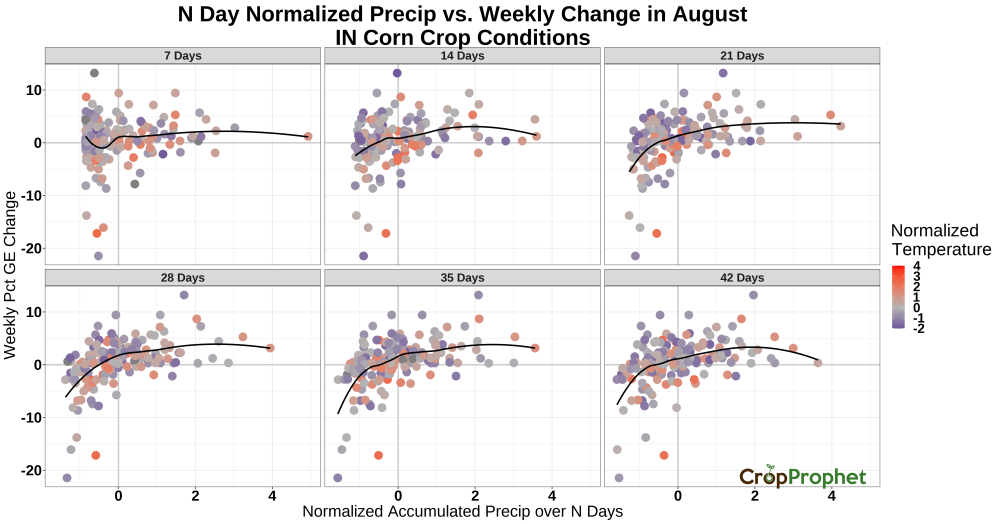
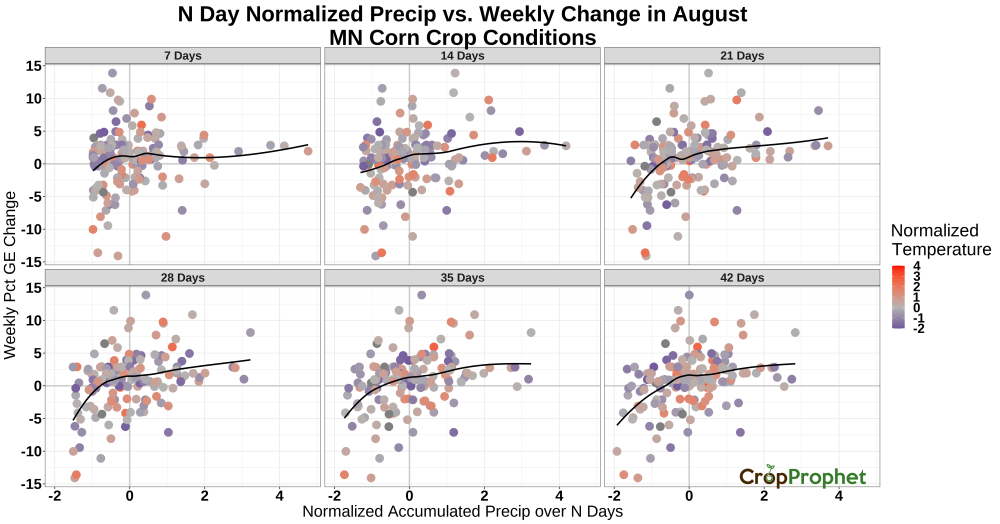
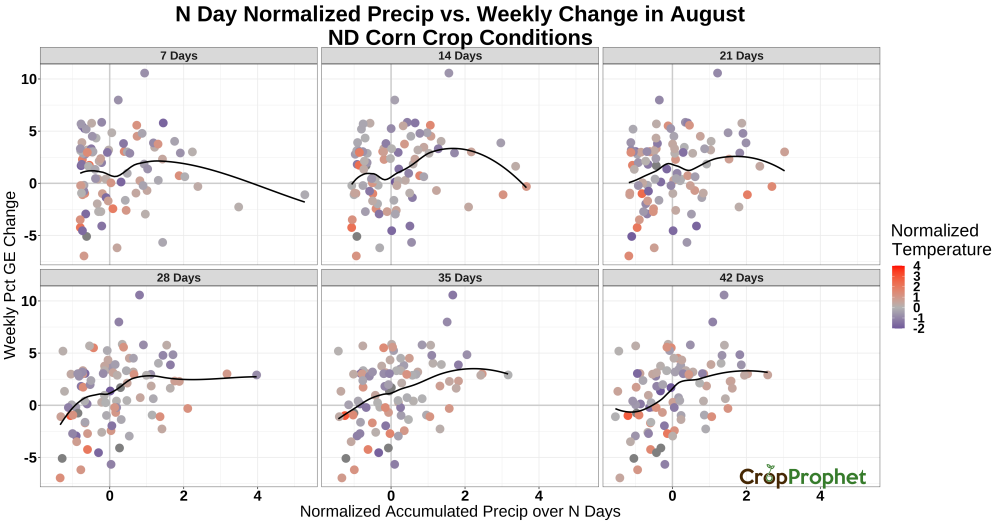
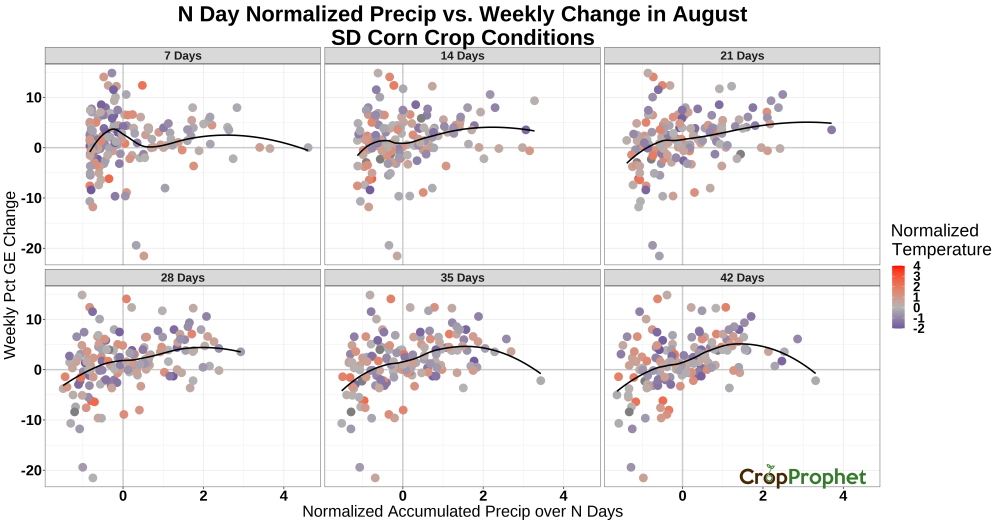
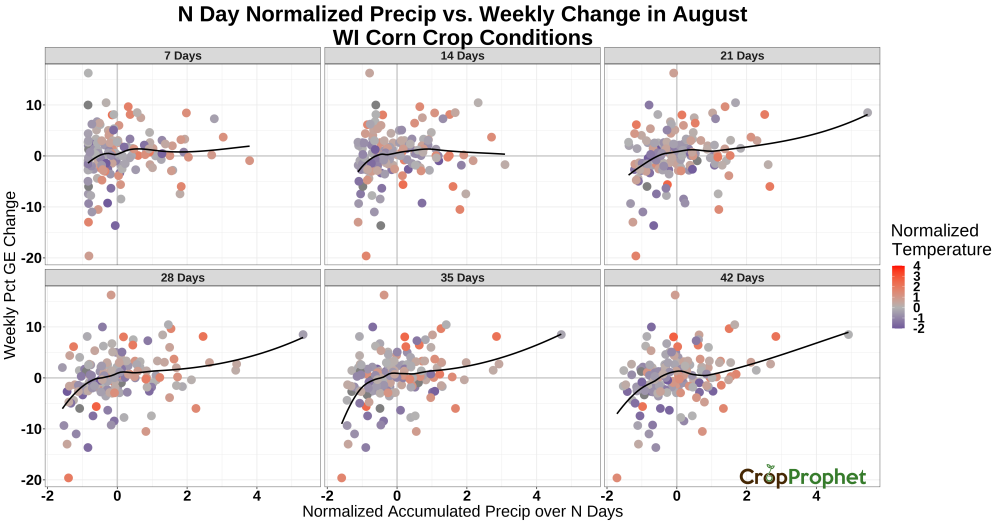
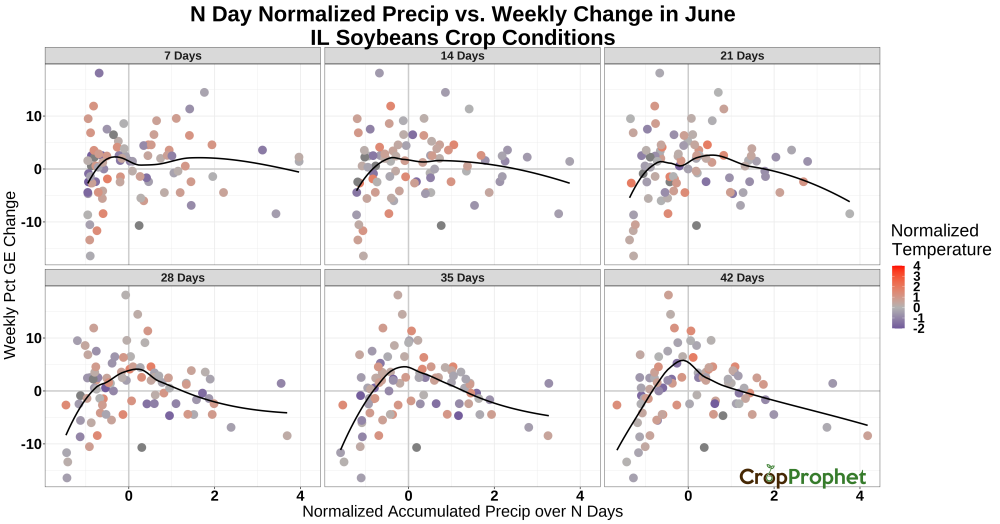
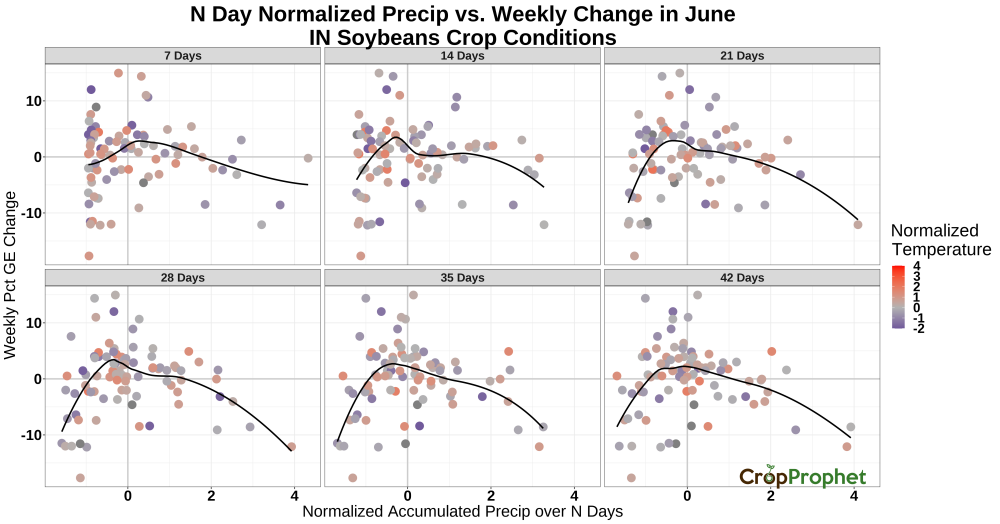
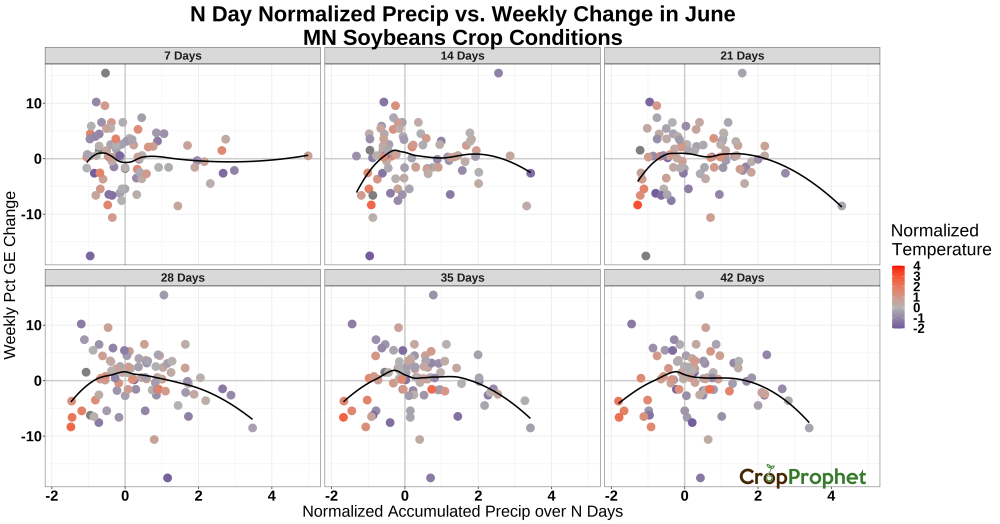
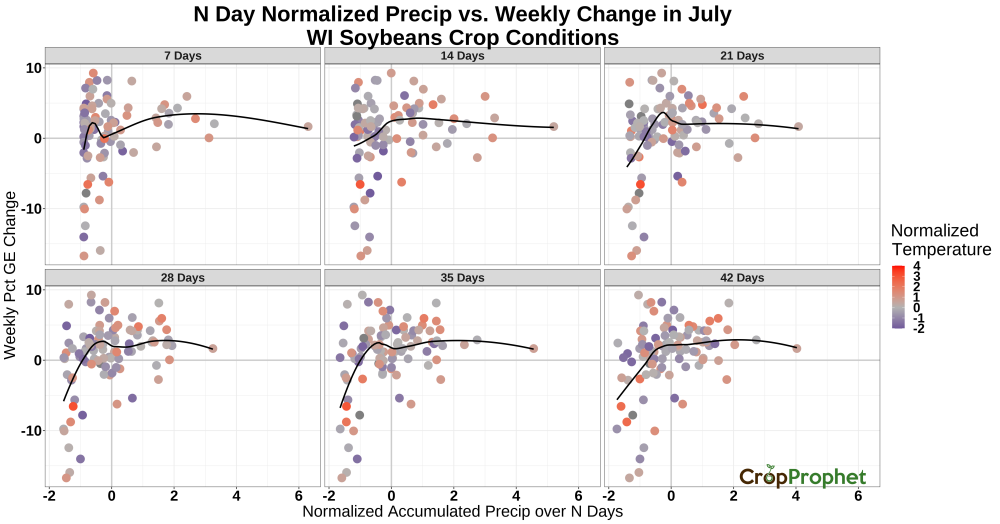
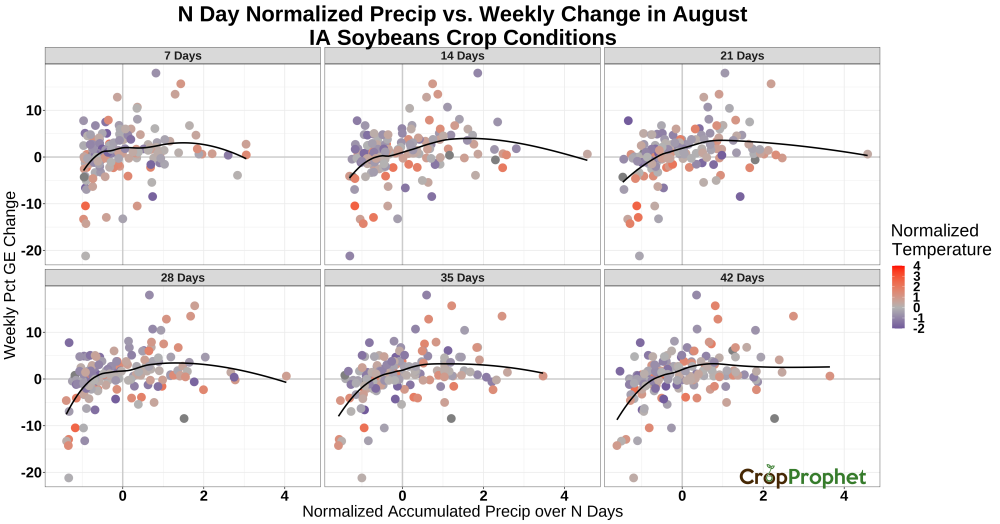
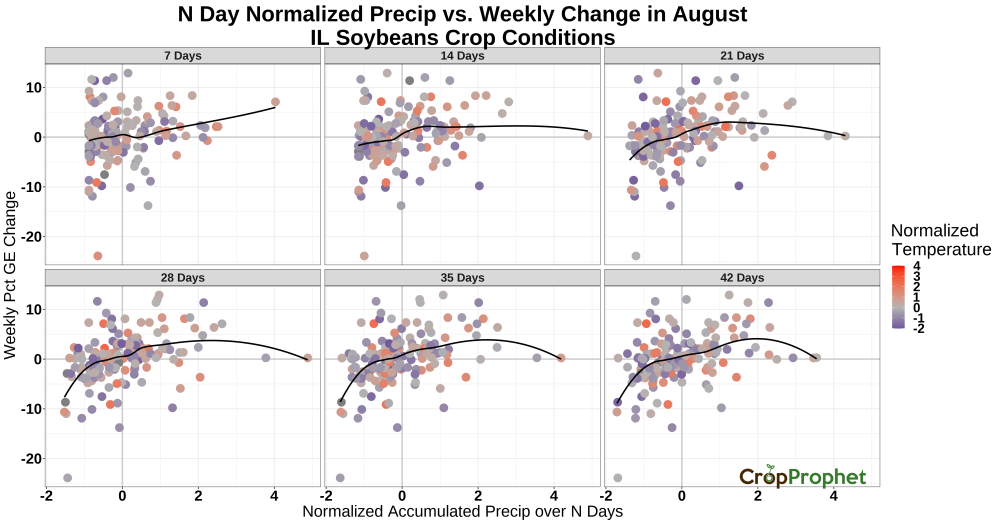
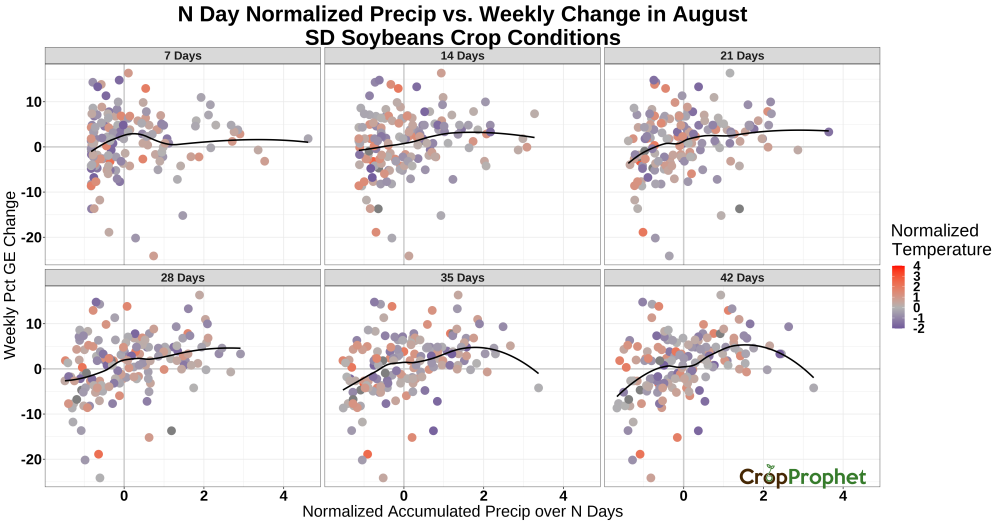
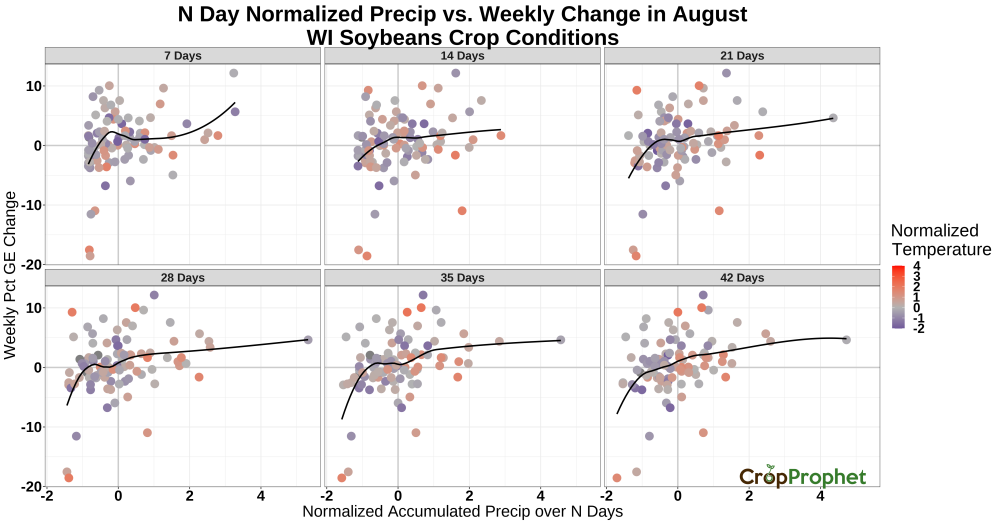
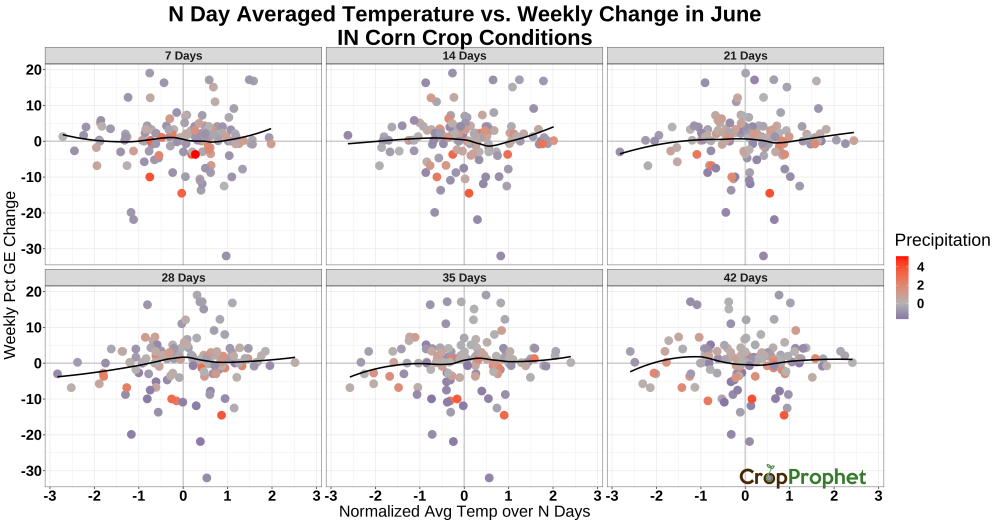
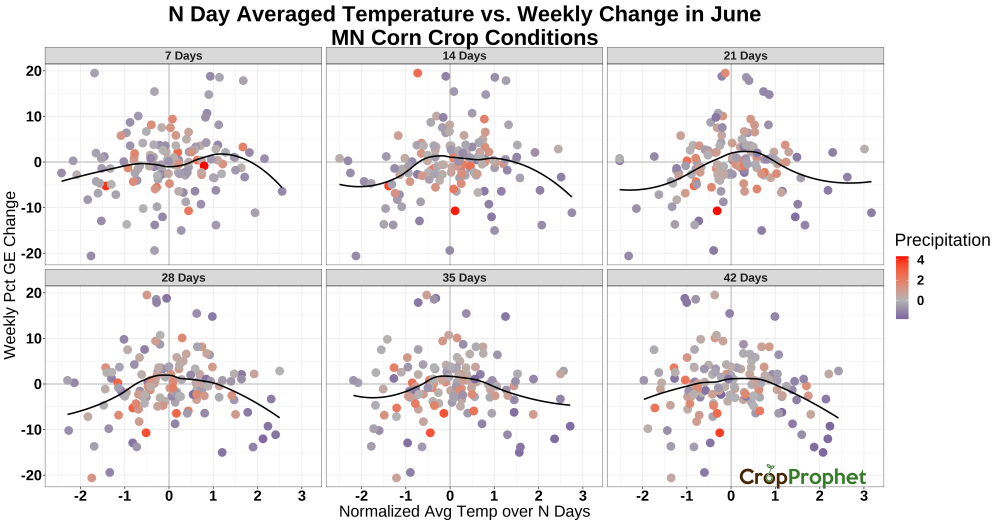
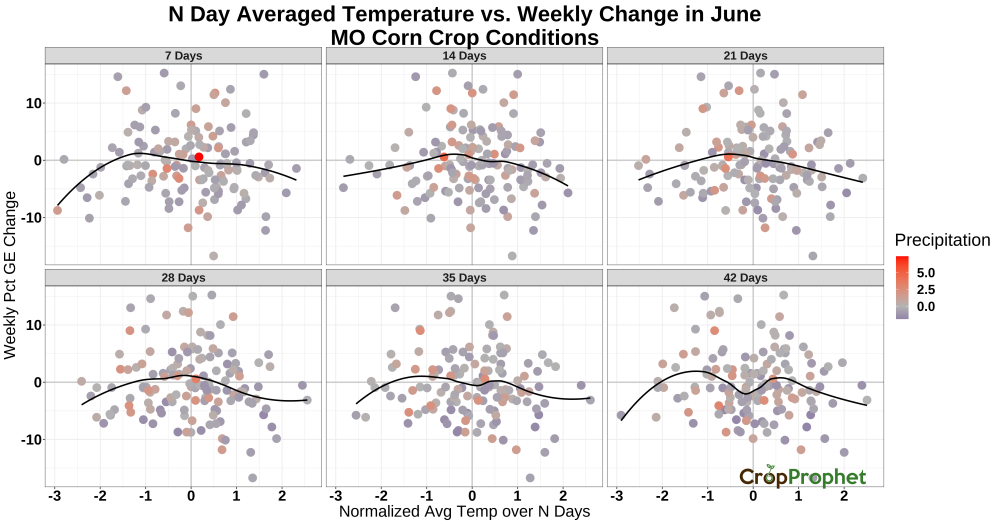
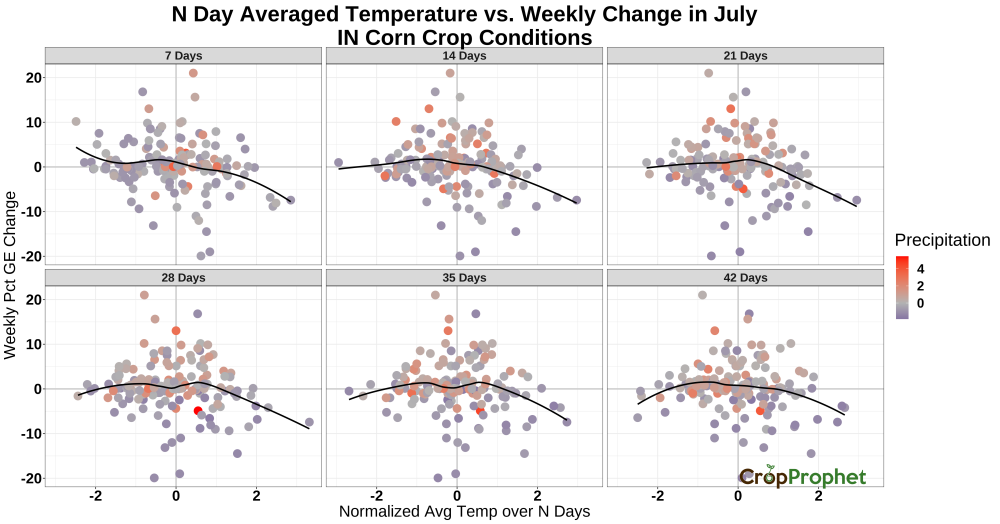
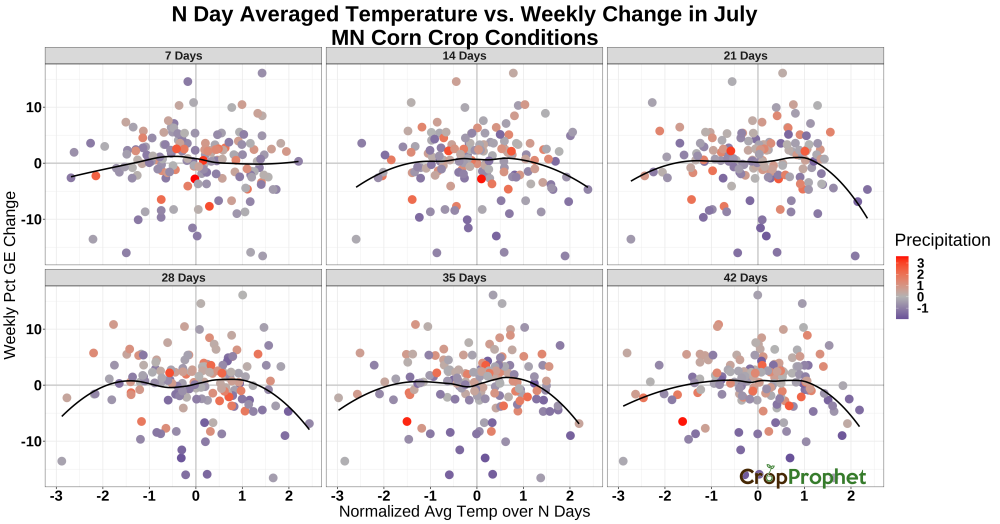
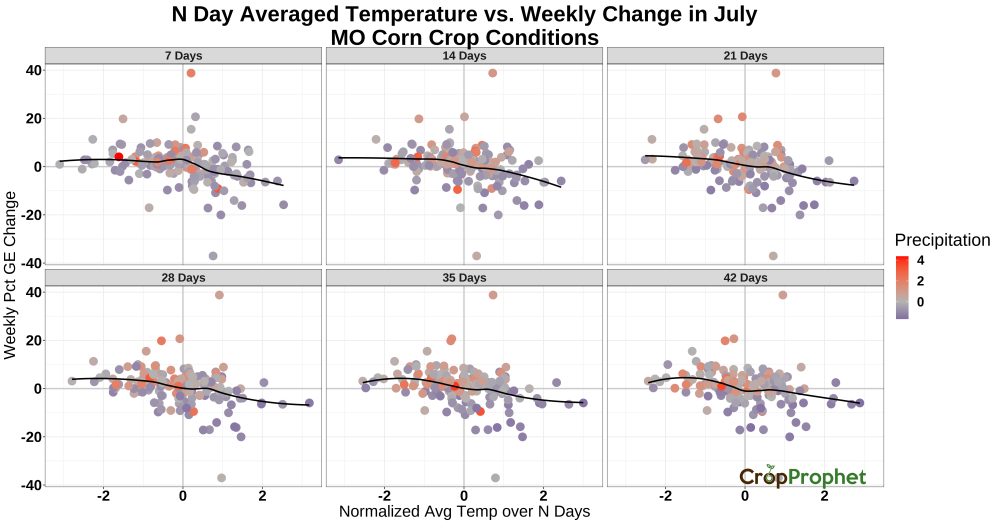
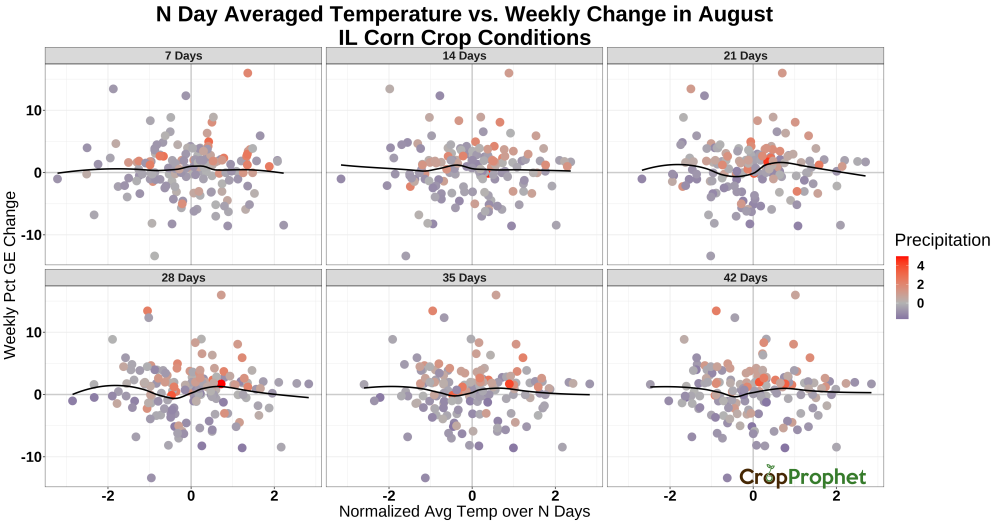
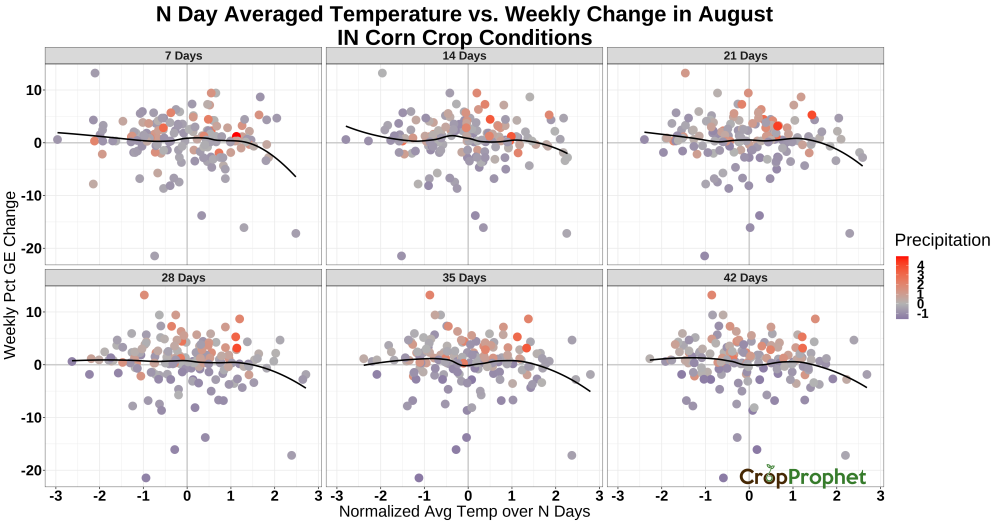
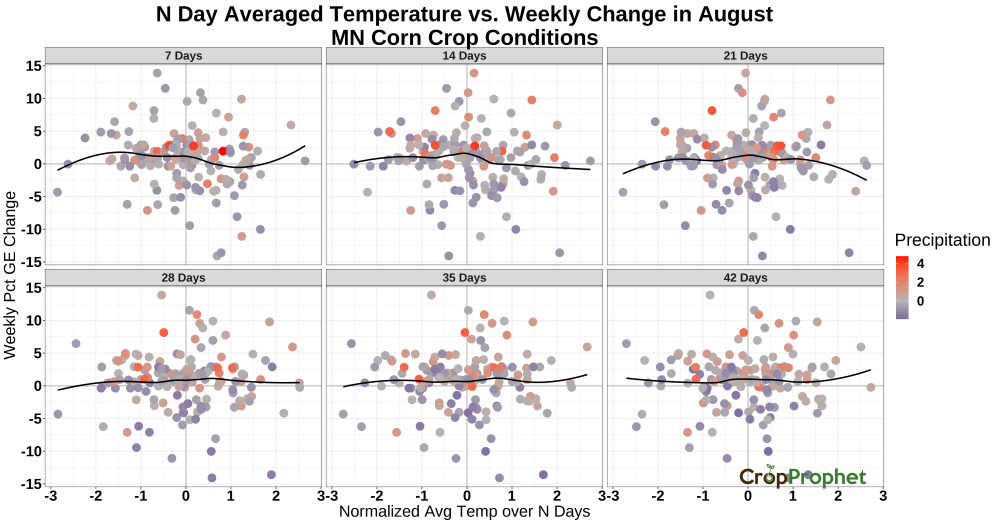
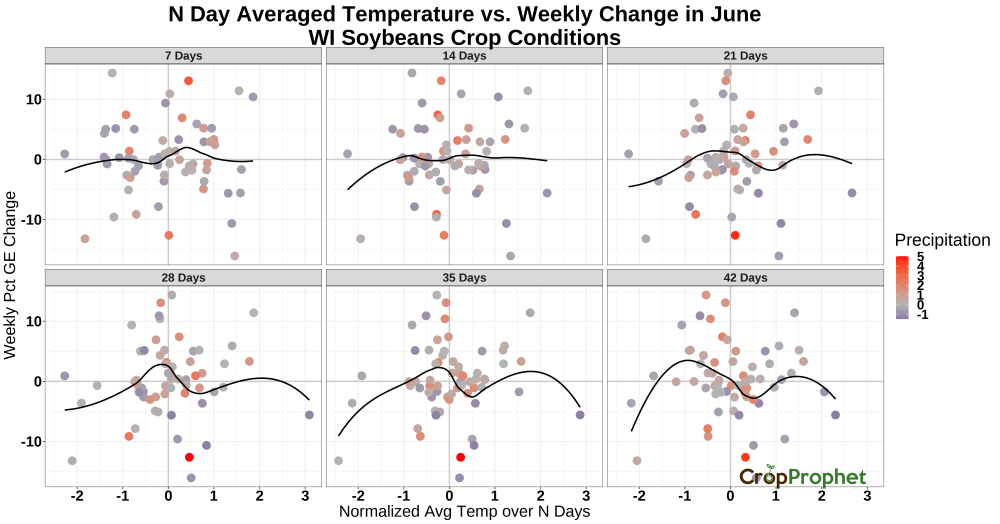
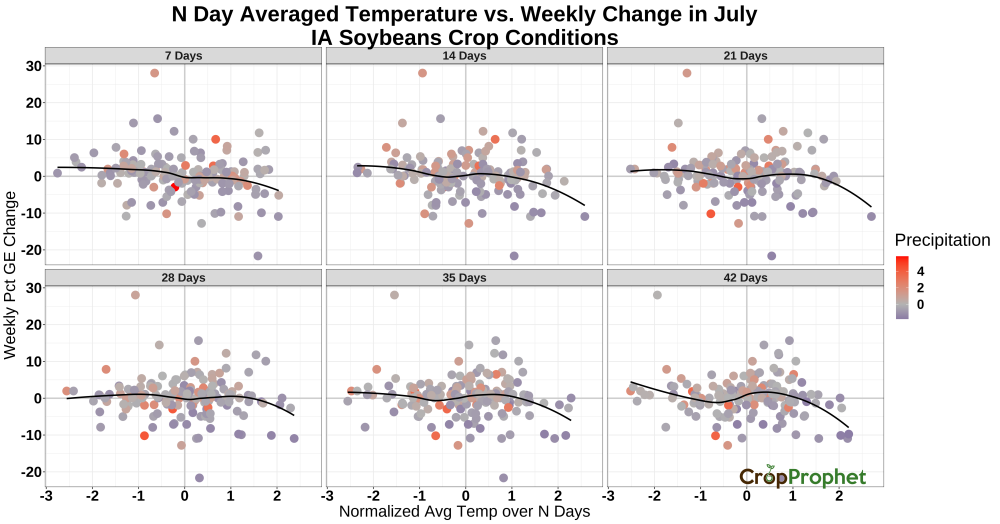
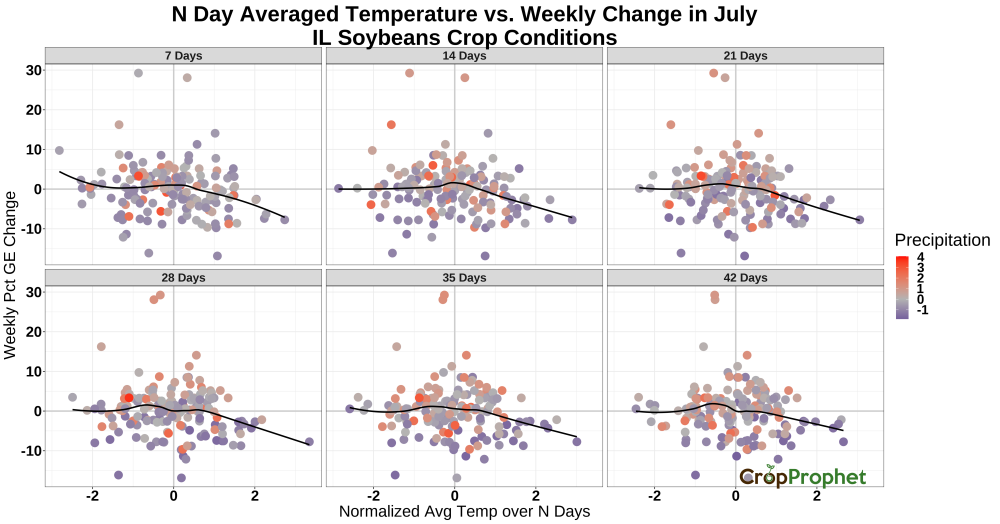
The table below provides similar graphics for other states for temperature and precipitation, corn, and soybeans. Each link will display the selected analysis.
State USDA Crop Condition Report Changes vs. Weather Conditions
| Impact of Precipitation On USDA Crop Condition Reports | ||||||||
| IA | IL | IN | MN | MO | ND | NE | SD | WI |
|---|---|---|---|---|---|---|---|---|
| Corn | ||||||||
| Jun | Jun | Jun | Jun | Jun | Jun | Jun | Jun | Jun |
| Jul | Jul | Jul | Jul | Jul | Jul | Jul | Jul | Jul |
| Aug | Aug | Aug | Aug | Aug | Aug | Aug | Aug | Aug |
| Soybeans | ||||||||
| Jun | Jun | Jun | Jun | Jun | Jun | Jun | Jun | Jun |
| Jul | Jul | Jul | Jul | Jul | Jul | Jul | Jul | Jul |
| Aug | Aug | Aug | Aug | Aug | Aug | Aug | Aug | Aug |
| Impact of Average Temperature On USDA Crop Condition Reports | ||||||||
| IA | IL | IN | MN | MO | ND | NE | SD | WI |
|---|---|---|---|---|---|---|---|---|
| Corn | ||||||||
| Jun | Jun | Jun | Jun | Jun | Jun | Jun | Jun | Jun |
| Jul | Jul | Jul | Jul | Jul | Jul | Jul | Jul | Jul |
| Aug | Aug | Aug | Aug | Aug | Aug | Aug | Aug | Aug |
| Soybeans | ||||||||
| Jun | Jun | Jun | Jun | Jun | Jun | Jun | Jun | Jun |
| Jul | Jul | Jul | Jul | Jul | Jul | Jul | Jul | Jul |
| Aug | Aug | Aug | Aug | Aug | Aug | Aug | Aug | Aug |
The graphics in the table show that:
1) The weather-to-crop condition report relationships are not consistent across all states.
2) The relationship is more evident later in the season.
3) In some cases, relationships between weather conditions and weekly crop condition changes (see IA corn precipitation in August); in other cases, no clear relationship appears to exist (see MO soybean temperature in August).
4) Temperature and precipitation both impact changes in the crop condition reports. Future analyses will examine both variables together rather than separately.
Weather Impact on Crop Condition Reports: US
The same analysis can be conducted for the national aggregated reports. Instead of using state corn and soybean production-weighted weather data, we use national production-weighted weather data and the USDA national corn and soybean crop condition reports.
The graphics below show the data for N=21 day temperature averages and precipitation accumulated prior to the crop condition report release for corn and soybeans in June, June, and August.
June, July, and August Temperature vs. National Corn USDA Crop Condition Report Changes
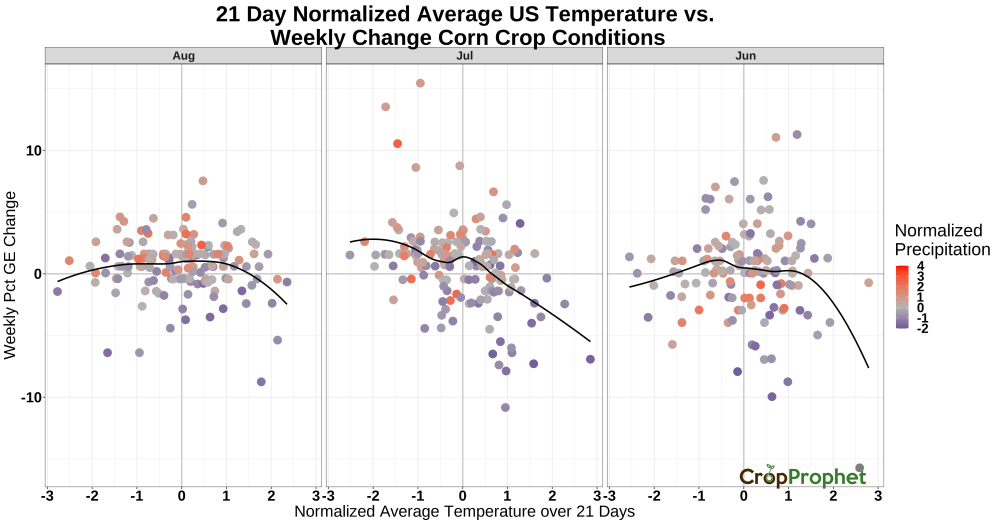 Figure 7. National USDA Corn Crop Condition Report Changes vs. Crop Production Weighted Temperature
At the national level, a clear relationship between temperatures and corn crop condition report changes seems to exist only during the month of July. Extreme positive temperature deviations decrease crop conditions and vice versa. As with the graphics above, the dots are colored based on the normalized precipitation deviations. The figure shows that higher than normal 21-day temperatures and lower than normal 21-day accumulated precipitation is associated with weekly crop condition report declines.
June, July, August Precipitation vs. National Corn USDA Crop Condition Report Changes
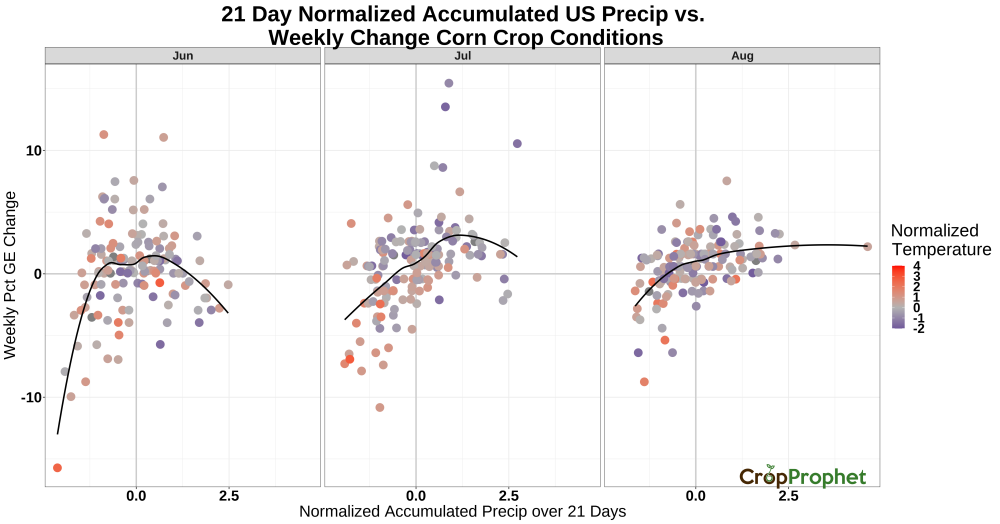
In contrast to the temperature result above, Figure 8 shows that relationships emerge in each month of the 21-day accumulated precipitation vs weekly crop condition report changes. Interestingly, each month demonstrates that below-normal precipitation is associated with potentially dramatic weekly crop condition changes. In June, above-normal precipitation also works to decrease the crop condition report. By July and into August, however, above-normal precipitation supports increases in the weekly crop condition reports.
June, July, August Temperature vs. National Soybean USDA Crop Condition Report Changes
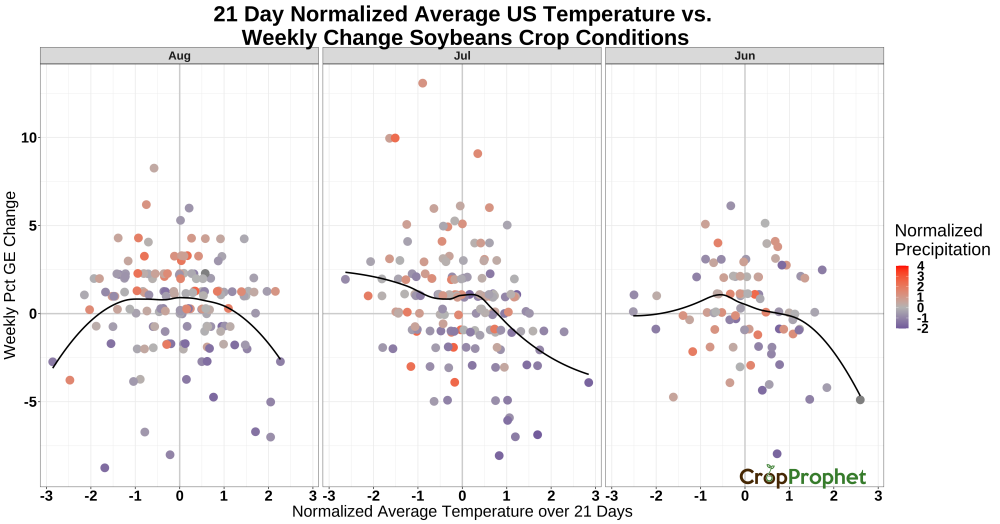
The relationship between 21-day averaged precipitation and weekly crop conditions changes are less clear for soybeans each month. There is substantial scatter in each month, with only July suggesting above normal temperatures decrease crop conditions and below normal temperatures increase them.
June, July, August Precipitation vs. National Soybean USDA Crop Condition Report Changes
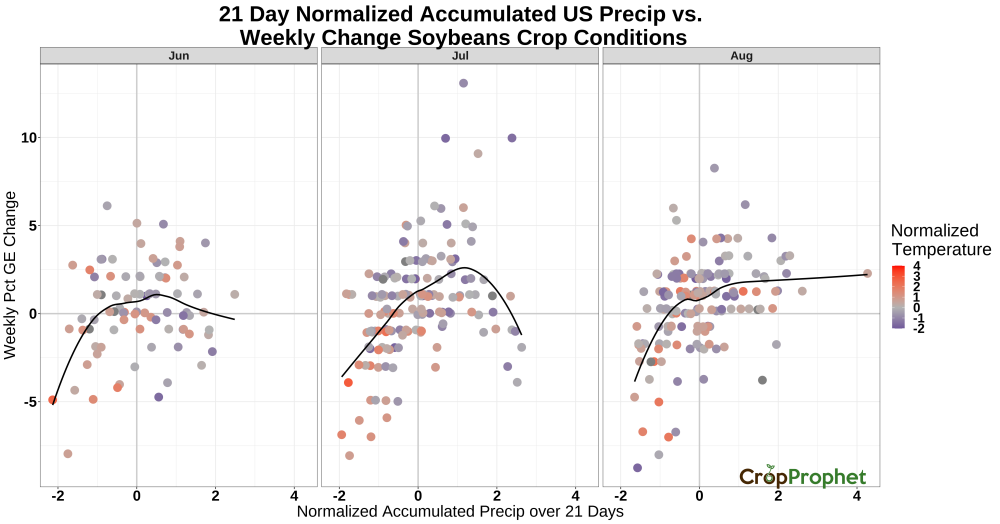
Unlike soybeans’ temperature/crop condition relationship, a clearer picture emerges for precipitation. By July, a clear relationship exists: below-normal precipitation tends to cause crop condition declines, as does precipitation above approximately one standard deviation. By August, crop condition declines are associated with below-normal precipitation; the opposite is true for above-normal precipitation.
Conclusion
We started by asking, “What’s the impact of weather conditions on the crop condition reports for corn and soybeans?” as means of trying to understand if the USDA weekly crop condition reports contain useful information.
We conclude that relationships between weather conditions and weekly changes in the USDA crop condition report exist. In other words, crop condition reports are not useless and contain valuable information about the crop’s health and are related to weather conditions. However, the relationship is not consistent between corn and soybeans, between states, or at different times of the growing season. There are states, months, and crops where there appears to be no consistent relationship between changes in the crop conditions and weather conditions.
Each graphic shown has a considerable spread for each precipitation or temperature deviation from normal. Undoubtedly, some of that spread is because the crop condition reports are human surveys of local conditions. It must be a difficult task to ensure crop condition reporting consistency across 3600 people in many different states. Other reasons might include impacts from meteorological variables other than temperature and precipitation such as relative humidity or solar radiation.