Iowa Drought Monitor
During the 2020 corn and soybean crop season, a significant drought developed in Iowa. A drought has significant impacts on crop growth. Monitoring, and more importantly, forecasting the impact of drought conditions is a critical component of crop yield monitoring for the purposes of grain trading. This post discusses the 2020 weather that enabled a drought to develop.
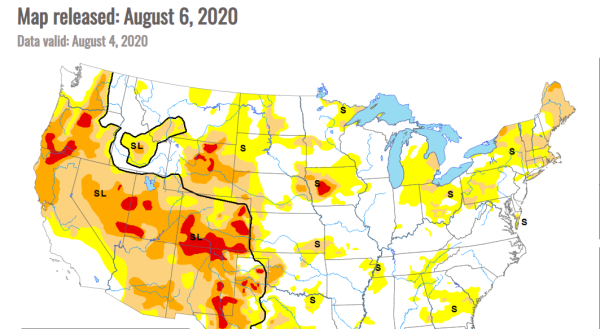
Let’s start with the animation below, which depicts the US Drought Monitor weekly drought reports for Iowa during 2020.
During 2020, drought became relatively widespread across the United States. For example, the August 6, 2020 National Drought Mitigation Center updated the US Drought Monitor maps. The red area in western Iowa is an official been designation of as extreme drought.
Iowa Drought
The animation below shows the evolution of soil moisture for the US corn belt since early April. Watch Iowa carefully to see the impact of the drought development on soil moisture.
Why?
Why did the drought develop? The short answer is the development of dry conditions. It has not rained much in central and western Iowa so far this crop season.
The 30-day averaged precipitation, as a percentage of normal precipitation, is shown below. The deeper the brown colors the more abnormally dry that county has been. The information below shows as little as 25% of normal precipitation has fallen over the past 30 days.
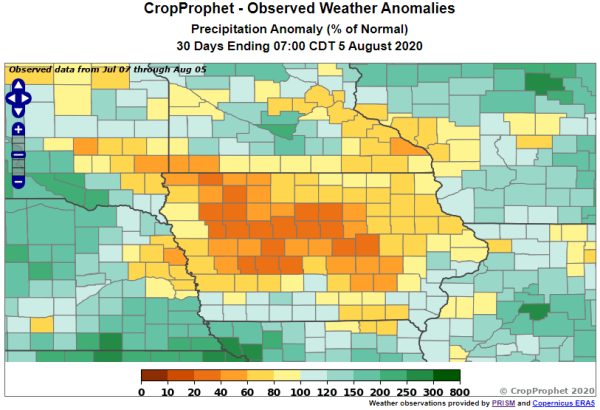
The “running ” 30-day average precipitation animation is shown below. This shows an animation of the 30-day average precipitation for continuous 30 days periods starting in April. It shows the evolution of the summer 2020 precipitation that has lead to the development of the drought.

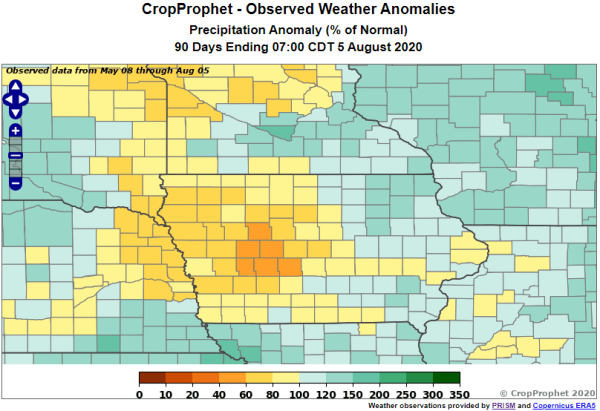
Likewise, even the precipitation analysis over the prior 90 days shows the region forming the heart of the drought has had only 40-60 percent of normal precipitation. The driest conditions on this map align well with the extreme drought conditions shown in the US drought monitor maps above. Likewise, the counties immediately surrounding the driest counties are experiencing a moderate drought.
Dry conditions like this negatively impact the corn crop. Despite this drought, however, Iowa will still be the top producer of corn in the United States. CropProphet provides weather-based corn and soybean yield forecasts for the United States. Our model incorporates these dry conditions into our county-level forecasts. These are aggregated to show the national level yield and production forecasts. Is this drought significant at a national level? Request a trial of CropProphet and see for yourself.
We provide risk-free trials. Try one today.