State Corn Yield Per Acre: Causes of Variations
An analysis of state average corn yield history data provided by the USDA NASS indicates there are two causes of corn yield (in bushel per acre) variations at the regional level in the United States. These variations impact US state corn production. Each is important for creating an accurate corn yield forecast. The causes of year-to-year crop and soybean yield variations at the state and national level are:
- The Technology Trend – many types of technology are improving yields for both soybeans and corn. The result is an increase in how much corn crop per acre can be produced on a piece of farmland. The charts below show corn and soybean yields from 1986 to 2017 as reported by the USDA. The general upward slope of the line is the technology trend.
- Weather conditions during the corn growing season – after removing the effect of the technology trend, the impact of weather on the corn crop can be estimated. The variations around the upward trend in the data the charts below are caused by weather conditions during the US growing season. CropProphet uses the evolving weather conditions during each crop season to forecast the end of season yield and production.
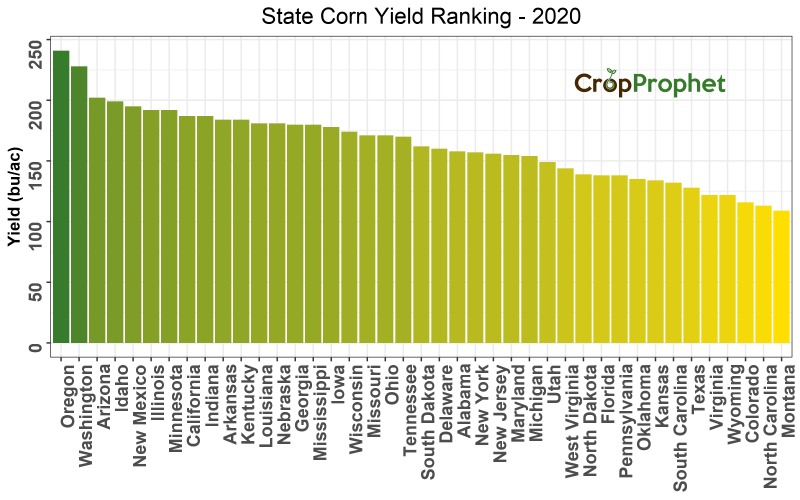
- State to state differences in weather conditions and soil type and nutrients levels. The graphic below shows the 2019 corn yield by state. There is a wide range of variations in the state average corn yield.
Follow this link if you are interested in state soybean yield per acre rankings or US crop production statistics.

Corn Yield Per Acre by State: Top 11 of 2020
The top 11 corn yield by state of 2020 were:
| Yield Rankings: 2020 | ||
| Rank | State | Yield (bu/ac) |
|---|---|---|
| 1 | Oregon | 241 |
| 2 | Washington | 228 |
| 3 | Arizona | 202 |
| 4 | Idaho | 199 |
| 5 | New Mexico | 195 |
| 6 | Illinois | 192 |
| 6 | Minnesota | 192 |
| 8 | California | 187 |
| 8 | Indiana | 187 |
| 10 | Arkansas | 184 |
| 10 | Kentucky | 184 |

State Corn Yield – 2020
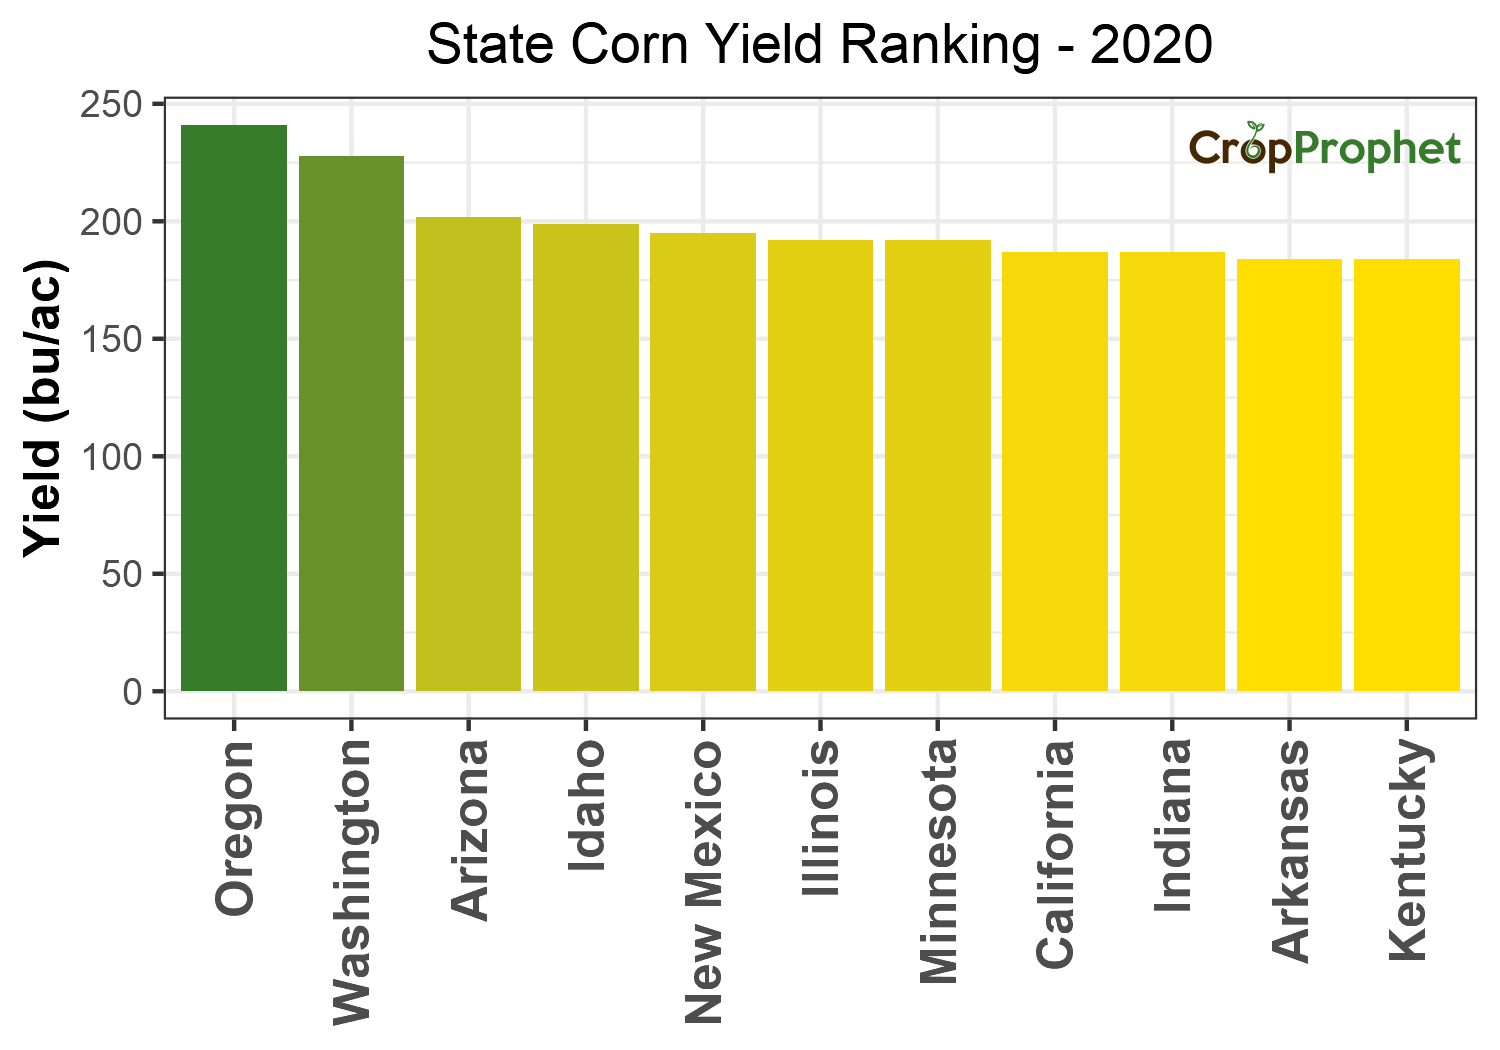
However, because Oregon, Washington, Arizona, and Idaho do not have anywhere near as many planted corn acres (and therefore harvested corn), they produce significantly less corn than Midwestern states.
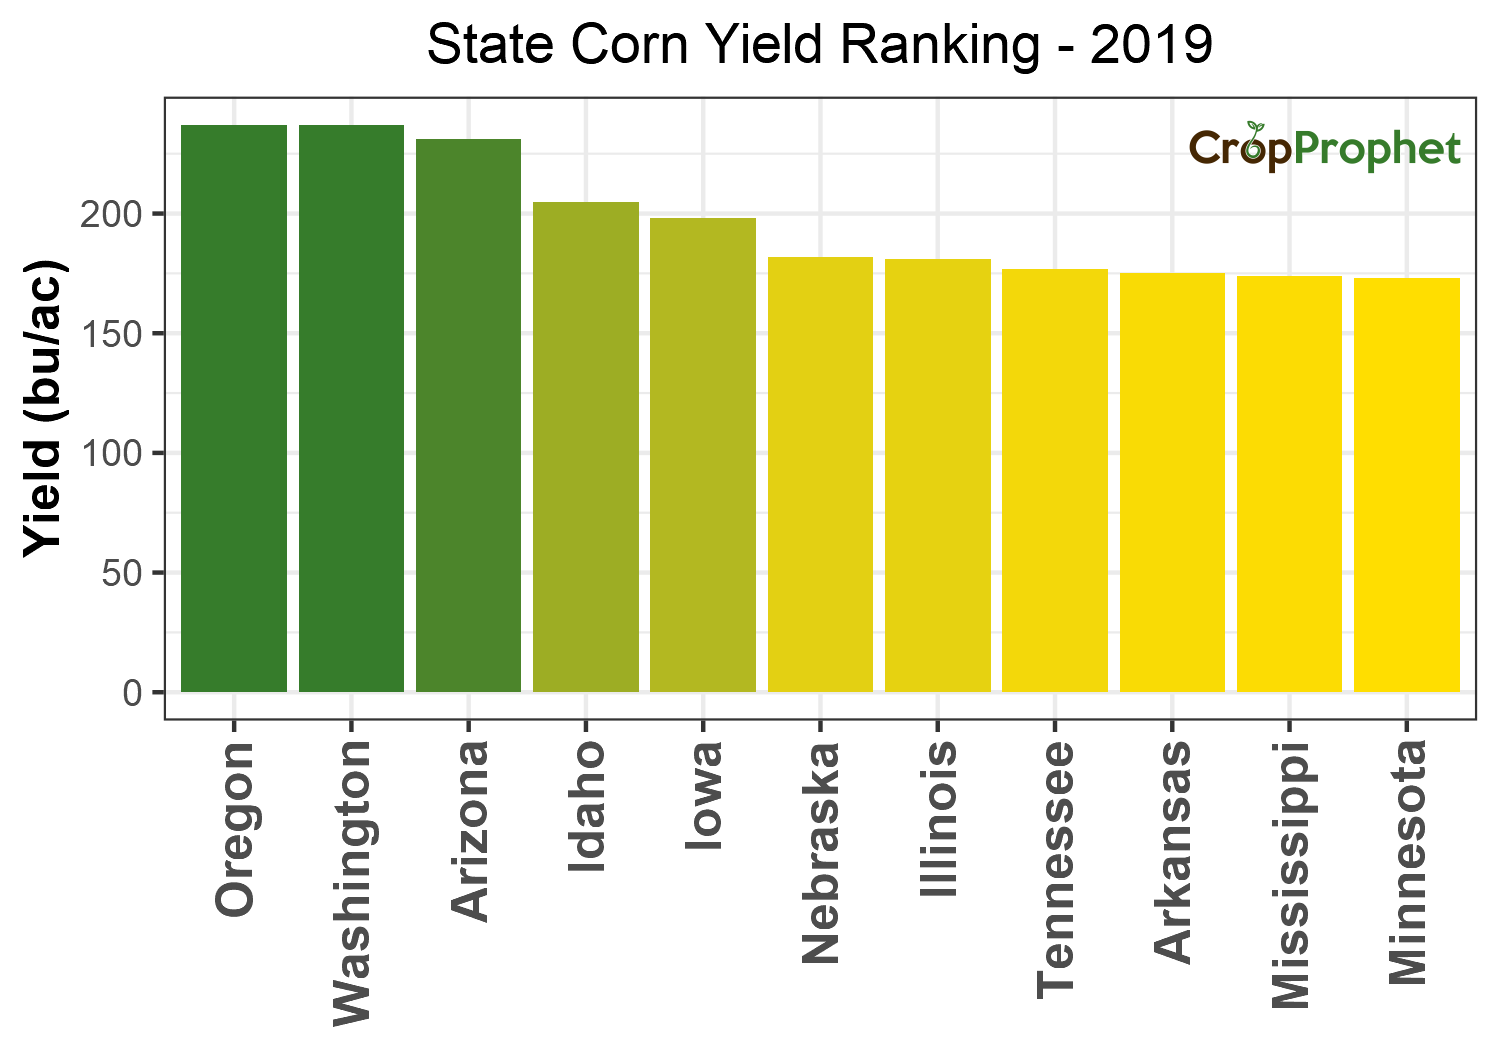
Corn Yield Per Acre by State: Top 11 of 2019
The top 11 corn yield by state of 2019 were:
| Yield Rankings: 2019 | ||
| Rank | State | Yield (bu/ac) |
|---|---|---|
| 1 | Oregon | 237 |
| 1 | Washington | 237 |
| 3 | Arizona | 231 |
| 4 | Idaho | 205 |
| 5 | Iowa | 198 |
| 6 | Nebraska | 182 |
| 7 | Illinois | 181 |
| 8 | Tennessee | 177 |
| 9 | Arkansas | 175 |
| 10 | Mississippi | 174 |
| 11 | Minnesota | 173 |
State Corn Yield – 2019
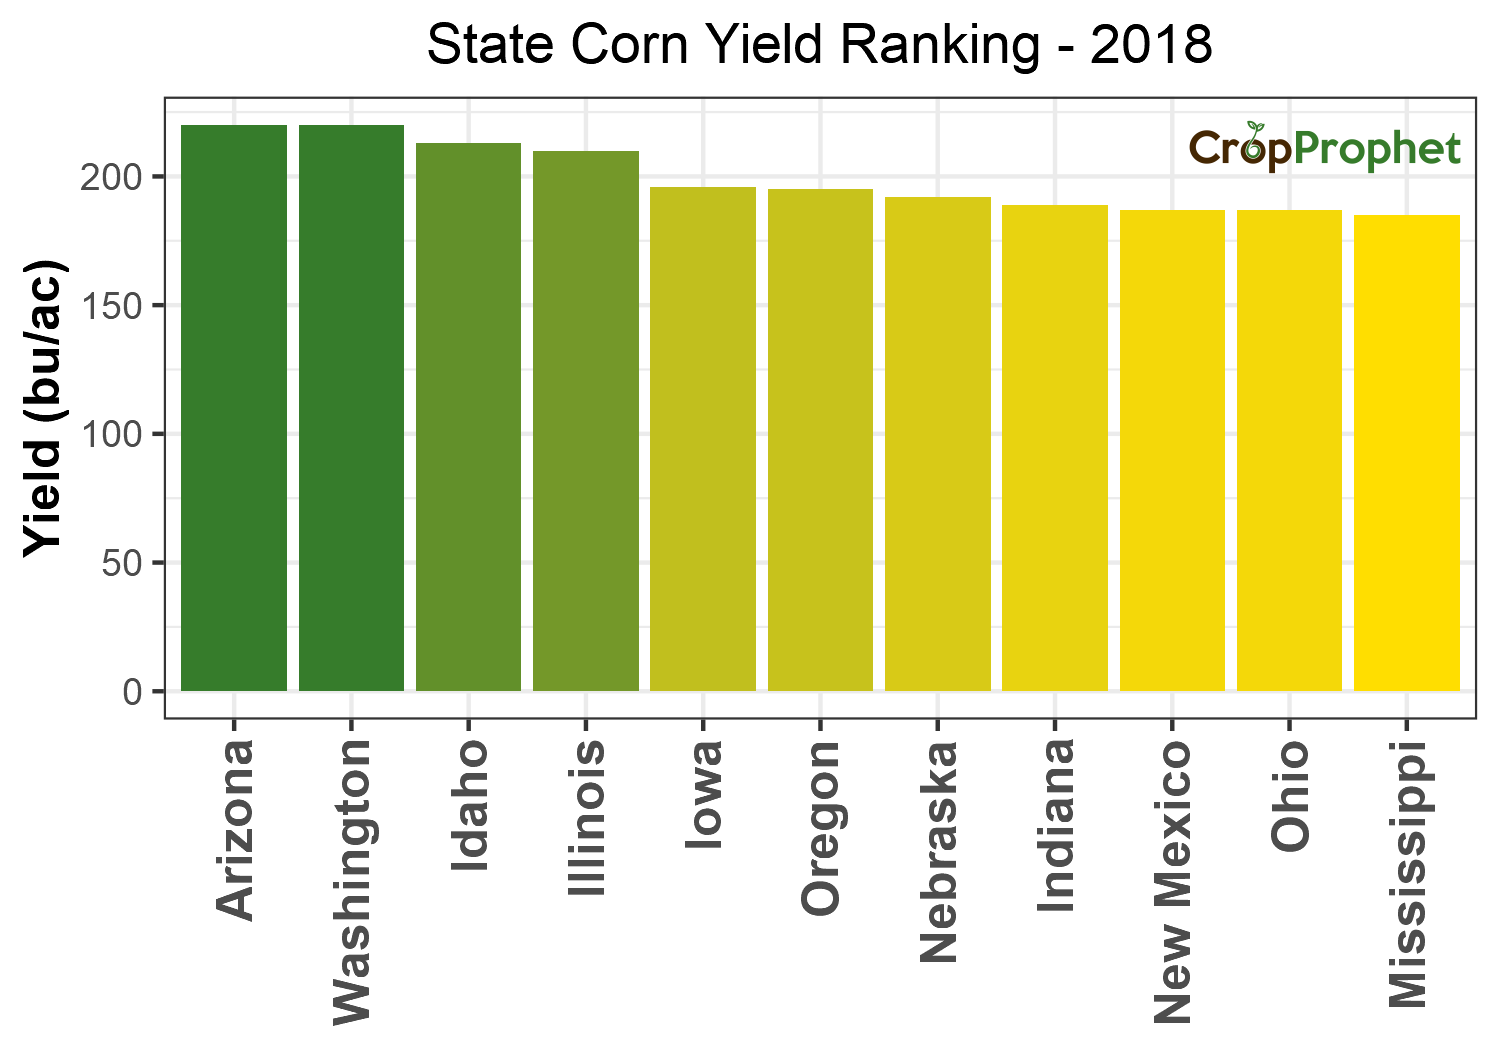
Corn Yield Per Acre by State: Top 11 of 2018
The top 11 corn yield by state of 2018 were:
| Yield Rankings: 2018 | ||
| Rank | State | Yield (bu/ac) |
|---|---|---|
| 1 | Arizona | 220 |
| 1 | Washington | 220 |
| 3 | Idaho | 213 |
| 4 | Illinois | 210 |
| 5 | Iowa | 196 |
| 6 | Oregon | 195 |
| 7 | Nebraska | 192 |
| 8 | Indiana | 189 |
| 9 | New Mexico | 187 |
| 9 | Ohio | 187 |
| 11 | Mississippi | 185 |
State Corn Yield – 2018
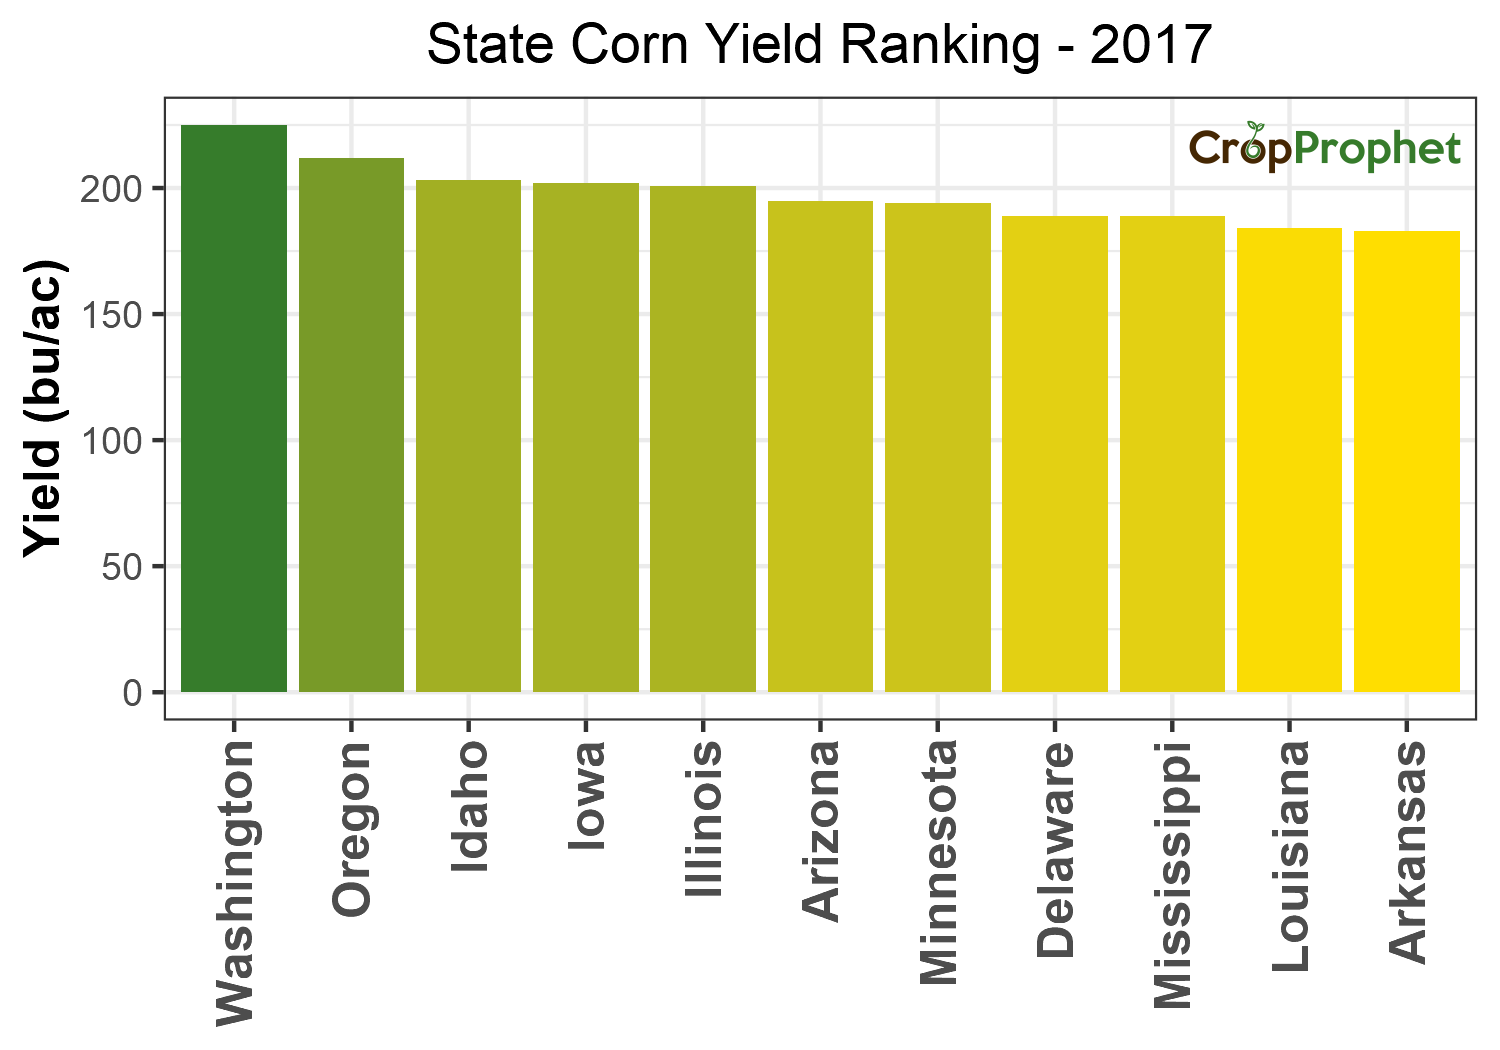
Corn Yield Per Acre by State: Top 11 of 2017
The top 11 corn yield by state of 2017 were:
| Yield Rankings: 2017 | ||
| Rank | State | Yield (bu/ac) |
|---|---|---|
| 1 | Washington | 225 |
| 2 | Oregon | 212 |
| 3 | Idaho | 203 |
| 4 | Iowa | 202 |
| 5 | Illinois | 201 |
| 6 | Arizona | 195 |
| 7 | Minnesota | 194 |
| 8 | Delaware | 189 |
| 8 | Mississippi | 189 |
| 10 | Louisiana | 184 |
| 11 | Arkansas | 183 |
State Corn Yield – 2017
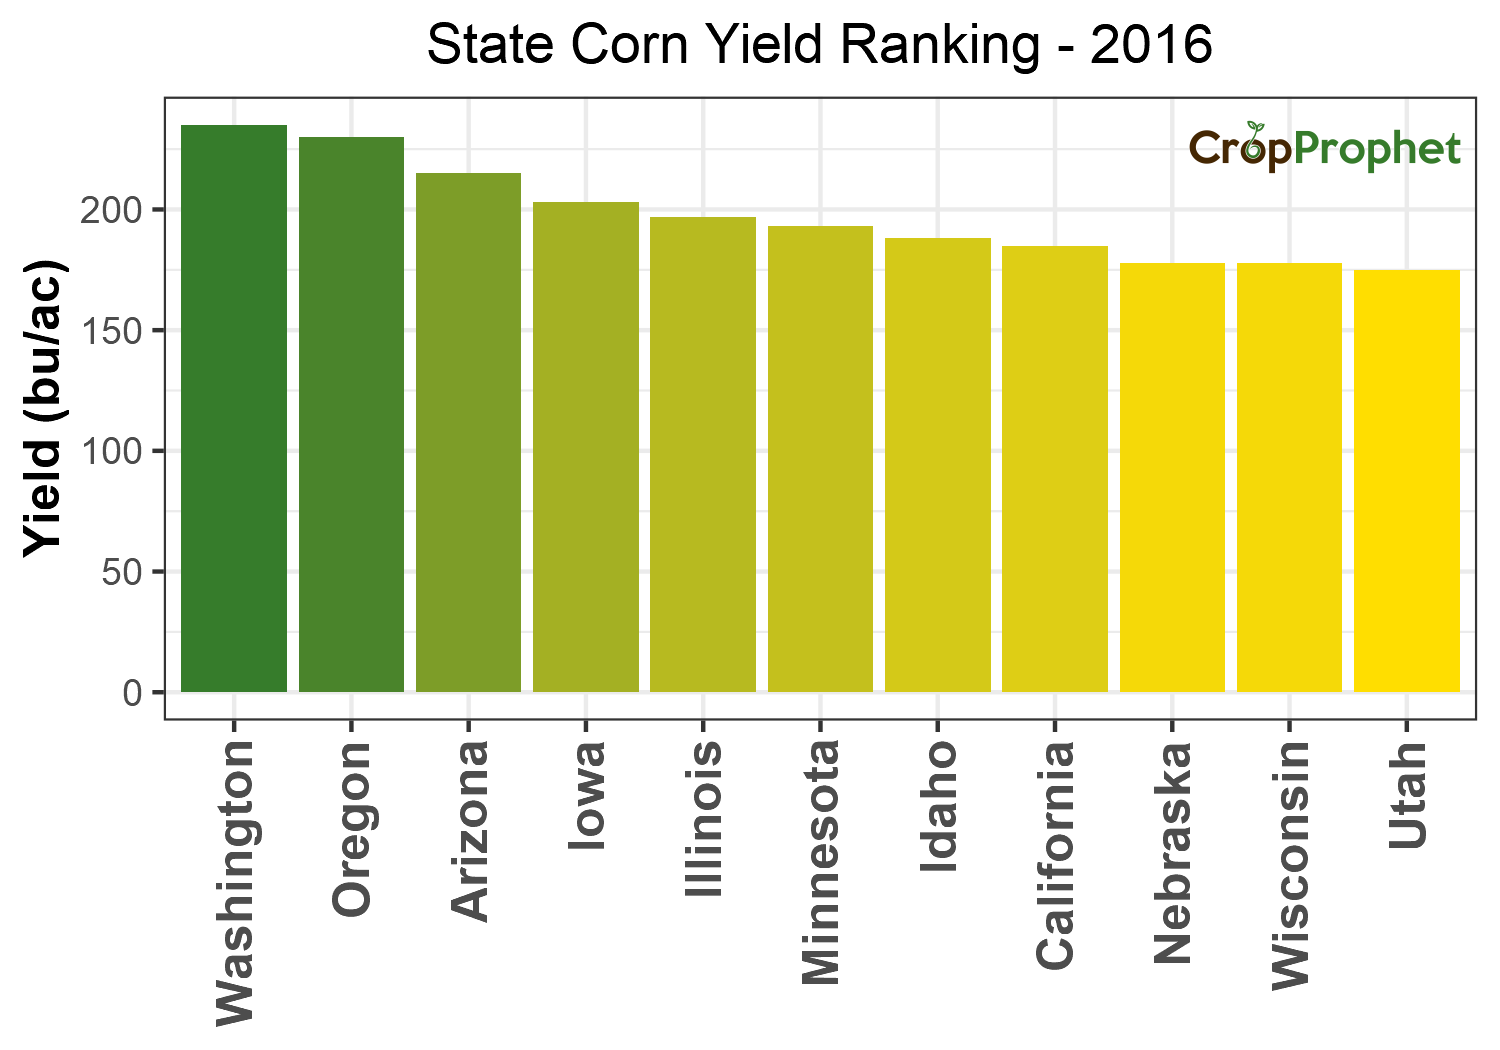
Corn Yield Per Acre by State: Top 11 of 2016
The top 11 corn yield by state of 2016 were:
| Yield Rankings: 2016 | ||
| Rank | State | Yield (bu/ac) |
|---|---|---|
| 1 | Washington | 235 |
| 2 | Oregon | 230 |
| 3 | Arizona | 215 |
| 4 | Iowa | 203 |
| 5 | Illinois | 197 |
| 6 | Minnesota | 193 |
| 7 | Idaho | 188 |
| 8 | California | 185 |
| 9 | Nebraska | 178 |
| 9 | Wisconsin | 178 |
| 11 | Utah | 175 |
State Corn Yield – 2016
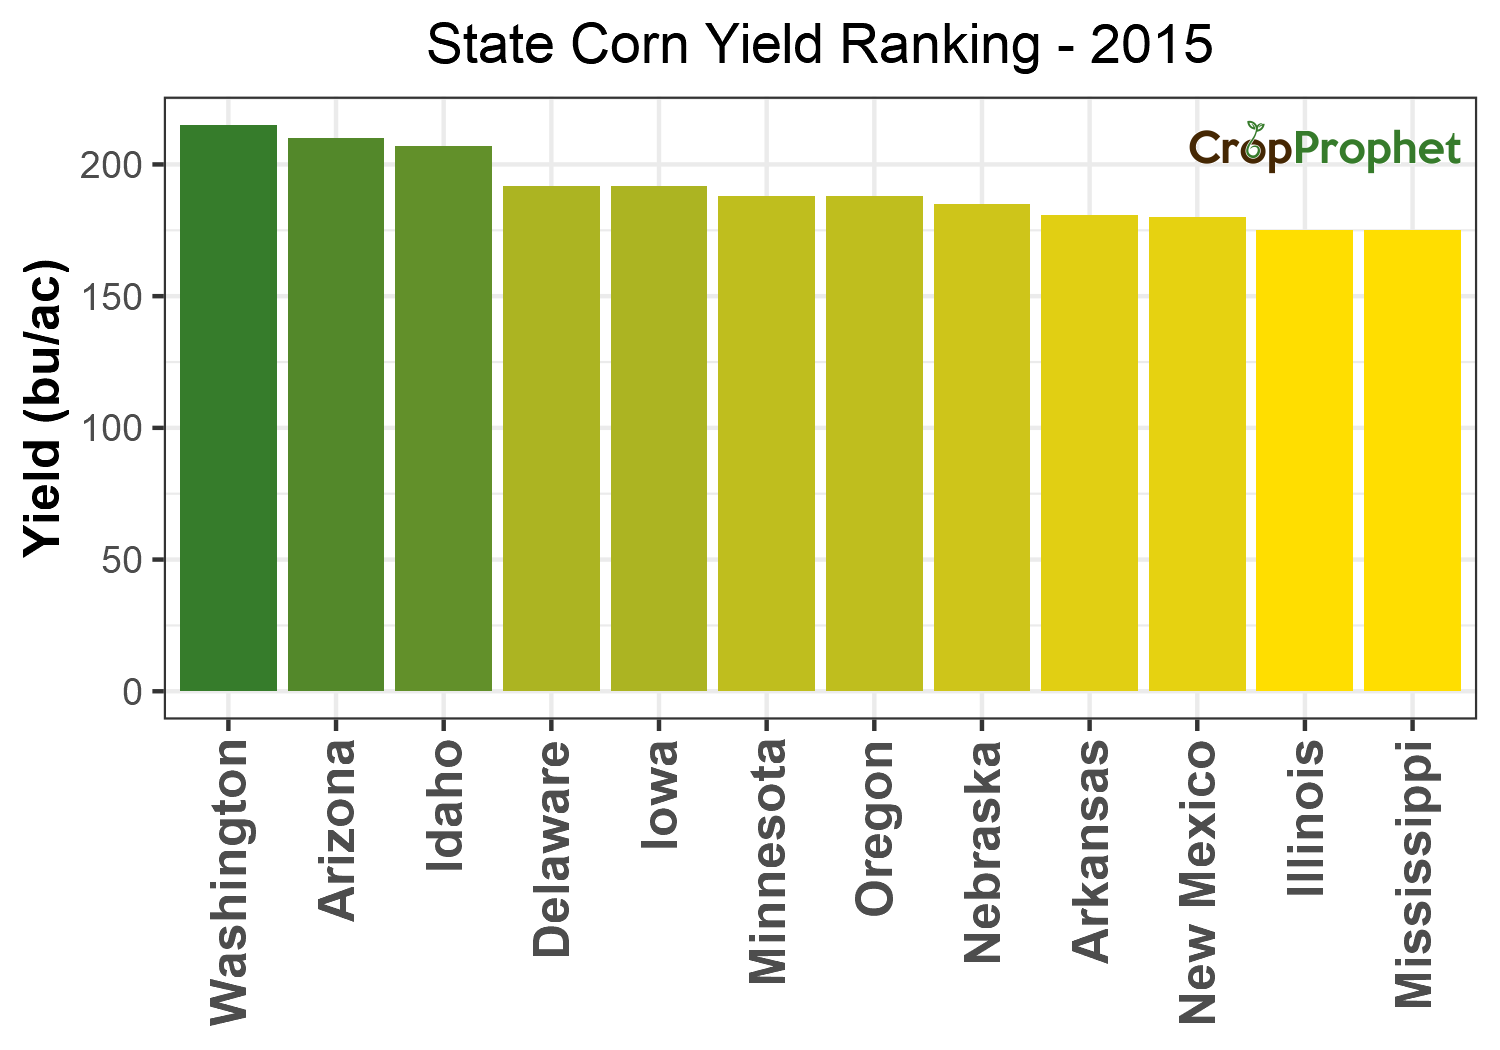
Corn Yield Per Acre by State: Top 11 of 2015
The top 11 corn yield by state of 2015 were:
| Yield Rankings: 2015 | ||
| Rank | State | Yield (bu/ac) |
|---|---|---|
| 1 | Washington | 215 |
| 2 | Arizona | 210 |
| 3 | Idaho | 207 |
| 4 | Delaware | 192 |
| 4 | Iowa | 192 |
| 6 | Minnesota | 188 |
| 6 | Oregon | 188 |
| 8 | Nebraska | 185 |
| 9 | Arkansas | 181 |
| 10 | New Mexico | 180 |
| 11 | Illinois | 175 |
| 11 | Mississippi | 175 |
State Corn Yield – 2015
Corn Yield Per Acre by State: Top 11 of 2014
The top 11 corn yield by state of 2014 were:
| Yield Rankings: 2014 | ||
| Rank | State | Yield (bu/ac) |
|---|---|---|
| 1 | Washington | 215 |
| 2 | Arizona | 210 |
| 3 | Delaware | 200 |
| 3 | Idaho | 200 |
| 3 | Illinois | 200 |
| 6 | New Mexico | 195 |
| 7 | Oregon | 190 |
| 8 | Indiana | 188 |
| 9 | Arkansas | 187 |
| 10 | Missouri | 186 |
| 11 | Mississippi | 185 |
State Corn Yield – 2014

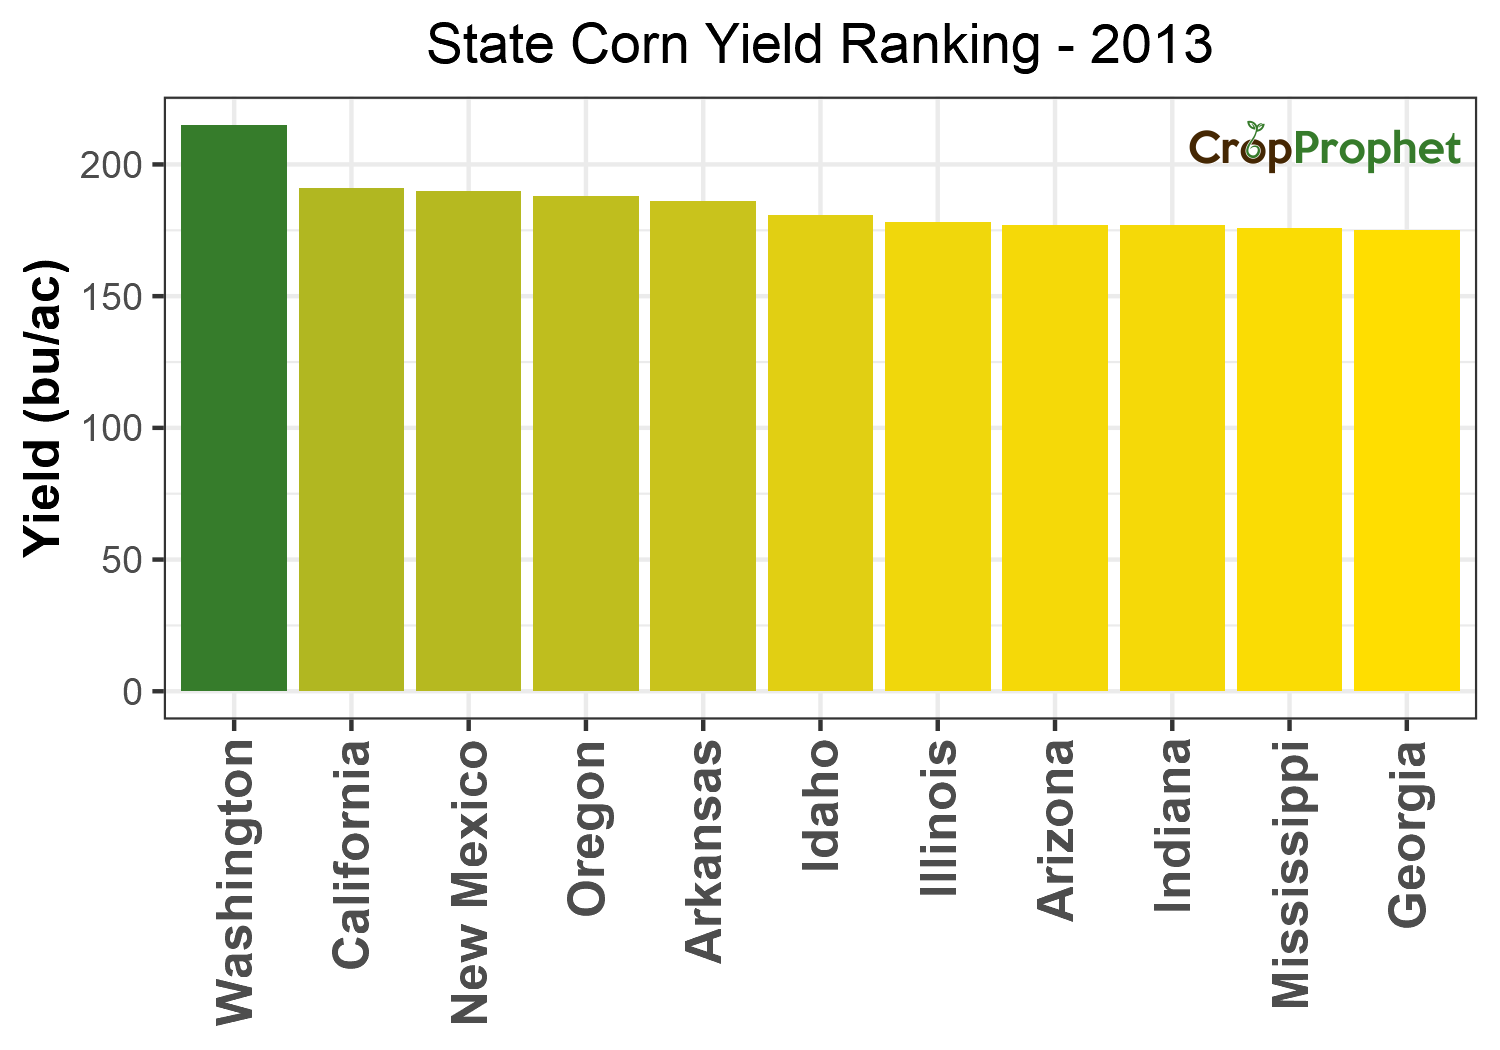
Corn Yield Per Acre by State: Top 11 of 2013
The top 11 corn yield by state of 2013 were:
| Yield Rankings: 2013 | ||
| Rank | State | Yield (bu/ac) |
|---|---|---|
| 1 | Washington | 215 |
| 2 | California | 191 |
| 3 | New Mexico | 190 |
| 4 | Oregon | 188 |
| 5 | Arkansas | 186 |
| 6 | Idaho | 181 |
| 7 | Illinois | 178 |
| 8 | Arizona | 177 |
| 8 | Indiana | 177 |
| 10 | Mississippi | 176 |
| 11 | Georgia | 175 |
State Corn Yield – 2013
Corn Yield Per Acre by State: Top 11 of 2012
The top 11 corn yield by state of 2012 were:
| Yield Rankings: 2012 | ||
| Rank | State | Yield (bu/ac) |
|---|---|---|
| 1 | Washington | 215 |
| 2 | Oregon | 205 |
| 3 | Arizona | 195 |
| 3 | Idaho | 195 |
| 5 | California | 180 |
| 5 | Georgia | 180 |
| 7 | Arkansas | 178 |
| 8 | Louisiana | 173 |
| 9 | New Mexico | 170 |
| 10 | Utah | 167 |
| 11 | Minnesota | 165 |
| 11 | Mississippi | 165 |
State Corn Yield – 2012

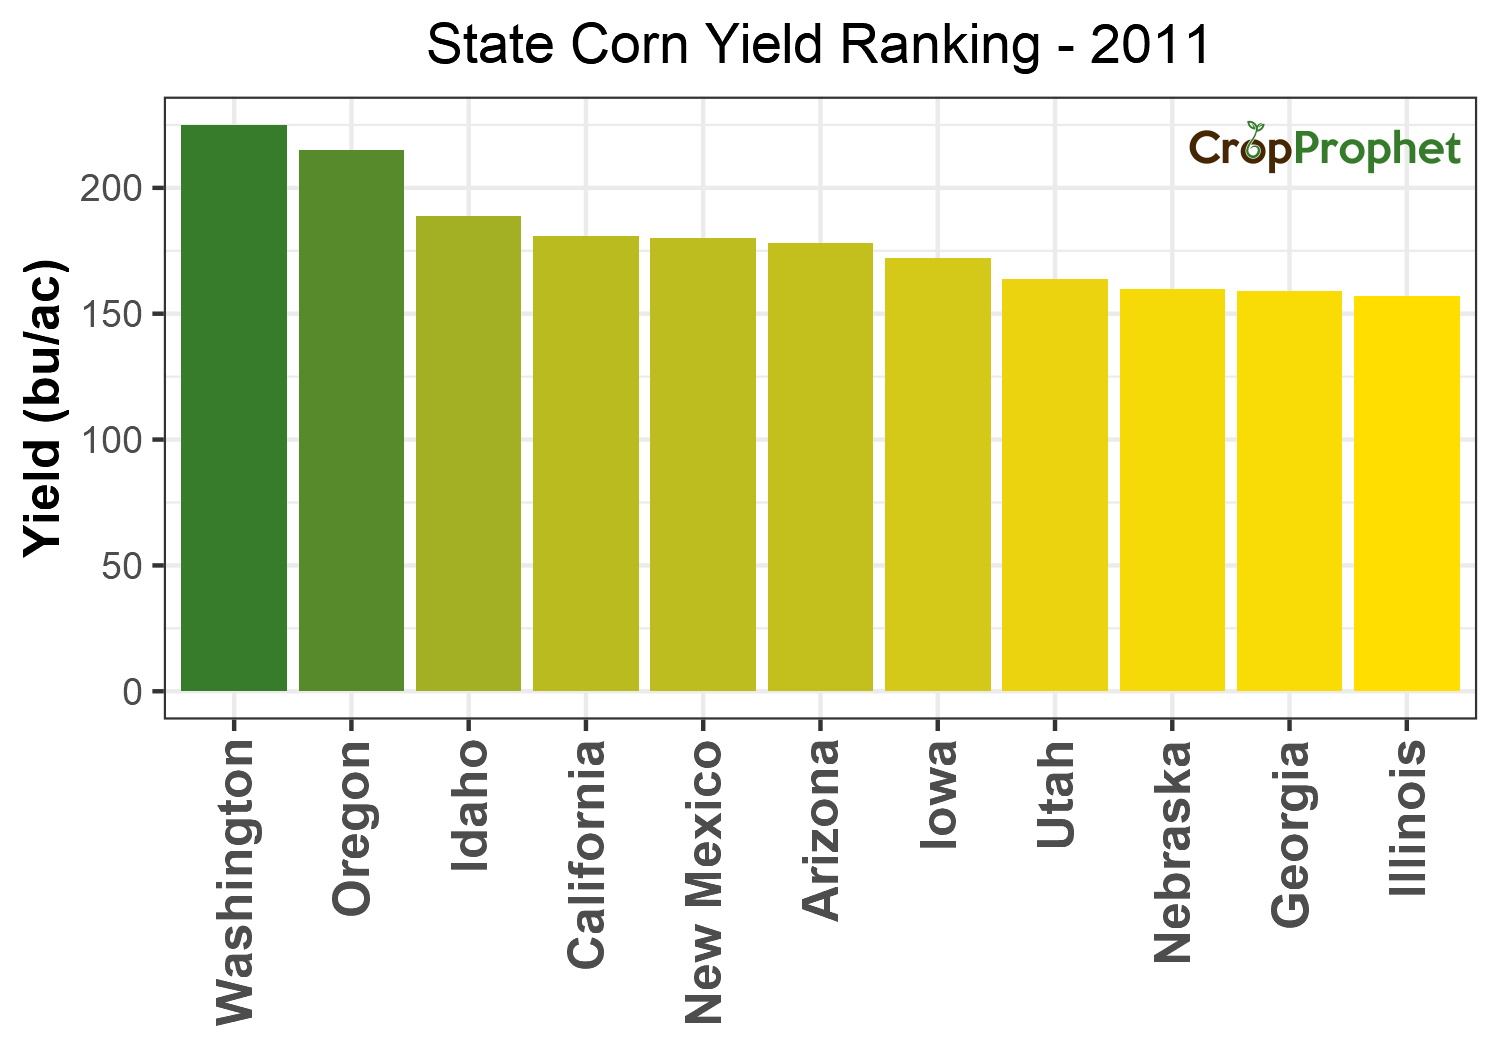
Corn Yield Per Acre by State: Top 11 of 2011
The top 11 corn yield by state of 2011 were:
| Yield Rankings: 2011 | ||
| Rank | State | Yield (bu/ac) |
|---|---|---|
| 1 | Washington | 225 |
| 2 | Oregon | 215 |
| 3 | Idaho | 189 |
| 4 | California | 181 |
| 5 | New Mexico | 180 |
| 6 | Arizona | 178 |
| 7 | Iowa | 172 |
| 8 | Utah | 164 |
| 9 | Nebraska | 160 |
| 10 | Georgia | 159 |
| 11 | Illinois | 157 |
State Corn Yield – 2011
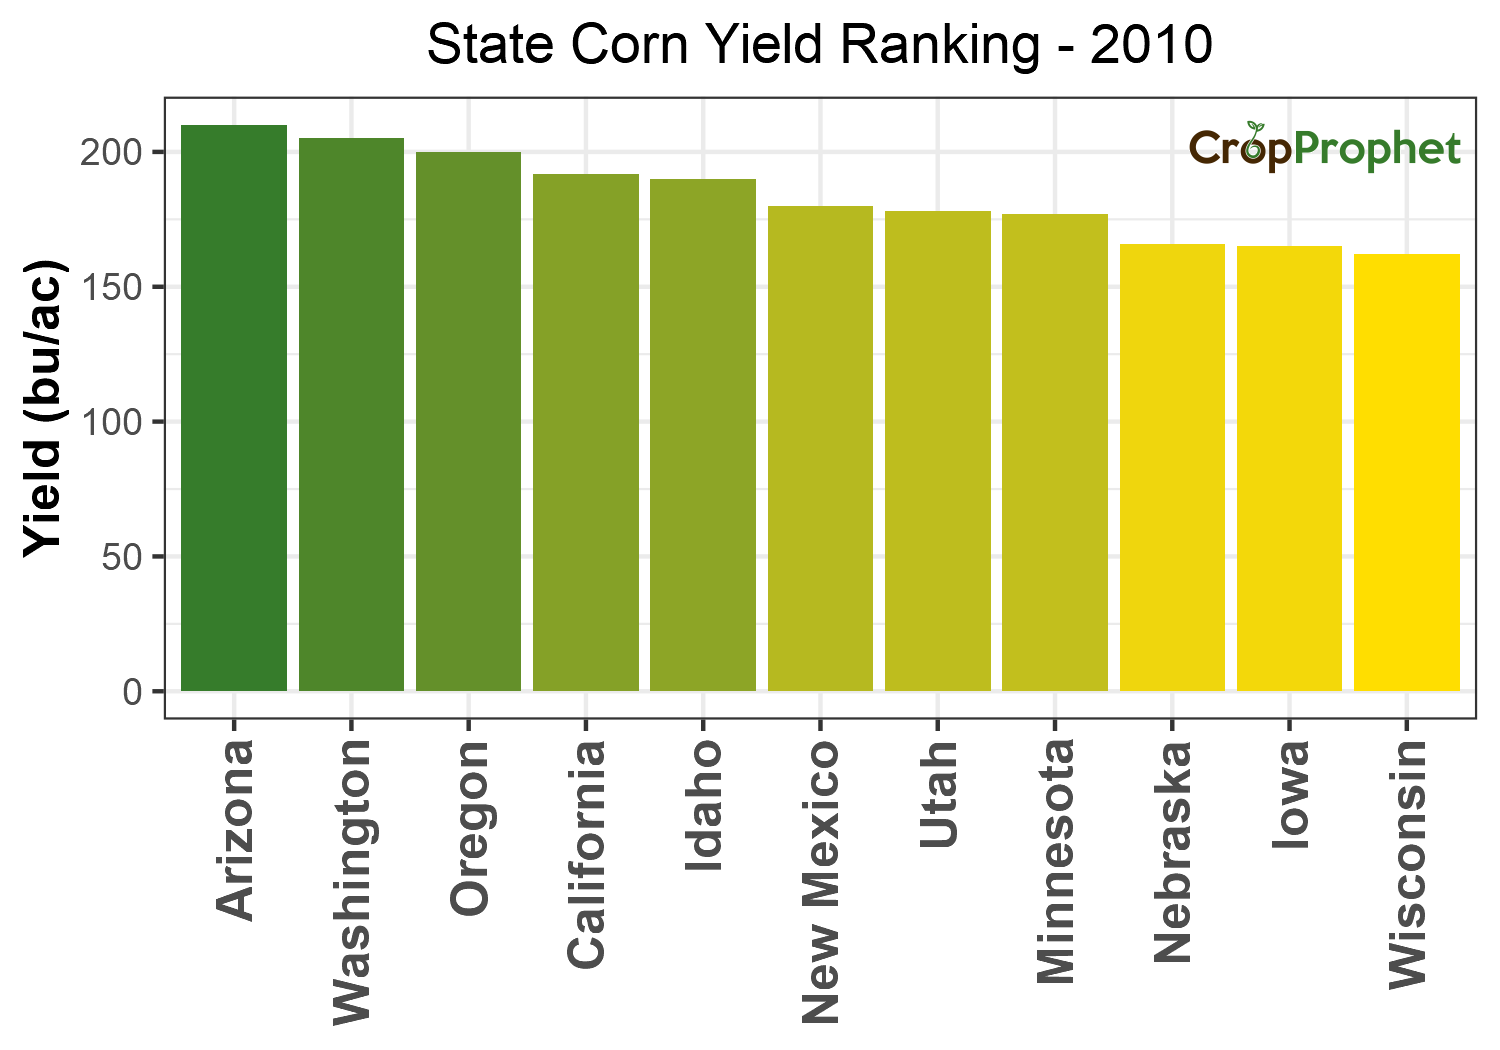
Corn Yield Per Acre by State: Top 11 of 2010
The top 11 corn yield by state of 2010 were:
| Yield Rankings: 2010 | ||
| Rank | State | Yield (bu/ac) |
|---|---|---|
| 1 | Arizona | 210 |
| 2 | Washington | 205 |
| 3 | Oregon | 200 |
| 4 | California | 192 |
| 5 | Idaho | 190 |
| 6 | New Mexico | 180 |
| 7 | Utah | 178 |
| 8 | Minnesota | 177 |
| 9 | Nebraska | 166 |
| 10 | Iowa | 165 |
| 11 | Wisconsin | 162 |
State Corn Yield – 2010
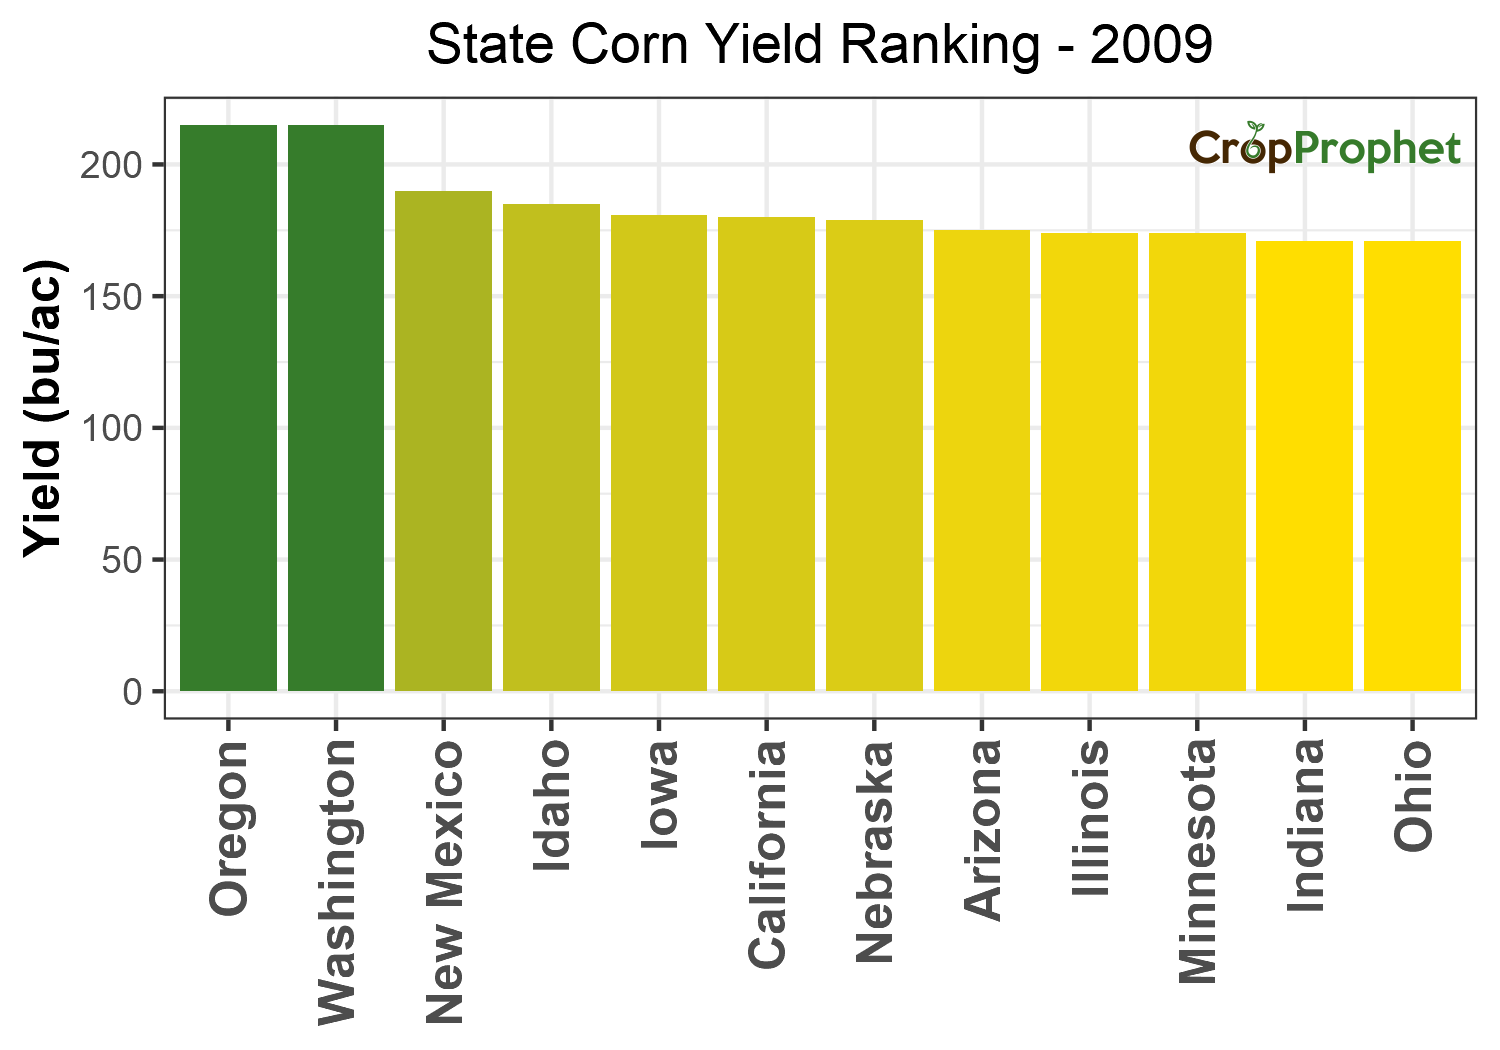
Corn Yield Per Acre by State: Top 11 of 2009
The top 11 corn yield by state of 2009 were:
| Yield Rankings: 2009 | ||
| Rank | State | Yield (bu/ac) |
|---|---|---|
| 1 | Oregon | 215 |
| 1 | Washington | 215 |
| 3 | New Mexico | 190 |
| 4 | Idaho | 185 |
| 5 | Iowa | 181 |
| 6 | California | 180 |
| 7 | Nebraska | 179 |
| 8 | Arizona | 175 |
| 9 | Illinois | 174 |
| 9 | Minnesota | 174 |
| 11 | Indiana | 171 |
| 11 | Ohio | 171 |
State Corn Yield – 2009
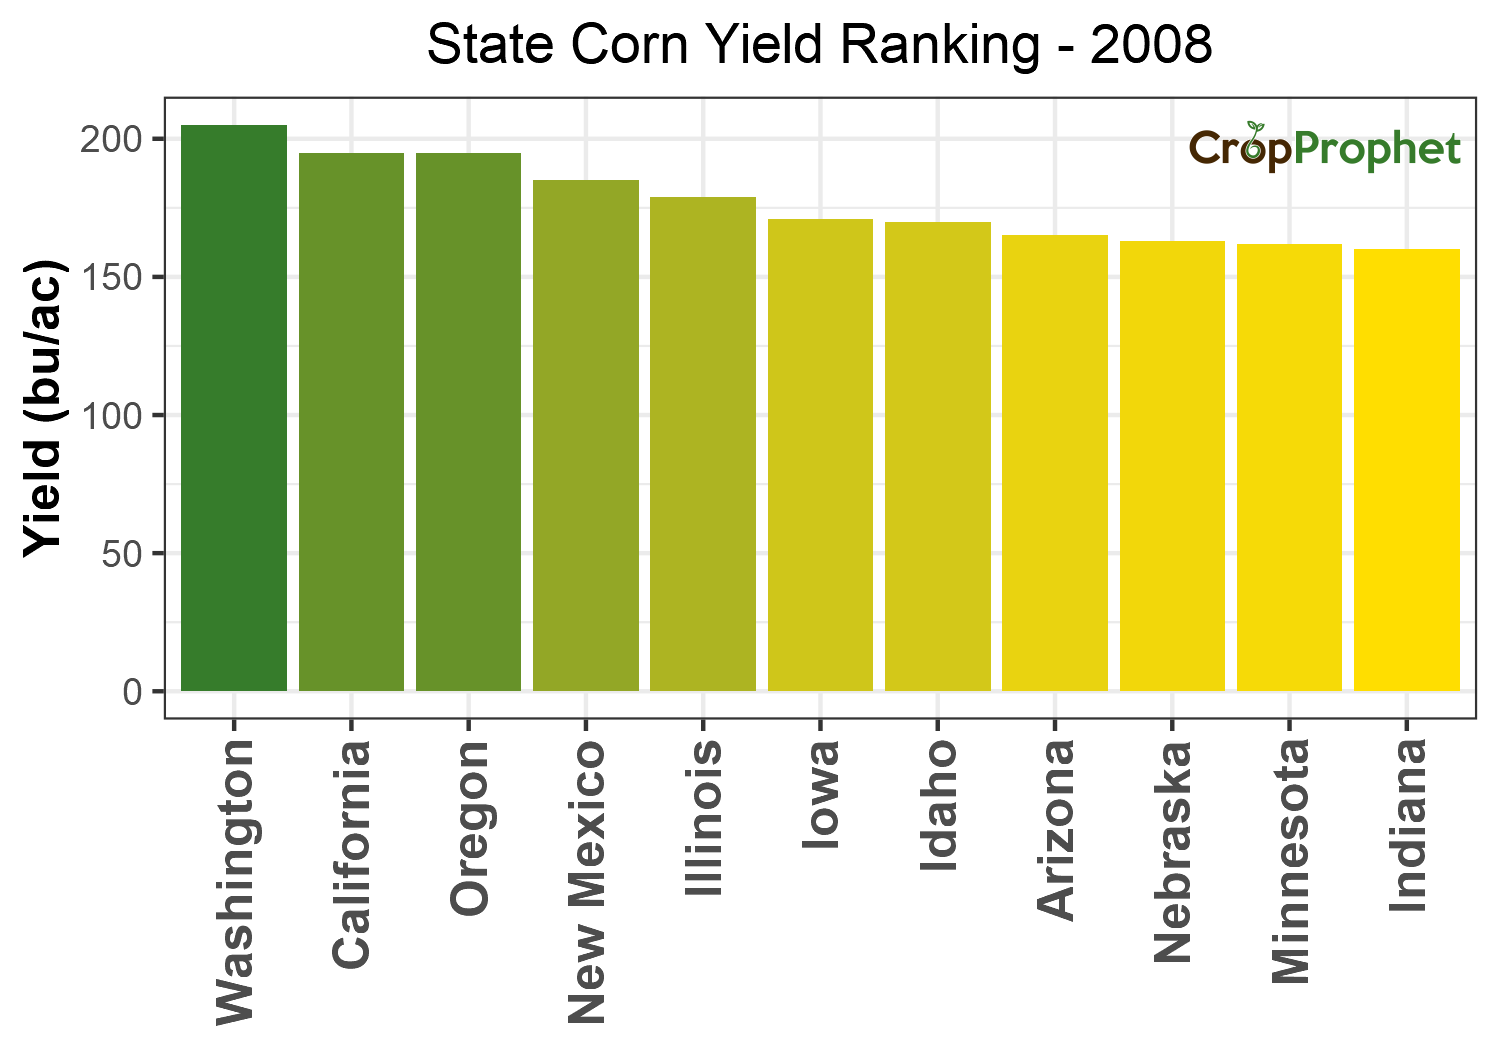
Corn Yield Per Acre by State: Top 11 of 2008
The top 11 corn yield by state of 2008 were:
| Yield Rankings: 2008 | ||
| Rank | State | Yield (bu/ac) |
|---|---|---|
| 1 | Washington | 205 |
| 2 | California | 195 |
| 2 | Oregon | 195 |
| 4 | New Mexico | 185 |
| 5 | Illinois | 179 |
| 6 | Iowa | 171 |
| 7 | Idaho | 170 |
| 8 | Arizona | 165 |
| 9 | Nebraska | 163 |
| 10 | Minnesota | 162 |
| 11 | Indiana | 160 |
State Corn Yield – 2008
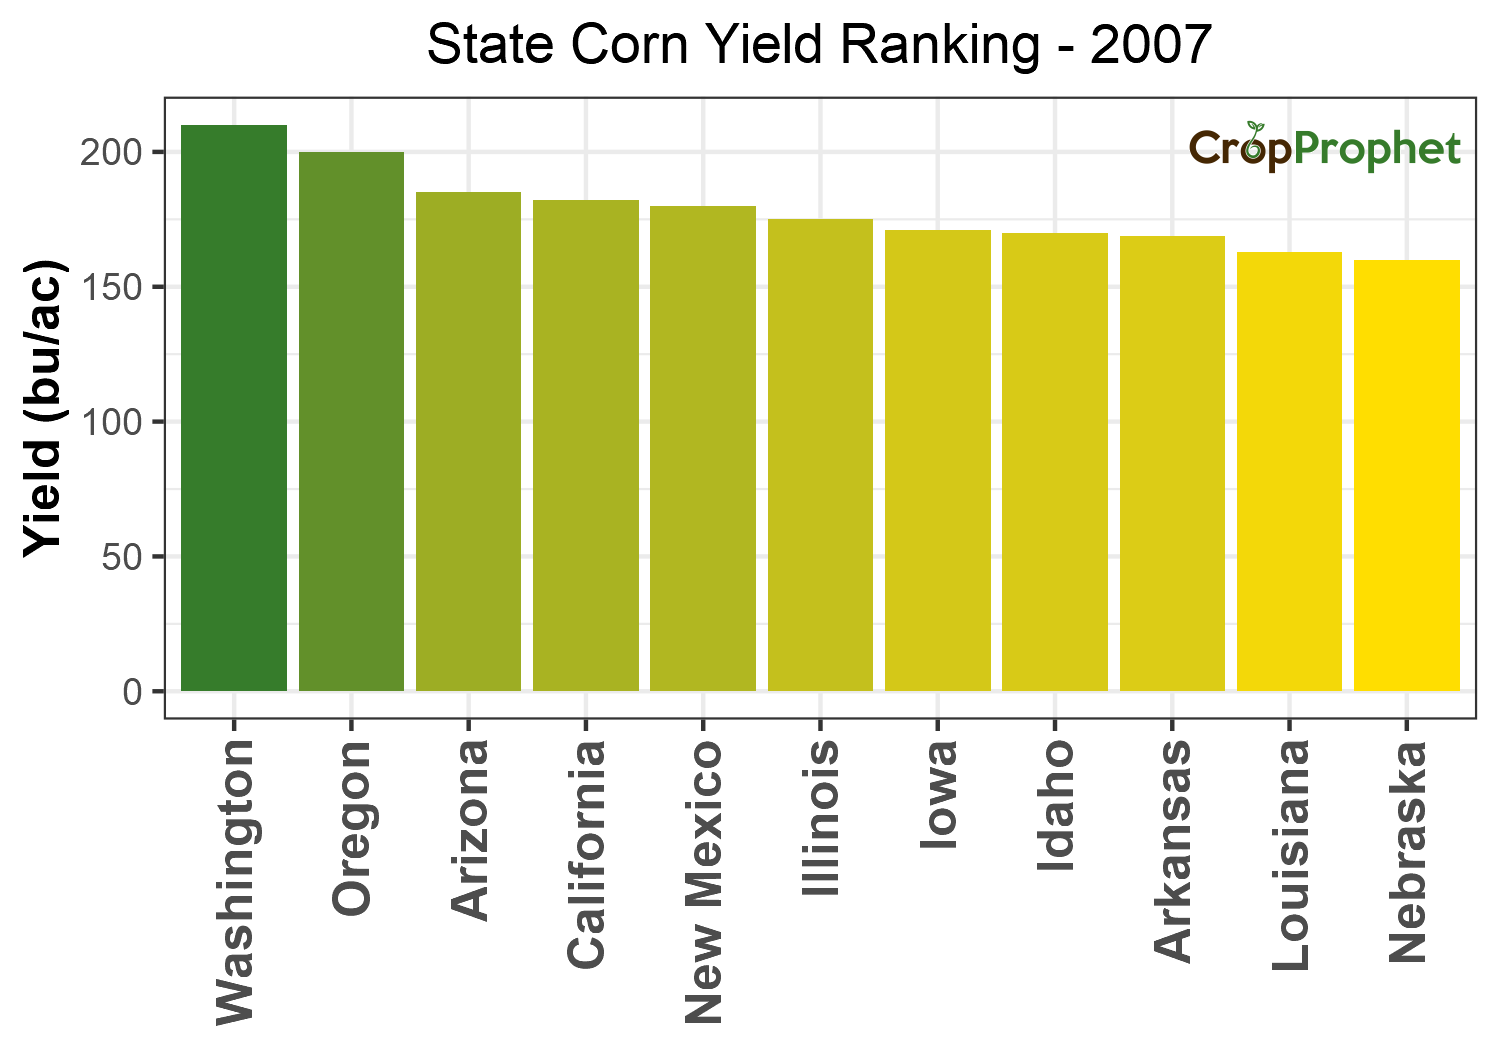
Corn Yield Per Acre by State: Top 11 of 2007
The top 11 corn yield by state of 2007 were:
| Yield Rankings: 2007 | ||
| Rank | State | Yield (bu/ac) |
|---|---|---|
| 1 | Washington | 210 |
| 2 | Oregon | 200 |
| 3 | Arizona | 185 |
| 4 | California | 182 |
| 5 | New Mexico | 180 |
| 6 | Illinois | 175 |
| 7 | Iowa | 171 |
| 8 | Idaho | 170 |
| 9 | Arkansas | 169 |
| 10 | Louisiana | 163 |
| 11 | Nebraska | 160 |
State Corn Yield – 2007
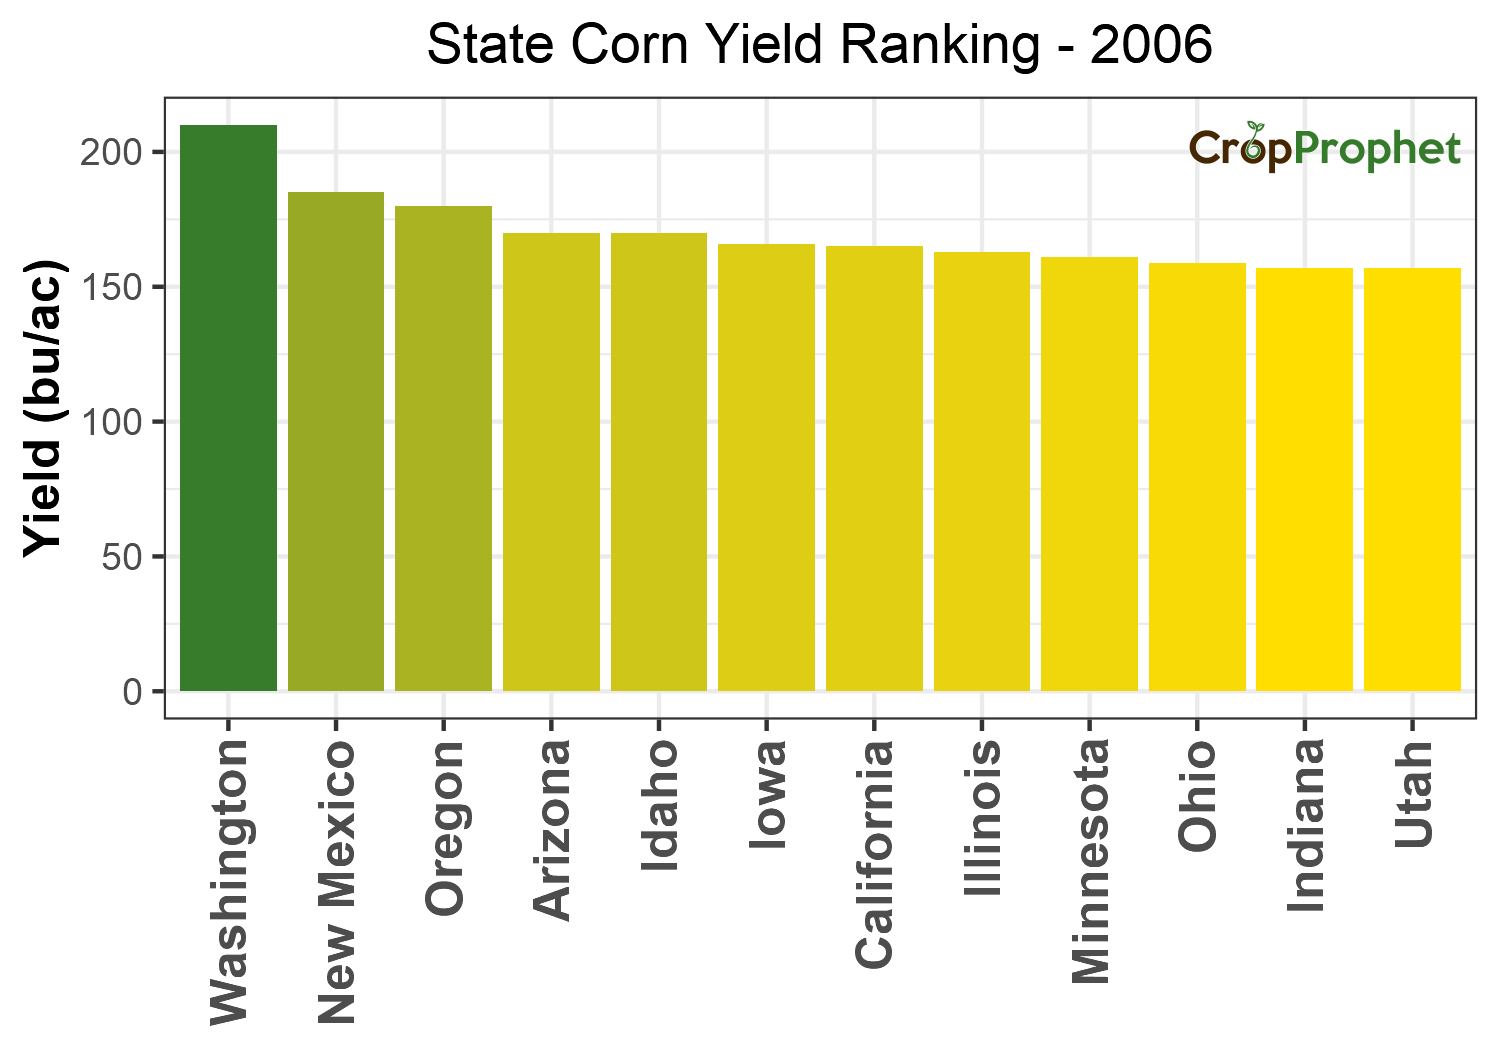
Corn Yield Per Acre by State: Top 11 of 2006
The top 11 corn yield by state of 2006 were:
| Yield Rankings: 2006 | ||
| Rank | State | Yield (bu/ac) |
|---|---|---|
| 1 | Washington | 210 |
| 2 | New Mexico | 185 |
| 3 | Oregon | 180 |
| 4 | Arizona | 170 |
| 4 | Idaho | 170 |
| 6 | Iowa | 166 |
| 7 | California | 165 |
| 8 | Illinois | 163 |
| 9 | Minnesota | 161 |
| 10 | Ohio | 159 |
| 11 | Indiana | 157 |
| 11 | Utah | 157 |
State Corn Yield – 2006
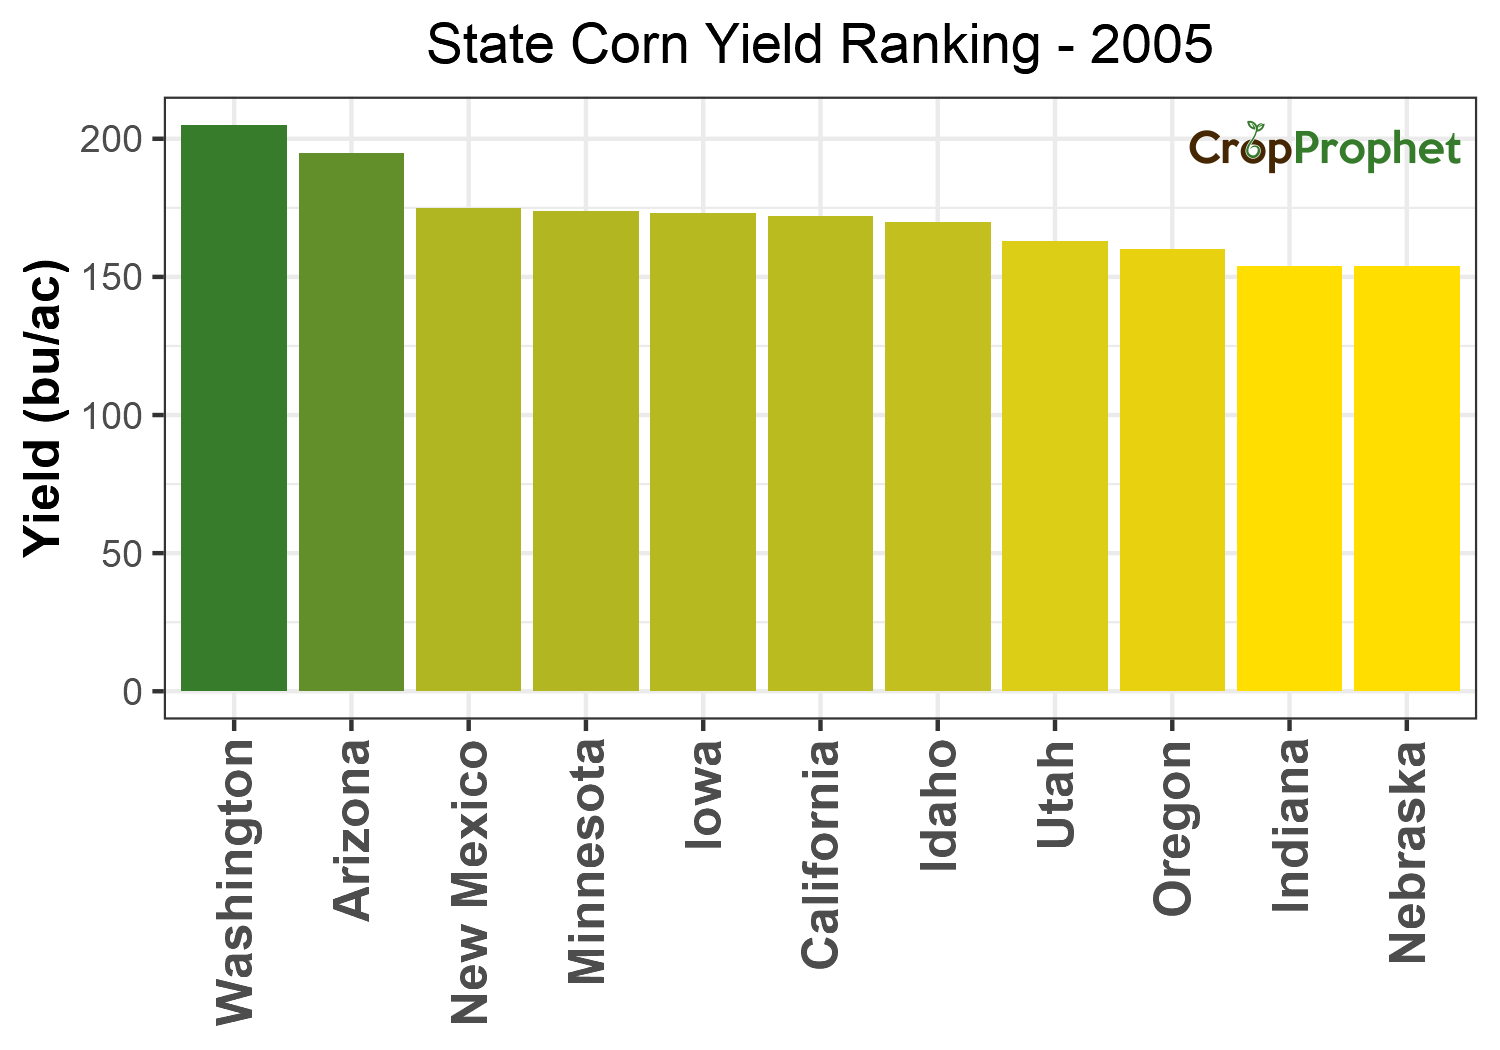
Corn Yield Per Acre by State: Top 11 of 2005
The top 11 corn yield by state of 2005 were:
| Yield Rankings: 2005 | ||
| Rank | State | Yield (bu/ac) |
|---|---|---|
| 1 | Washington | 205 |
| 2 | Arizona | 195 |
| 3 | New Mexico | 175 |
| 4 | Minnesota | 174 |
| 5 | Iowa | 173 |
| 6 | California | 172 |
| 7 | Idaho | 170 |
| 8 | Utah | 163 |
| 9 | Oregon | 160 |
| 10 | Indiana | 154 |
| 10 | Nebraska | 154 |
State Corn Yield – 2005
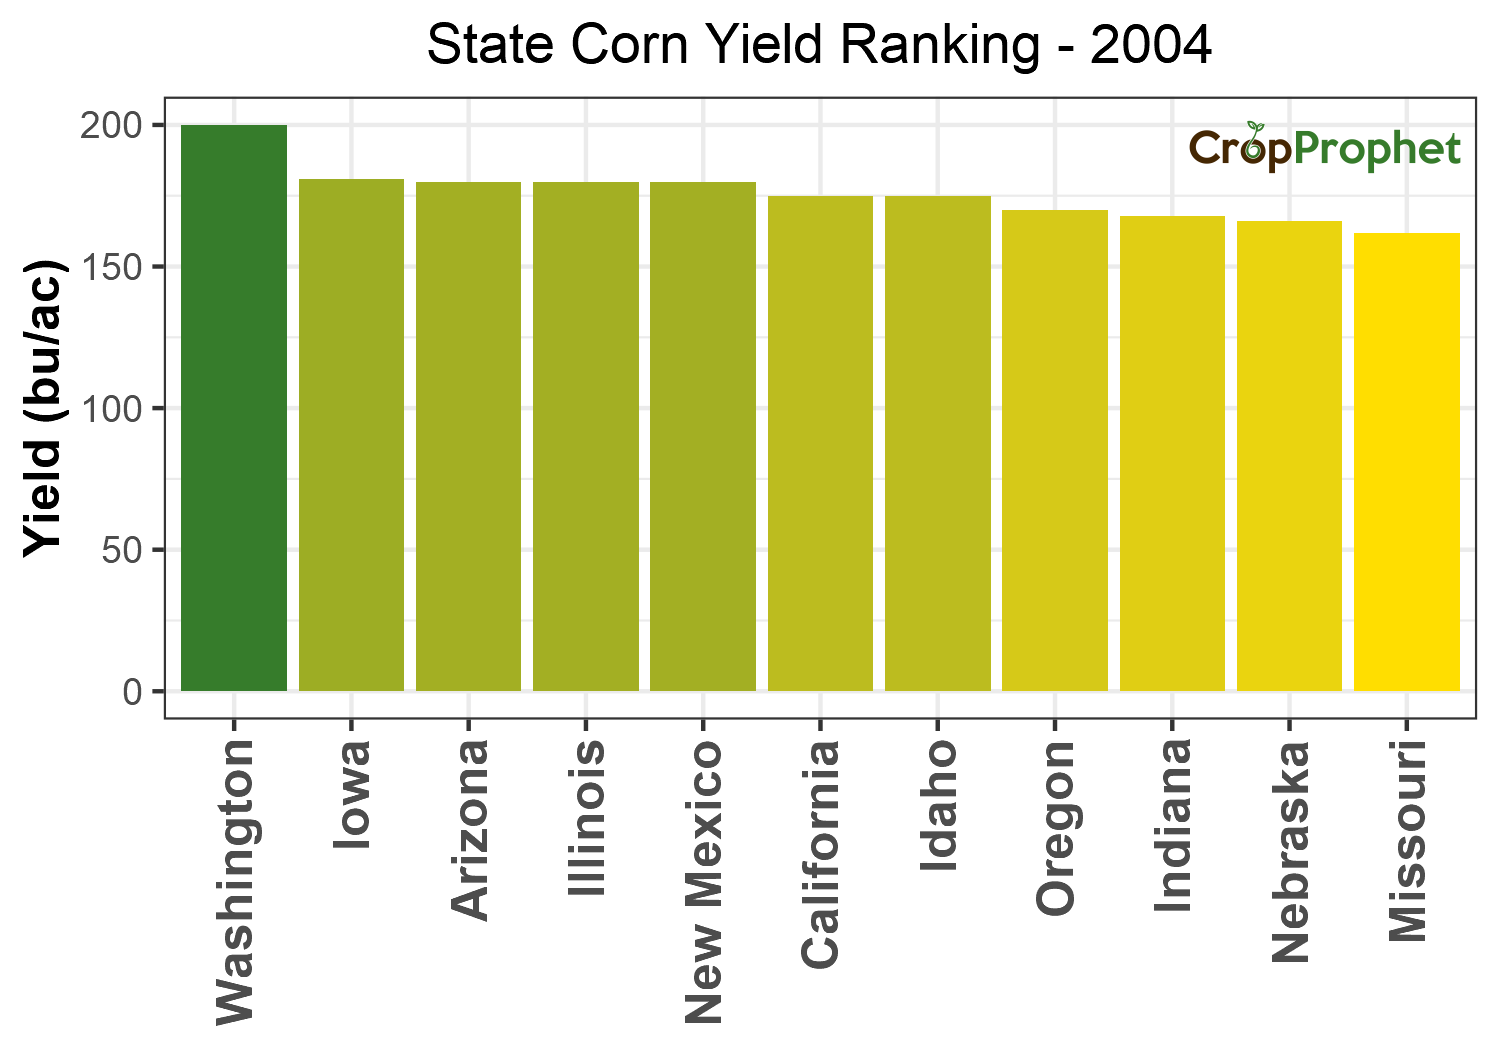
Corn Yield Per Acre by State: Top 11 of 2004
The top 11 corn yield by state of 2004 were:
| Yield Rankings: 2004 | ||
| Rank | State | Yield (bu/ac) |
|---|---|---|
| 1 | Washington | 200 |
| 2 | Iowa | 181 |
| 3 | Arizona | 180 |
| 3 | Illinois | 180 |
| 3 | New Mexico | 180 |
| 6 | California | 175 |
| 6 | Idaho | 175 |
| 8 | Oregon | 170 |
| 9 | Indiana | 168 |
| 10 | Nebraska | 166 |
| 11 | Missouri | 162 |
State Corn Yield – 2004
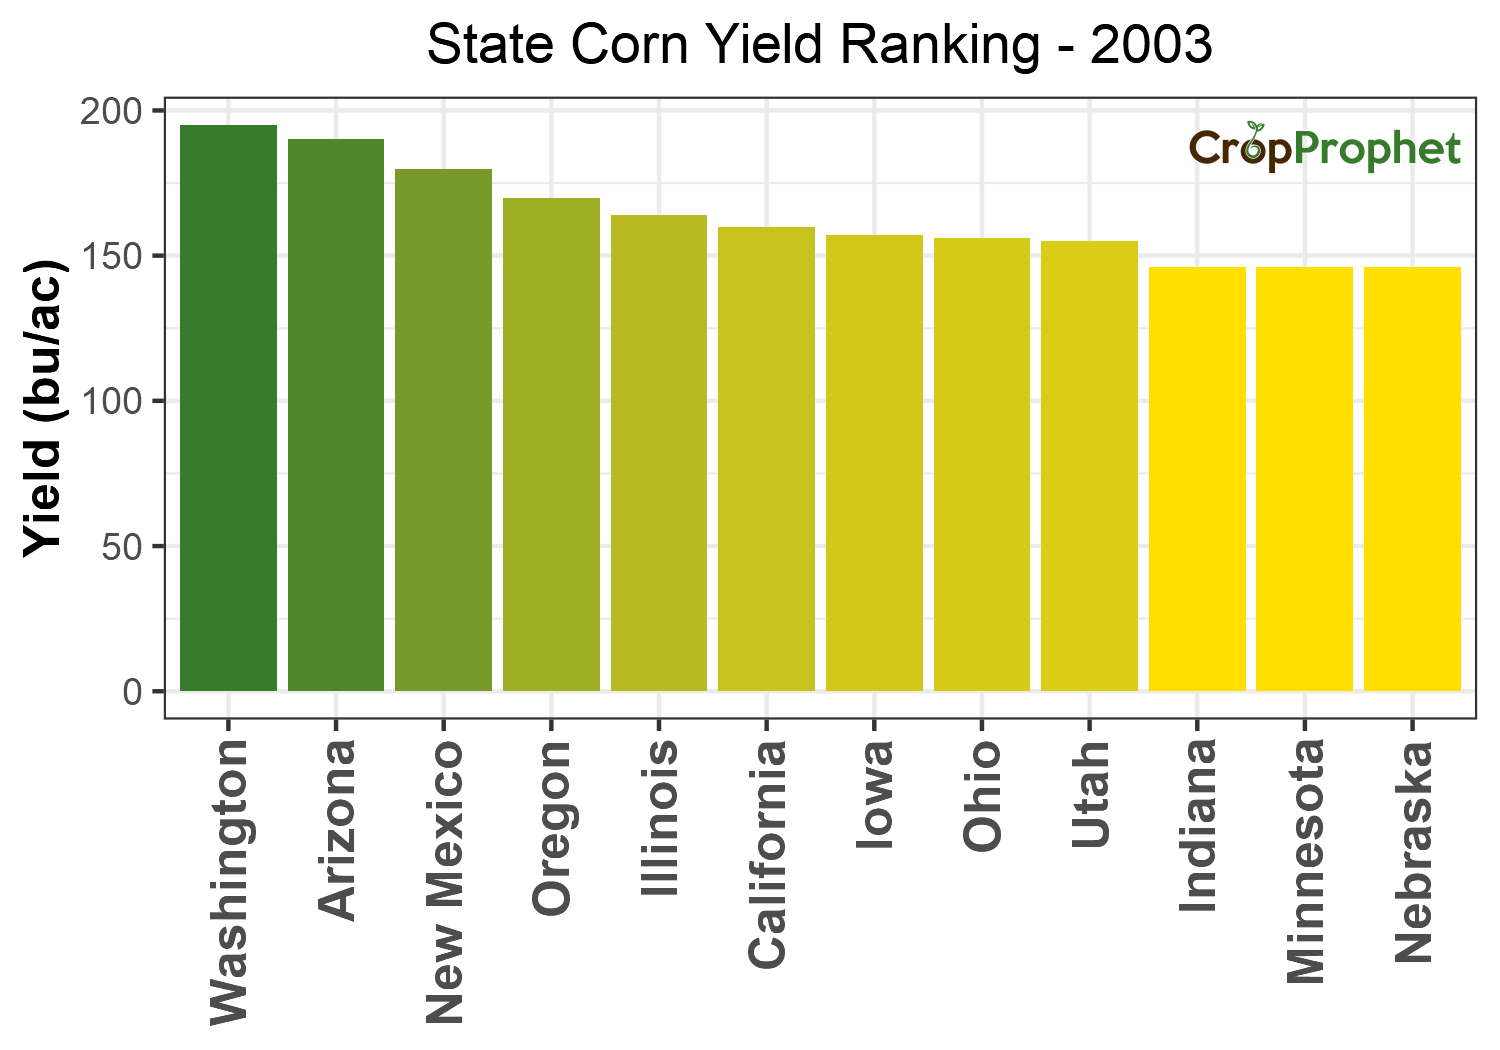
Corn Yield Per Acre by State: Top 11 of 2003
The top 11 corn yield by state of 2003 were:
| Yield Rankings: 2003 | ||
| Rank | State | Yield (bu/ac) |
|---|---|---|
| 1 | Washington | 195 |
| 2 | Arizona | 190 |
| 3 | New Mexico | 180 |
| 4 | Oregon | 170 |
| 5 | Illinois | 164 |
| 6 | California | 160 |
| 7 | Iowa | 157 |
| 8 | Ohio | 156 |
| 9 | Utah | 155 |
| 10 | Indiana | 146 |
| 10 | Minnesota | 146 |
| 10 | Nebraska | 146 |
State Corn Yield – 2003
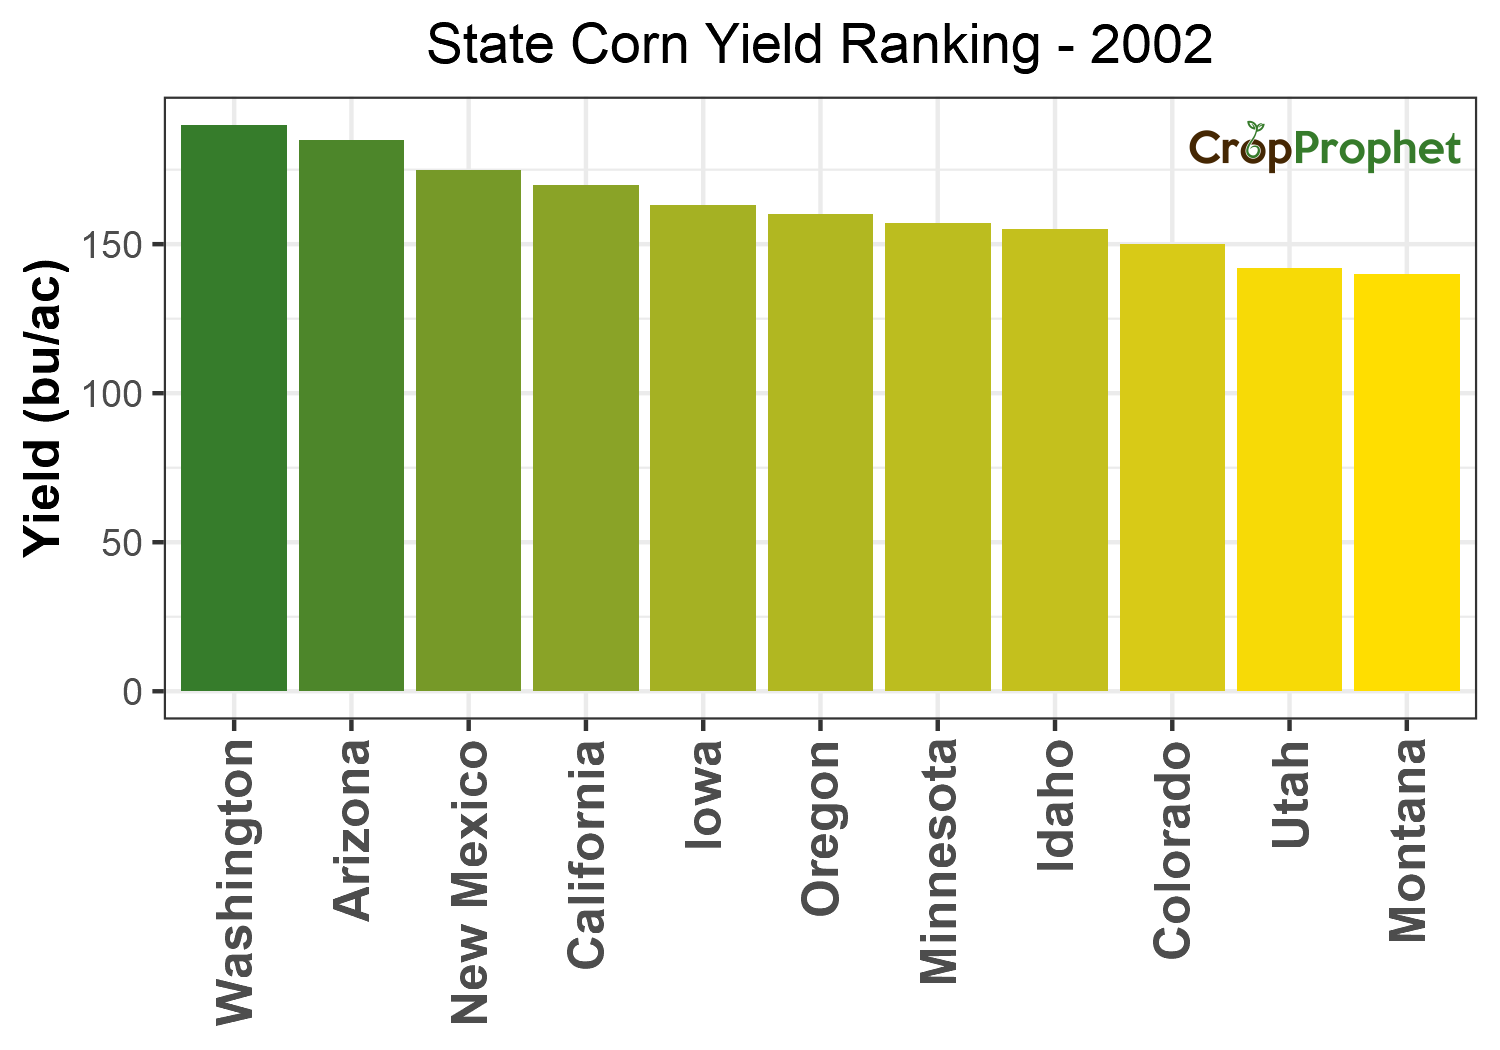
Corn Yield Per Acre by State: Top 11 of 2002
The top 11 corn yield by state of 2002 were:
| Yield Rankings: 2002 | ||
| Rank | State | Yield (bu/ac) |
|---|---|---|
| 1 | Washington | 190 |
| 2 | Arizona | 185 |
| 3 | New Mexico | 175 |
| 4 | California | 170 |
| 5 | Iowa | 163 |
| 6 | Oregon | 160 |
| 7 | Minnesota | 157 |
| 8 | Idaho | 155 |
| 9 | Colorado | 150 |
| 10 | Utah | 142 |
| 11 | Montana | 140 |
State Corn Yield – 2002
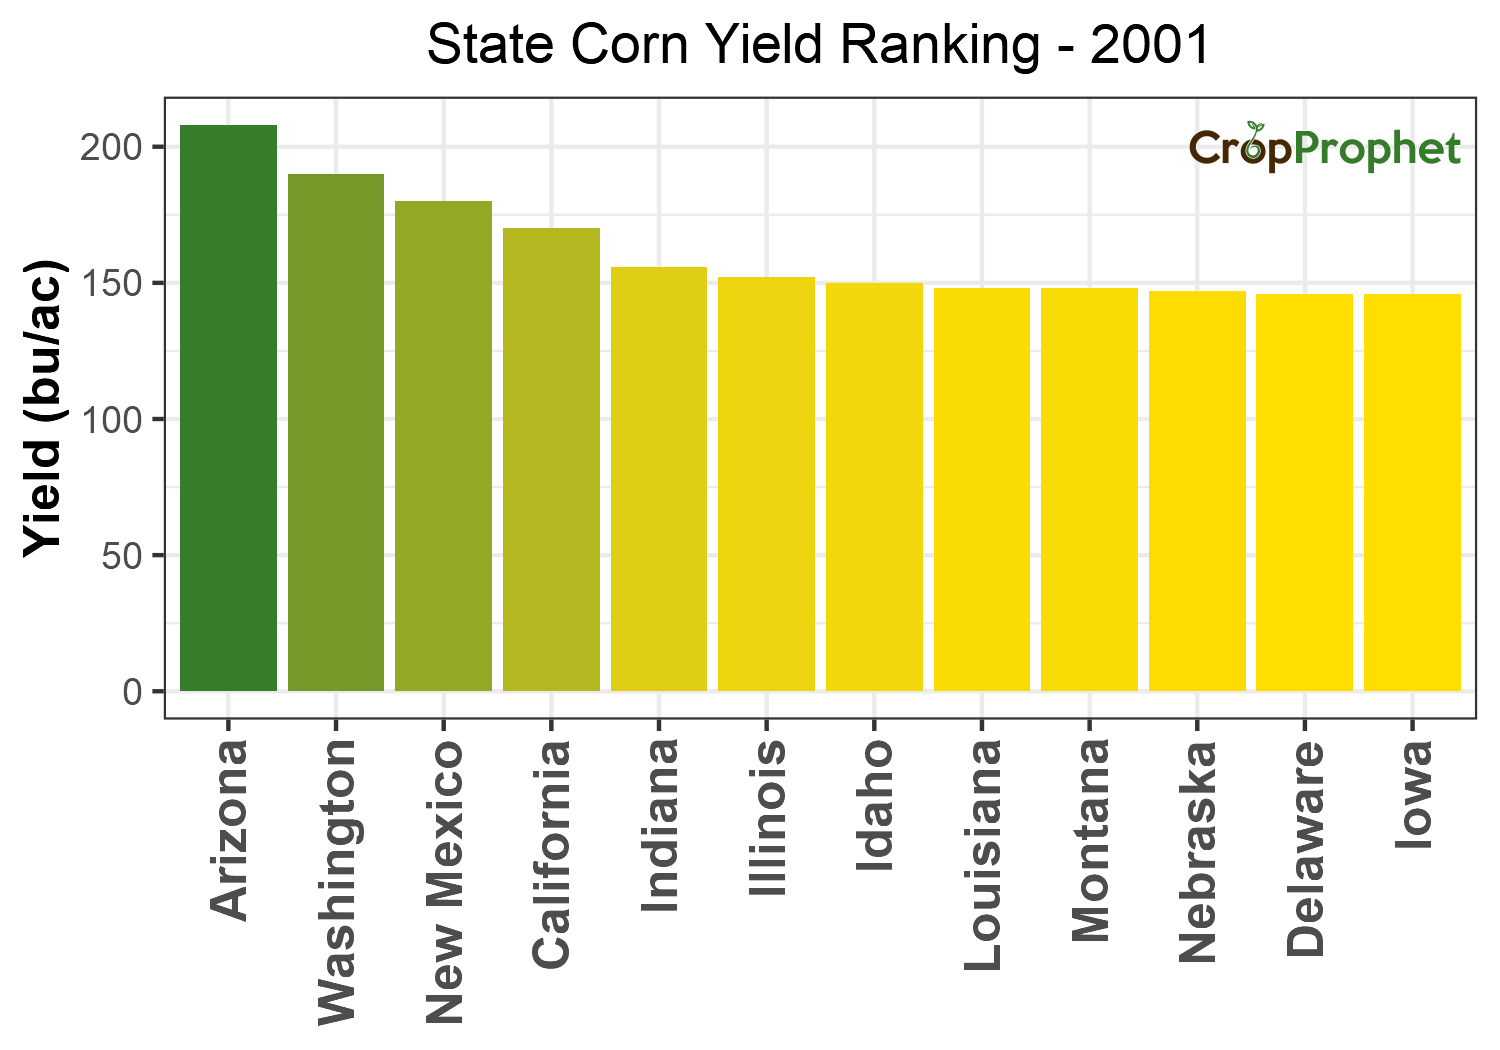
Corn Yield Per Acre by State: Top 11 of 2001
The top 11 corn yield by state of 2001 were:
| Yield Rankings: 2001 | ||
| Rank | State | Yield (bu/ac) |
|---|---|---|
| 1 | Arizona | 208 |
| 2 | Washington | 190 |
| 3 | New Mexico | 180 |
| 4 | California | 170 |
| 5 | Indiana | 156 |
| 6 | Illinois | 152 |
| 7 | Idaho | 150 |
| 8 | Louisiana | 148 |
| 8 | Montana | 148 |
| 10 | Nebraska | 147 |
| 11 | Delaware | 146 |
| 11 | Iowa | 146 |
State Corn Yield – 2001
Corn Yield Per Acre by State: Top 11 of 2000
The top 11 corn yield by state of 2000 were:
| Yield Rankings: 2000 | ||
| Rank | State | Yield (bu/ac) |
|---|---|---|
| 1 | Arizona | 196 |
| 2 | Washington | 185 |
| 3 | Oregon | 180 |
| 4 | California | 170 |
| 5 | Delaware | 162 |
| 6 | Idaho | 160 |
| 6 | New Mexico | 160 |
| 8 | Maryland | 155 |
| 9 | Illinois | 151 |
| 10 | Ohio | 147 |
| 11 | Indiana | 146 |
| 11 | Virginia | 146 |
State Corn Yield – 2000
