Corn Yield Analysis: Weather Impacts After 50% Silking
Introduction
This analysis originates from a customer email that raises an important question about the role of weather after corn reaches 50% of the corn silking stage. The email states:
“I suggest that minimum temperatures and available water have something to do with final yield – and I also suggest that the influence extends over a longer period than just July.”
The customer then asks a statistical question:
“How do you correlate all of that? My guess is that July alone is too early. July 15 to September 1 is probably a better general window. Perhaps a 60-day period starting when the crop reaches 50% pollination works better?”
This analysis uses the Point-in-Time Weather Forecast API and CropProphet Modeler to directly address this customer’s central question:
“Do minimum temperatures, maximum temperatures, and precipitation influence final yield after 50% silking is reached?”
Corn Growing Season Finish – The Analysis
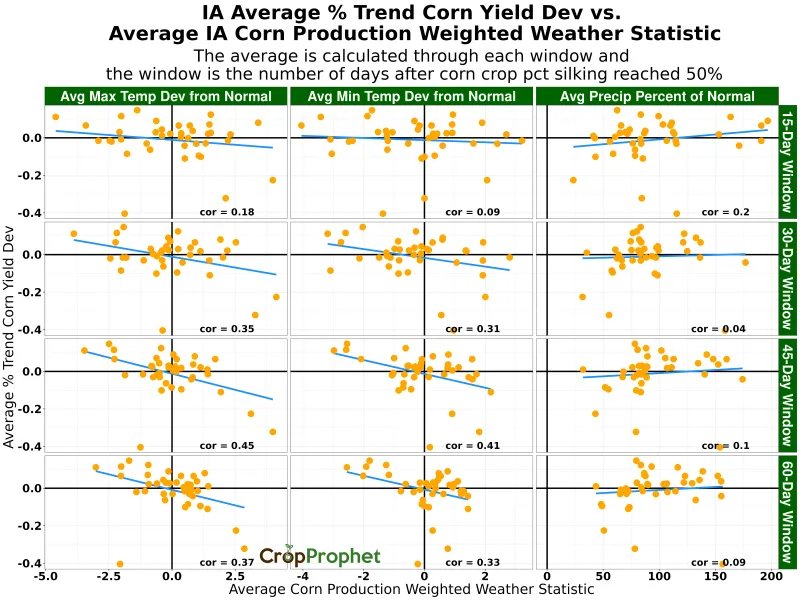
To address the customer’s email, the analysis evaluates observed maximum temperature, minimum temperature, and precipitation during four windows: 15, 30, 45, and 60 days after the corn crop reaches 50% silking in each state.
- Geographic scope: Ten major corn-growing states are included — Iowa, Illinois, Indiana, Kansas, Minnesota, Missouri, Nebraska, Ohio, South Dakota, and Wisconsin.
- Metric evaluated: For each state and time window, average percent trend yield deviations are compared against production-weighted averages of the weather variables.
- Statistical framing: Each window represents the average weather conditions over that period (e.g., 15-day average, 30-day average, etc.), enabling correlation analysis between weather deviations and yield deviations.
This design ensures the analysis aligns directly with the customer’s suggestion that July alone is insufficient, and that a 60-day post 50% corn silking window better represents the kernel fill process.
The graphics below present results for each individual state.
Iowa Post Silking Weather Impacts
Illinois Post Silking Weather Impacts

Indiana Post Silking Weather Impacts

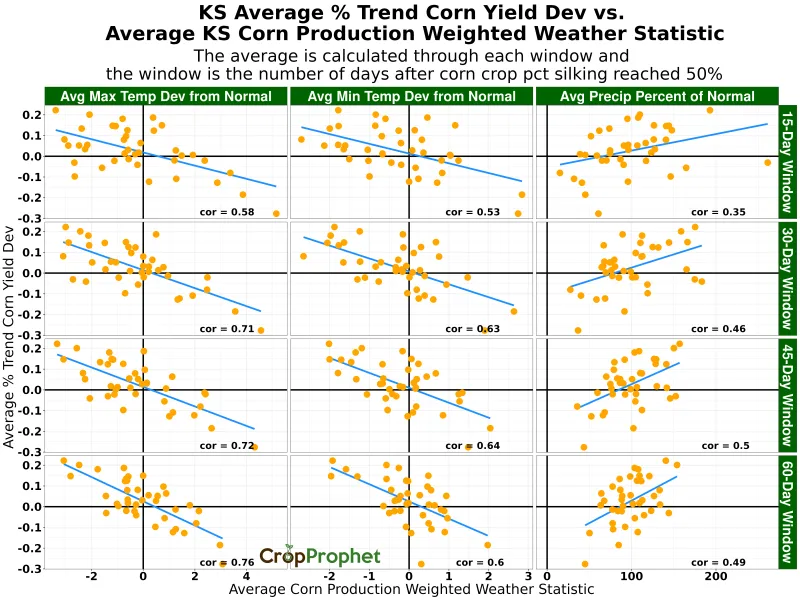
Kansas Post Silking Weather Impacts
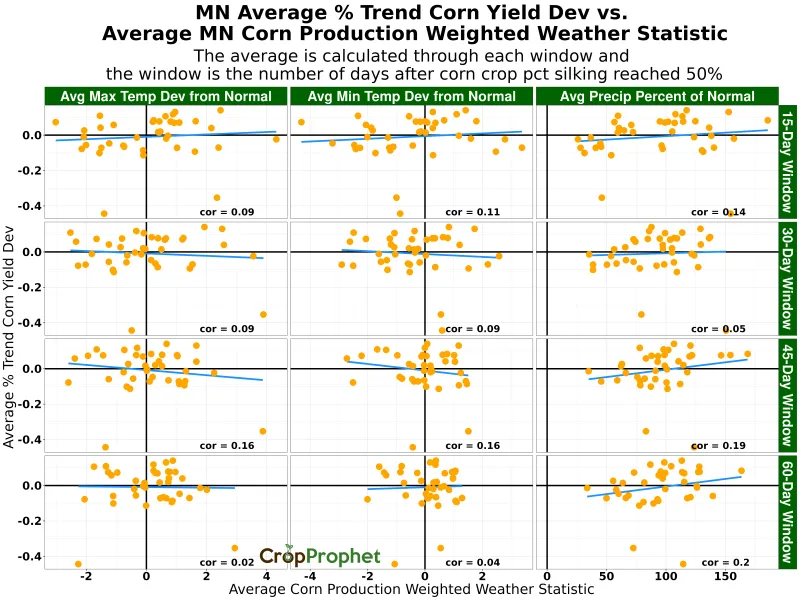
Minnesota Post Silking Weather Impacts
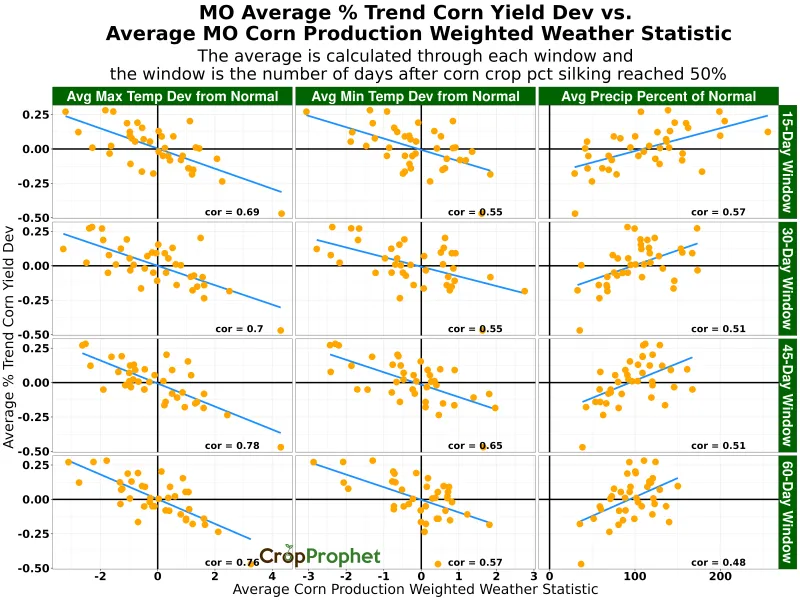
Missouri Post Silking Weather Impacts
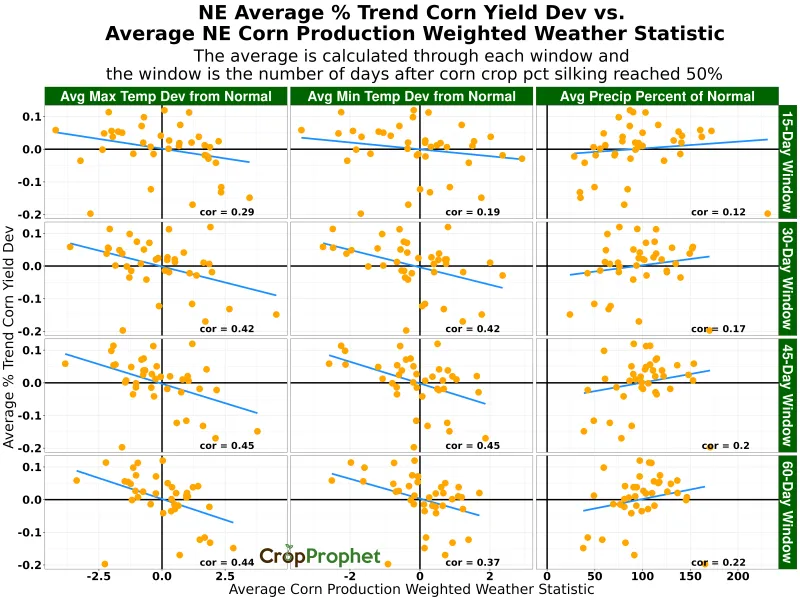
Nebraska Post Silking Weather Impacts
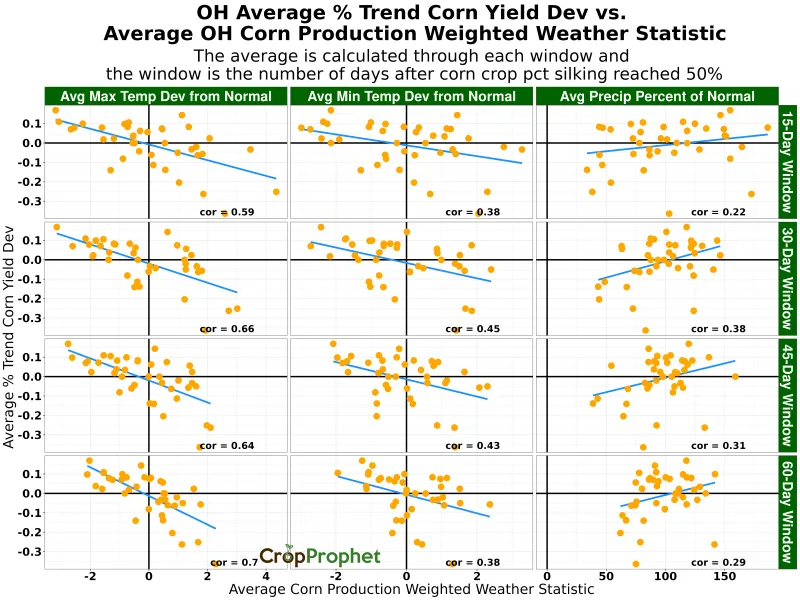
Ohio Post Silking Weather Impacts
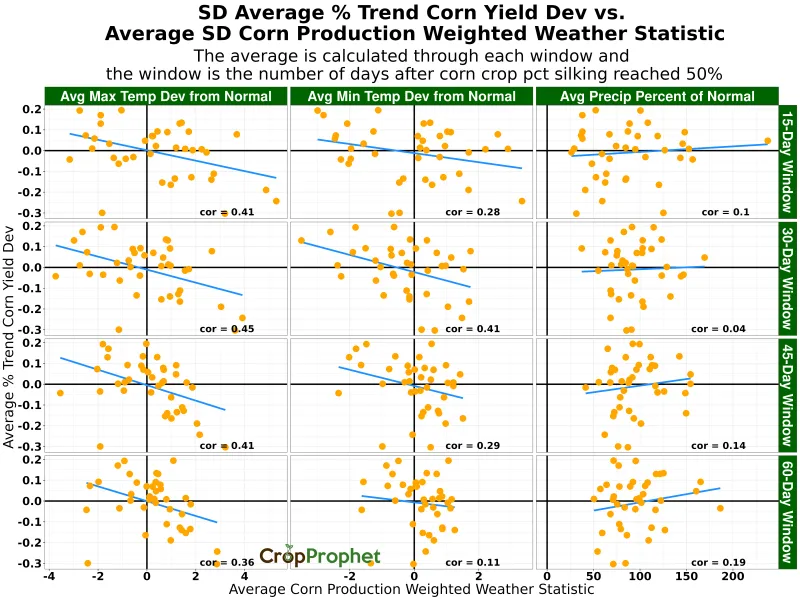
South Dakota Post Silking Weather Impacts
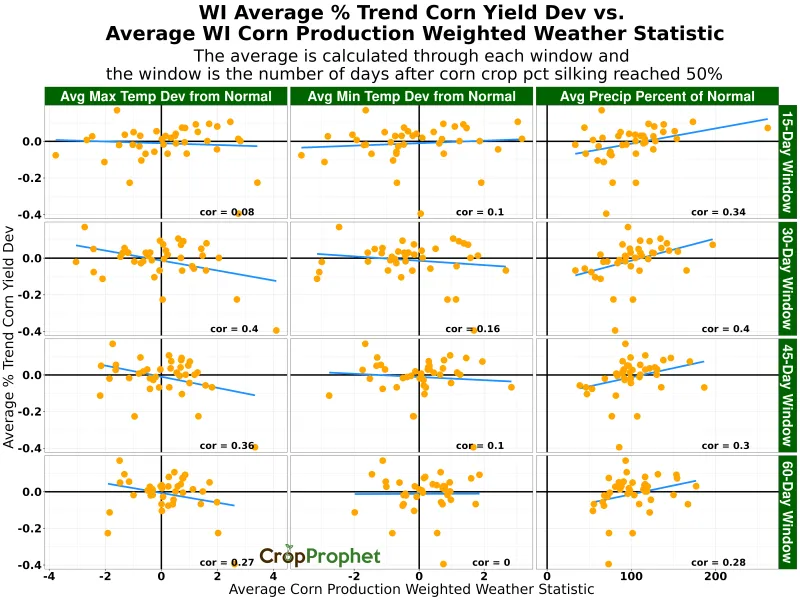
Wisconsin Post Silking Weather Impacts
Corn Yield Impacts – Results
End of Crop Season Temperatures
- Cooler-than-normal maximum and minimum temperatures align with positive corn yield deviations.
- Warmer-than-normal maximum and minimum temperatures align with negative corn yield deviations.
- These findings confirm the customer’s theory that lower temperatures during pollination and kernel fill support stronger yields.
End of Crop Season Precipitation
- Precipitation exhibits a positive slope relationship.
- Above-normal precipitation aligns with positive corn yield deviations.
- Below-normal precipitation aligns with negative corn yield deviations.
- This result supports the customer’s assertion that water availability beyond pollination remains essential for yield outcomes.
Corn Yield State-Level Consistency
Across the “I States” and other key production regions, the relationship is consistent:
- Cool, wet conditions after 50% silking correlate with stronger corn yields.
- Hot, dry conditions correlate with weaker corn yields.
- The impact of temperature deviations generally outweighs precipitation in terms of correlation strength.
Growing Season Finish – Conclusion
The customer asks:
“Does minimum temperature, maximum temperature, and precipitation influence final yield after 50% silking is reached?”
The analysis demonstrates that the answer is yes. All three weather variables strongly influence corn yield outcomes during the 15- to 60-day window following corn crop 50% silking is reached. The kernel fill period, as described in the email, proves critical — and the Point-in-Time Weather Forecast API and CropProphet Modeler quantify and visualize this relationship across states.
This evidence shows that yield outcomes are not simply a function of July weather but instead depend on conditions during the broader post-silking period.