Introduction: Corn Yield Risk
The risk of corn yield forecast declines occurring during the remainder of July 2020 is analyzed using a weather scenario approach.
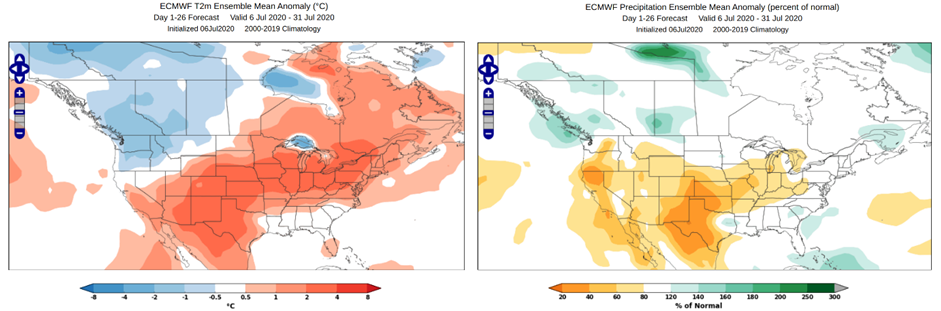
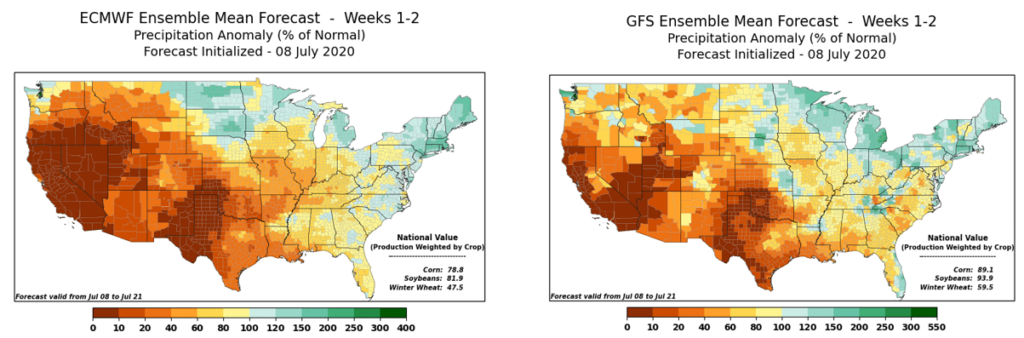
Recent long-range forecasts created by the World Climate Service, a separate product of Prescient Weather, show increased probabilities of above-normal temperature and below normal precipitation across the U.S. Corn Belt for the remainder of July 2020 (see below).
Since the objective of CropProphet is to quantify the impact of weather on grain yields, we have prepared a scenario analysis to examine the potential corn yield risk arising from the persistent heat. We use three historical years with significant July heat waves to quantify the potential 2020 effects for corn.
Corn Yield Risk Scenarios: Methodology
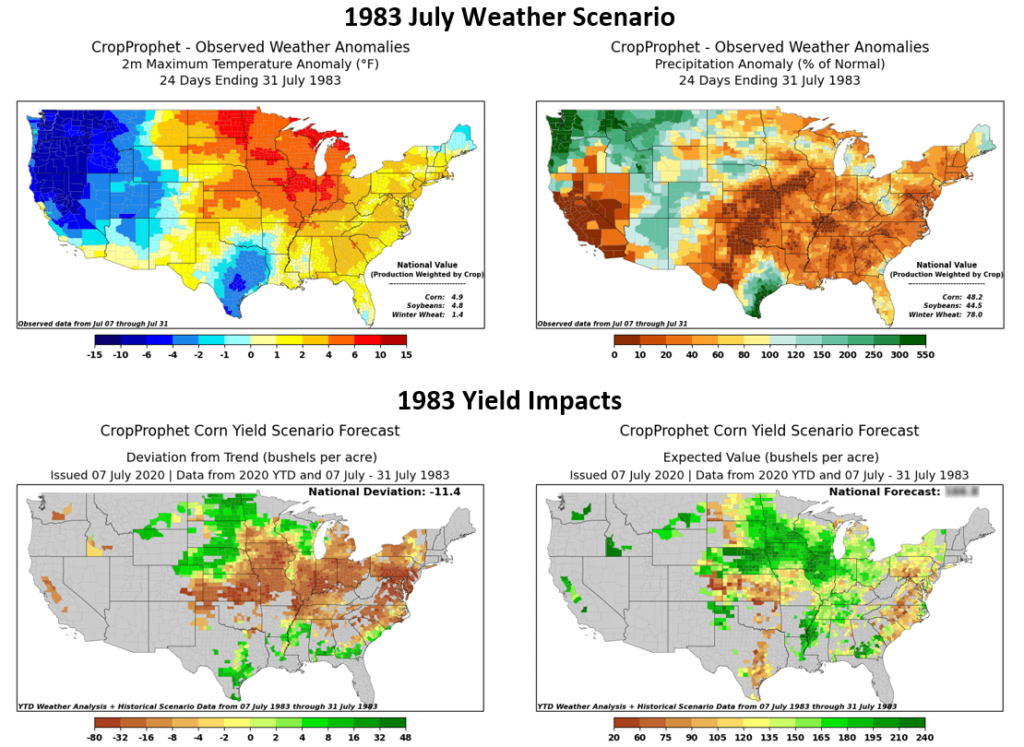
We examined three of the hottest July’s in the past 40 years across the Corn Belt: 1983, 1988, and 2012. We ask the question, “what would the yield impact be in 2020 if the weather from July 7th to July 31st in those years occurs during the remainder of July 2020?”. For each year, we show the observed temperature and precipitation anomaly maps from July 7-31 along with the accompanying yield scenario maps. The scenario maps are created by running the July 7-31 weather data from those prior years through our weather-based corn yield model.
Recall that the national level yield forecasts in CropProphet are a combination of both a pure weather-based model and a proprietary USDA crop condition model. The analysis provided here shows results from only the weather model and does not include the impacts of changing crop ratings on the yield forecast.
If the projected heat for the remainder of July verifies, then the yield declines and their concomitant impact on production could become quite significant in some areas, especially where it remains dry.
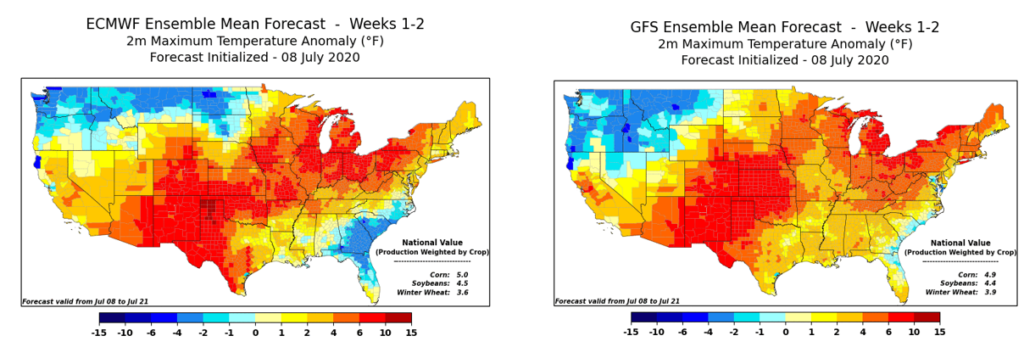
Antecedent conditions in 2020, however, are not nearly as dry as years such as 2012 and 1988, and consequently, the yield outcome is unlikely to be as dire as occurred in those years. Nevertheless, it is worth noting that the latest ECMWF and GEFS 2-week temperature forecasts (as of July 7, 2020) are nearly 5°F above normal on a corn production weighted basis (see below). For some perspective, the hottest July on record was 2012 when production weighted maximum temperatures were 6.5°F above normal, followed by 1983 at 4.1°F above normal. Thus, if these model forecasts are correct, the stage may be set for July 2020 to rank as the second hottest on record.
Each of the scenarios is documented in the pages that follow.

1983 July Corn Yield Weather Risk Scenario
1988 July Corn Yield Weather Risk Scenario
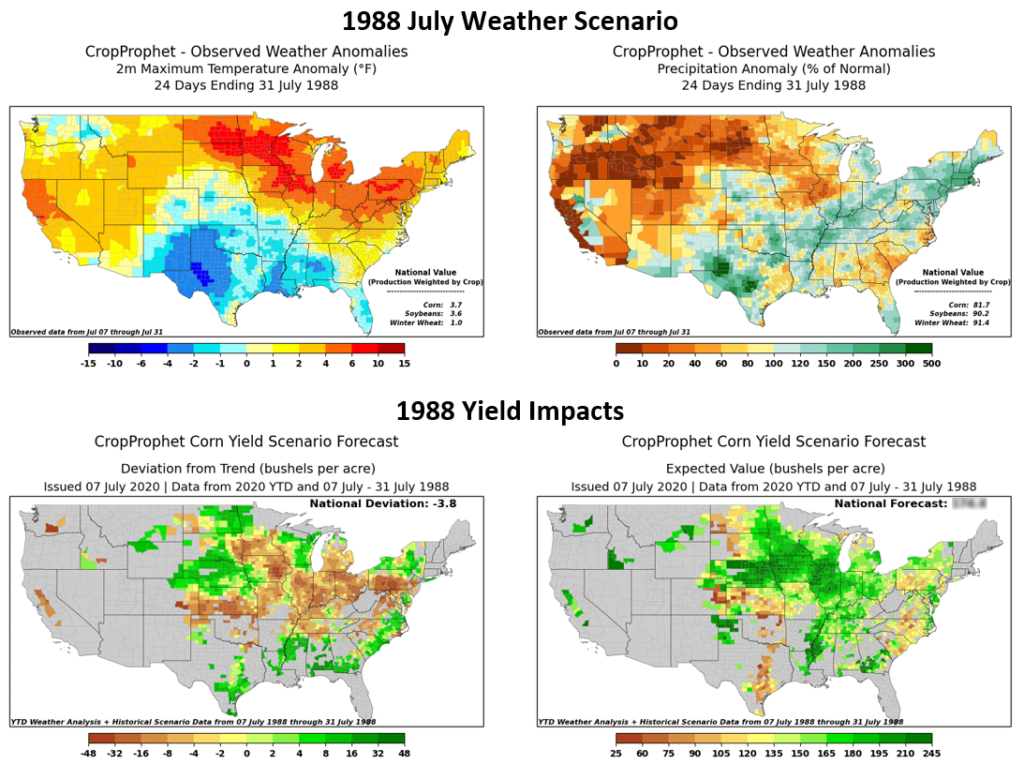
It’s possible to look back to 1988 via our corn yield forecast animations. These show how the daily updated forecast progressed during the season. These are not the result of our scenario analysis but are a result of CropProphet “hindcasting” of the full 1988 season.
2012 July Corn Yield Weather Risk Scenario
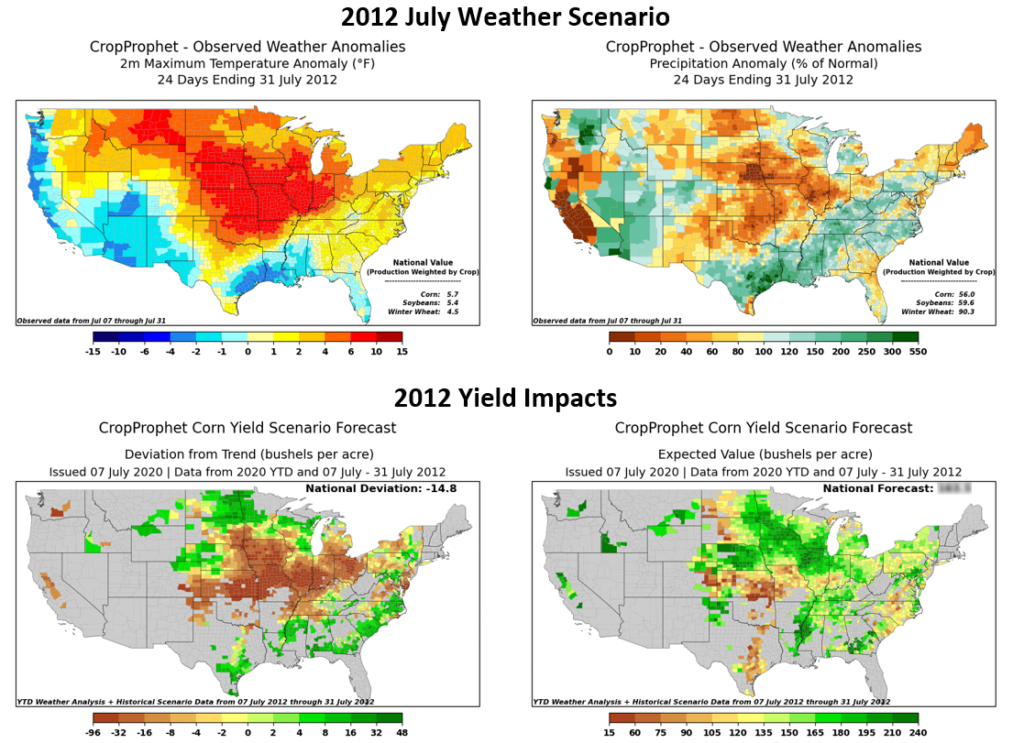
We can also look at how the 2012 corn yield forecast progressed day by day during the crop season.
Corn Yield Risk: Summary
Under the assumptions stated above, the projected U.S. corn yield in this scenario analysis varies from 1xz.4 to 1y3.5 [CropProphet does not release national yield estimates during the crop season to protect product value for our customers] bushels per acre, reflecting a drop of -5.0 to -15.9 bushels per acre relative to the corn yield forecast as of July 8th, 2020. This provides a realistic range of yield changes if the weather is significantly hotter and drier than normal across the central U.S. during the remainder of July 2020.
Request a trial of CropProphet to minimize weather-based risk and maximize weather-based opportunity.