Introduction
A CropProphet customer recently suggested that an increase in corn-on-corn planting, i.e., planting corn on fields that grew corn the year prior, may help explain the significant decline in Iowa 2020 corn yields. This post explores this idea using the historical data available from CropProphet.
Is Corn-on-Corn Yield Drag Reflected in USDA Yield Data?
The January 12, 2021, USDA release of year-end estimated U.S. corn and soybean yield surprised the futures markets. The USDA’s national corn yield estimate was lowered from a November estimate of 175.8 bu/ac to 172 bu/ac. Likewise, the USDA reduced its Iowa yield estimate from a November 2020 report of 184 bu/ac to 178 bu/ac. As of November 15, the CropProphet 2020 Iowa corn yield forecast was 191.9 bu/ac.
While that forecast is well below the technology trend yield, it does not approach the USDA’s 23.1 bu/ac yield deficit. Each season we compare the CropProphet performance against the USDA end-of-season estimates, seeking insight regarding opportunities to improve the model. Since the weather is the primary cause of year-to-year variations in corn and soybean yields, we seek to understand our model performance relative to the USDA end-of-season estimates.
A recent Twitter thread by Scott Irwin of the University of Illinois provides some interesting thoughts regarding the surprisingly low 2020 US national corn yield.
https://twitter.com/ScottIrwinUI/status/1349391639723339782.
Corn-on-Corn Yield Drag
The “Corn-on-Corn Management Guide” from https://www.corn-states.com provides studies demonstrating that rotating corn plantings leads to a 15% higher yield than corn-on-corn acres. With this in mind, the CropProphet customer suggested that year-over-year (YoY) change in Iowa corn planted acres may represent a proxy for changes in corn-on-corn planting and help to explain Iowa’s 2020 corn yield estimate.
USDA Iowa Planted Acres
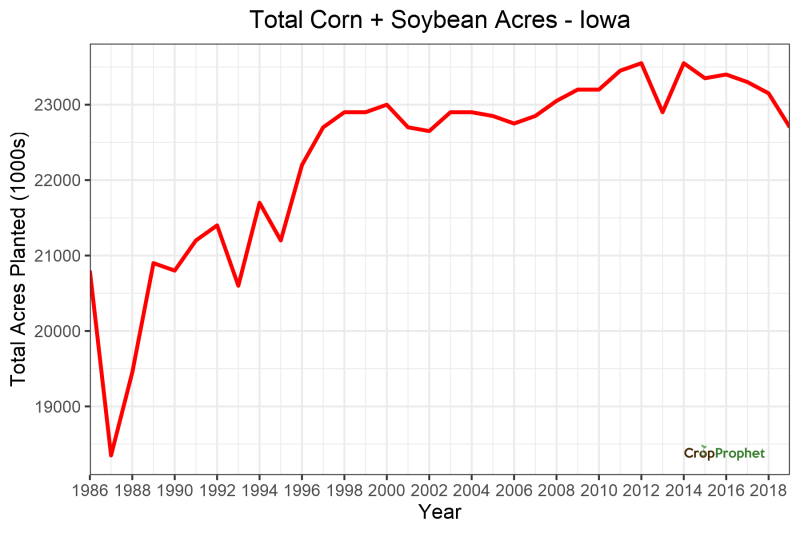
To start, we use the historical USDA planted acreage data available from the CropProphet Modeler solution. In this case, we’ll look at combined Iowa corn and soybean planted acres.
Total corn+soybean planted acres increased from 1987 to 1998. Since we do not want overall changes in producer practices to affect the results, we’ve limited the study to all years since 1998 inclusive.


Annual Change in Iowa Planted Acres
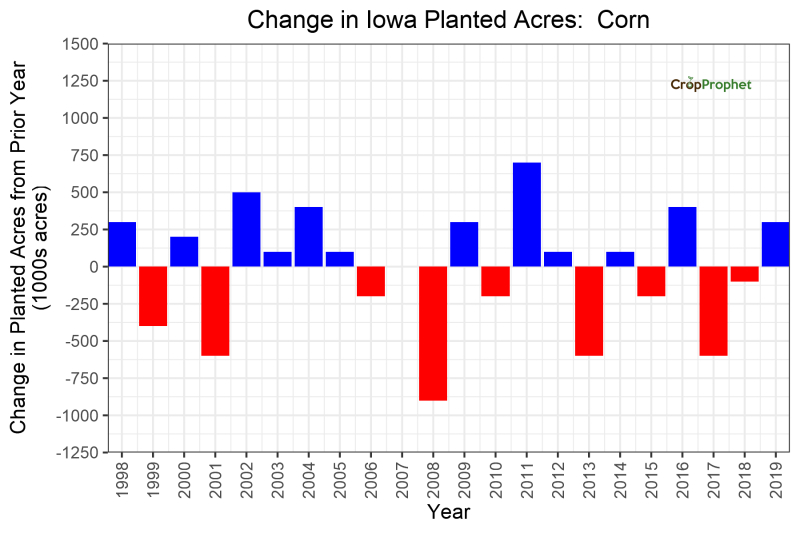
The YoY change in Iowa corn planted acres is shown below. We see frequent alternation between increases and decreases in corn planted acres.
Iowa Corn Yield Deviation From Trend
Our goal is to compare the YoY change in corn planted acres with the yield deviation from the trend. The Iowa corn yield deviations from the technology trend yield since 1998 are shown below.
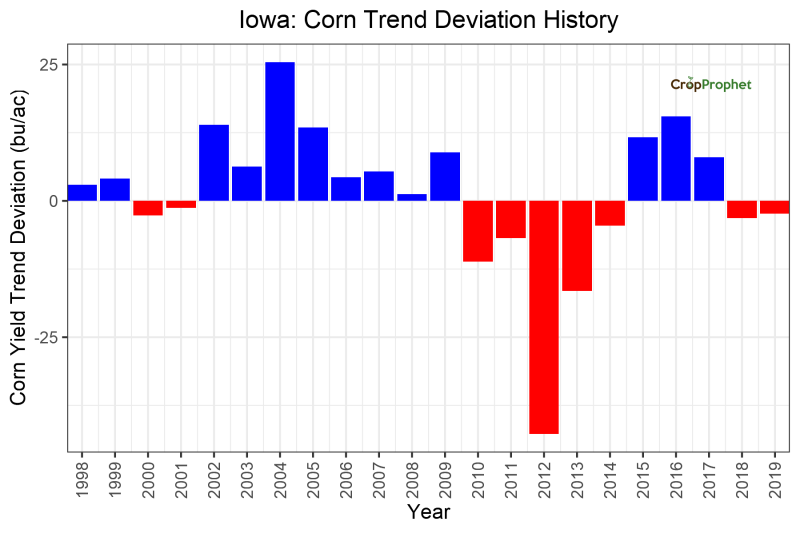
The next step is to merge these two data sets into one analysis, facilitating comparison between changes in corn planted acres and the deviation from trend yield.
Iowa Change in Acreage vs. Deviation from Corn Technology Trend
Our question is: Do YoY changes in Iowa corn planted acres measurably impact corn yield? If this relationship is evident in the data, we should see that years with increases in corn planted acres display reduced yields relative to years in which corn planted acres decreased. According to the original supposition, years with YoY decreases should indicate reduced corn-on-corn planted acres and therefore increased yields.
The graph comparing the two pieces of data is below.
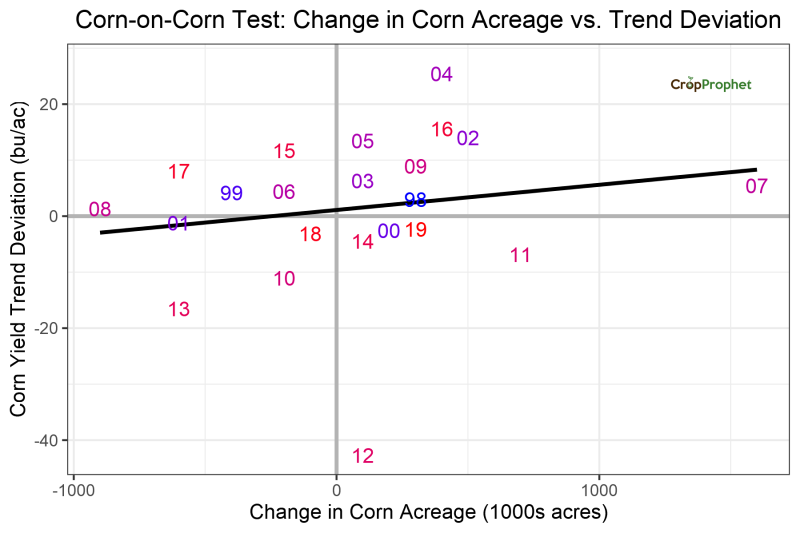
Your eye may be drawn to the possibility of a relationship in the data. However, a line fit through these data points suggests no relationship exists between YoY changes in corn planted acres and the end of season yield. We conclude that the data shows a very weak relationship opposite to the hypothesis, so there is no support for the idea that increased acreage is a yield drag.
Soybean-on-soybean Yield Drag Comparison
Having completed the analysis for corn, we can repeat the process for soybeans.
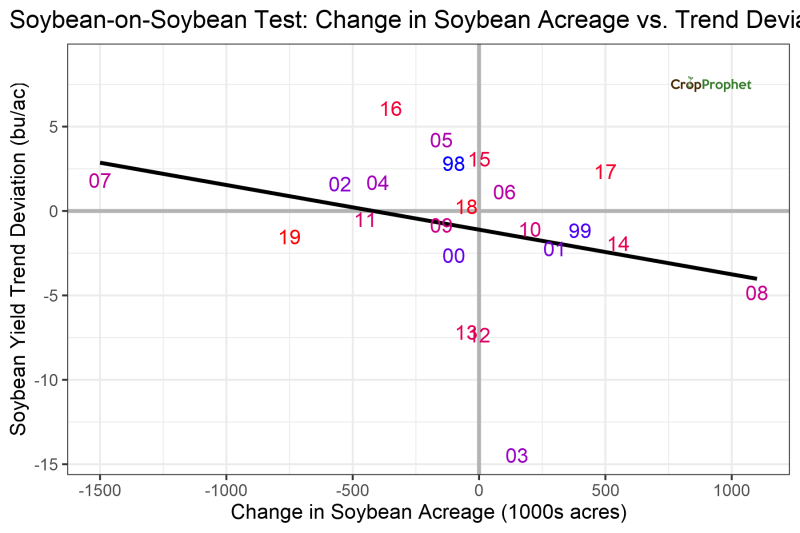
The soybean YoY change in planted acres vs. trend yield deviation also appears visually suggests a relationship. In this case, a line is fitted through the data using linear regression. However, even in this case, the R2 of the regression is 0.09, which is still very low. The estimated regression coefficients are not statistically significant. We come to the same conclusion as for corn. Changes YoY soybean planted acres do not help explain changes in YoY Iowa soybean yields.
CropProphet Historical Crop Data
CropProphet provides more than crop yield and production forecasts. Our data solutions enable rapid analysis of historical weather data and crop performance and supply. Discover the benefits of access to CropProphet. Request your trial today.