Top States US Corn Yield History
The information below is provided by the USDA NASS and documents the corn yield history of the major corn producing states in the United States. CropProphet, a corn yield forecasting product, is designed to forecast these years to year variations.
An analysis of state corn yield history data, indicates there are two causes of corn yield per acre variations at the regional level in the United States. Both are important to creating an accurate corn yield forecast. The causes of year-to-year corn yield variations at the state and national level are:
- The Technology Trend – many types of technology is improving corn yields. The result is an increase of how much corn can be produced on a given acre of farmland. The charts below show corn yields from 1986 to 2017 as reported by the USDA. The general upward slope of the line is the technology trend.
- Weather conditions during the corn growing season – after removing the effect of the technology trend, the impact of weather on corn can be estimated. The variations around the upward trend in the data on these charts are cause by weather conditions during the US growing season. CropProphet uses the evolving weather conditions during each crop season to forecast end-of-season yields and production.

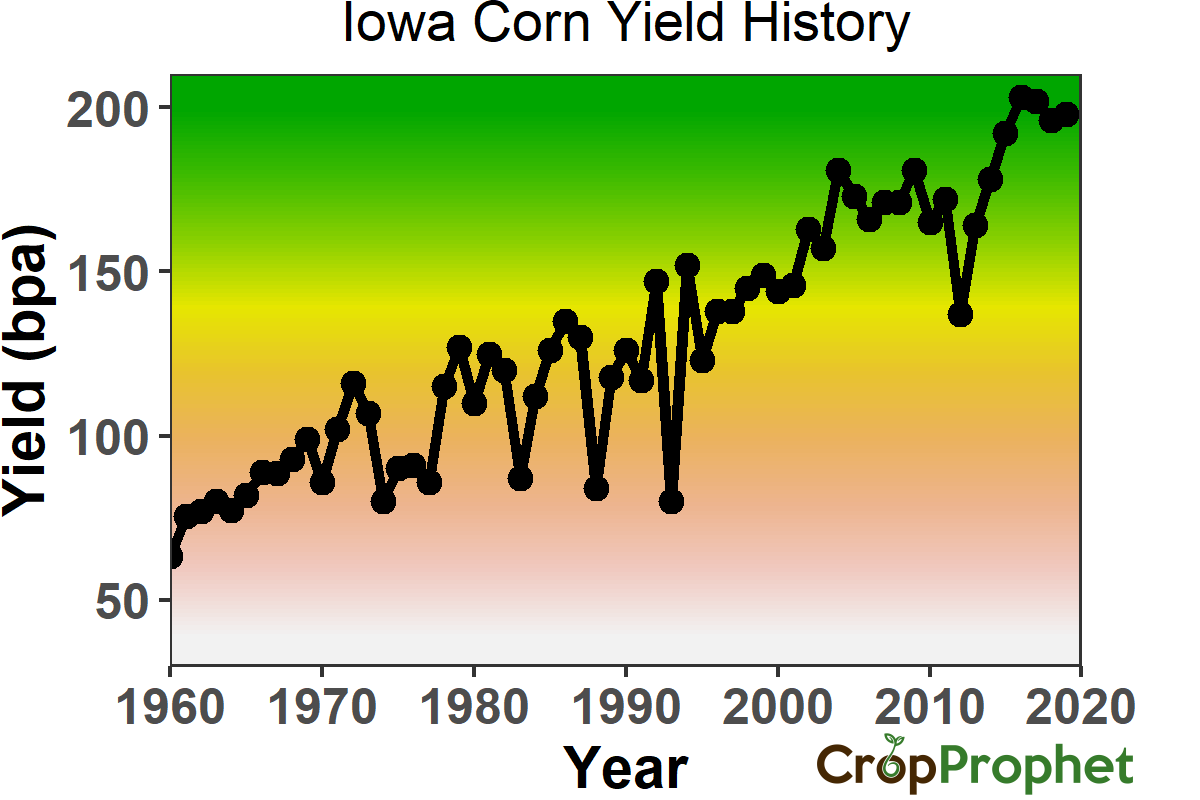
Iowa Corn Yield History – Iowa Corn Yield Per Acre History
Iowa’s maximum corn yield achieved is 203 bu/a which occurred in 2016
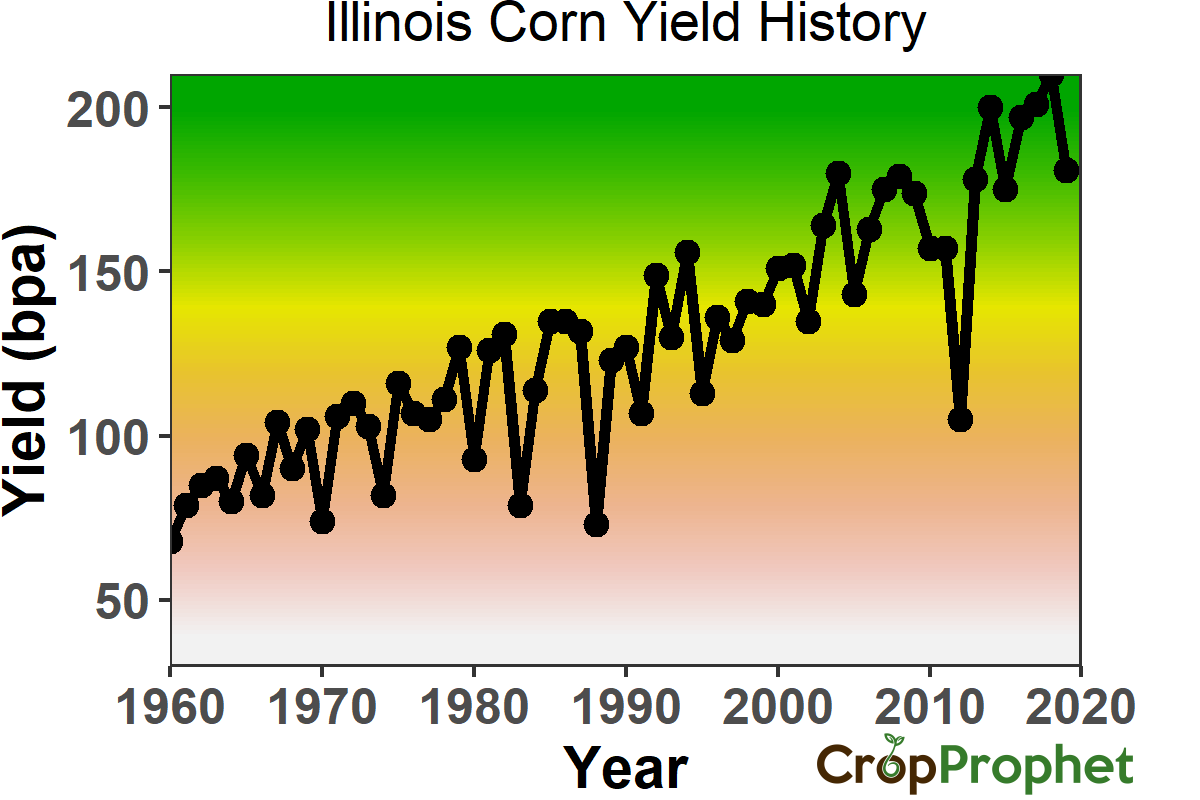
Illinois
Illinois’s maximum corn yield achieved is 210 bu/a which occurred in 2018
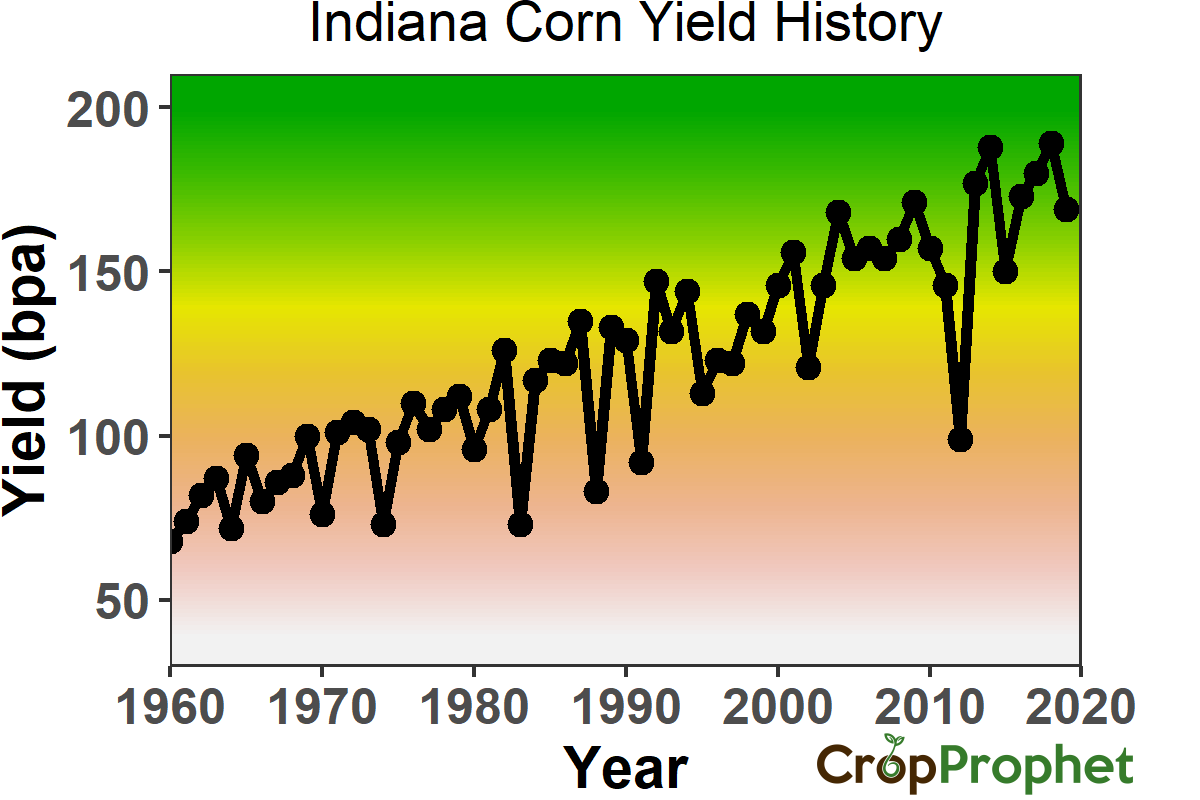
Indiana
Indiana’s maximum corn yield achieved is 189 bu/a which occurred in 2018
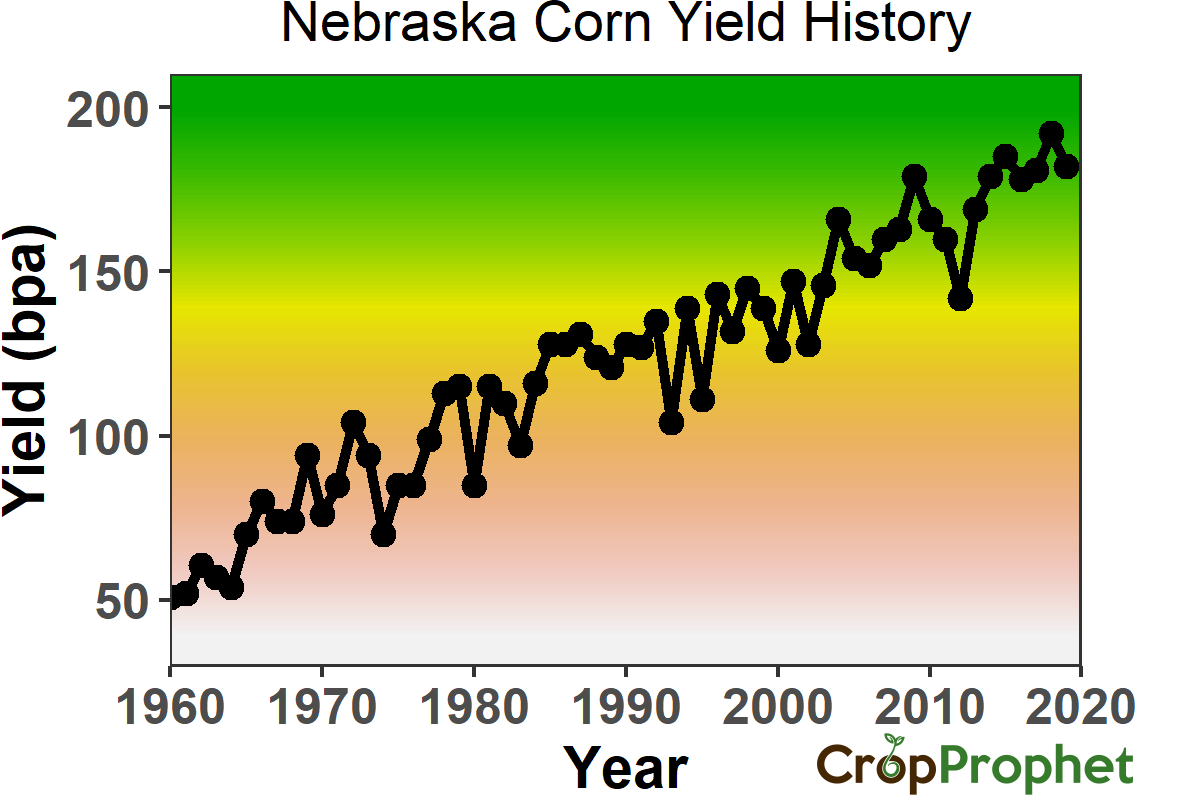
Nebraska
Nebraska’s maximum corn yield achieved is 192 bu/a which occurred in 2018
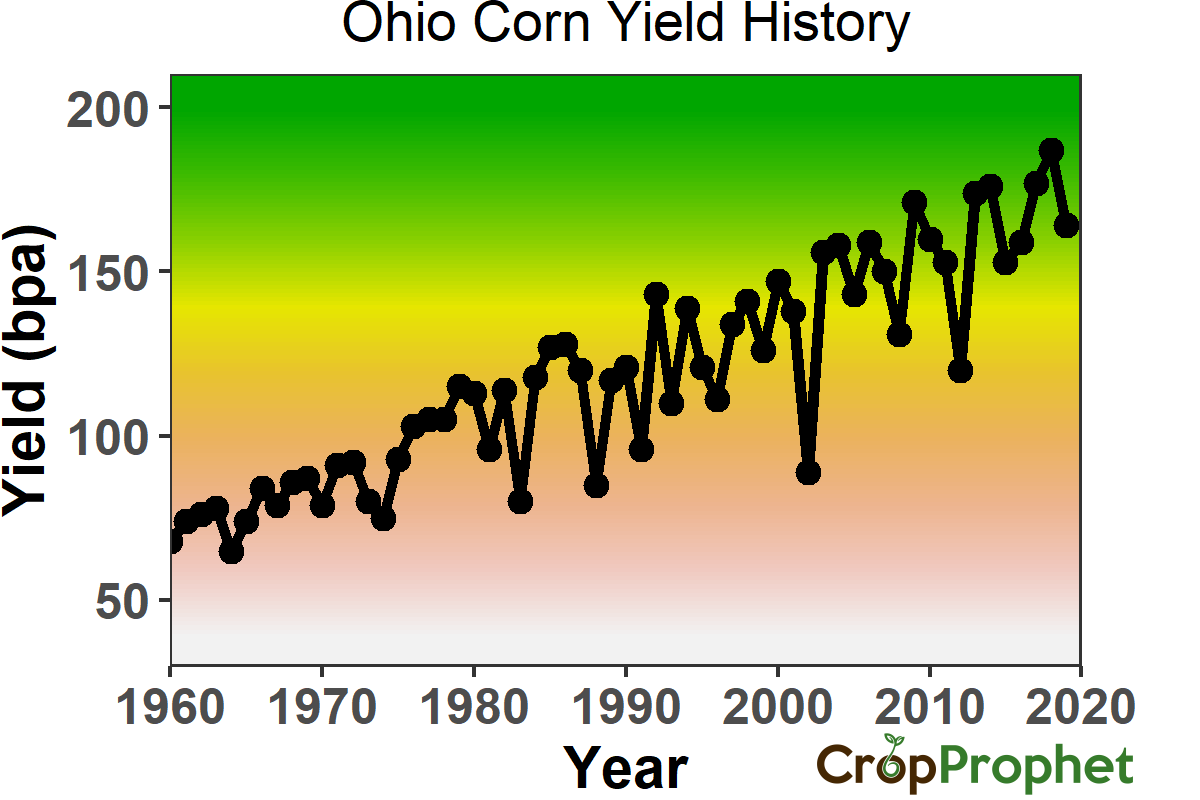
Ohio
Ohio’s maximum corn yield achieved is 187 bu/a which occurred in 2018
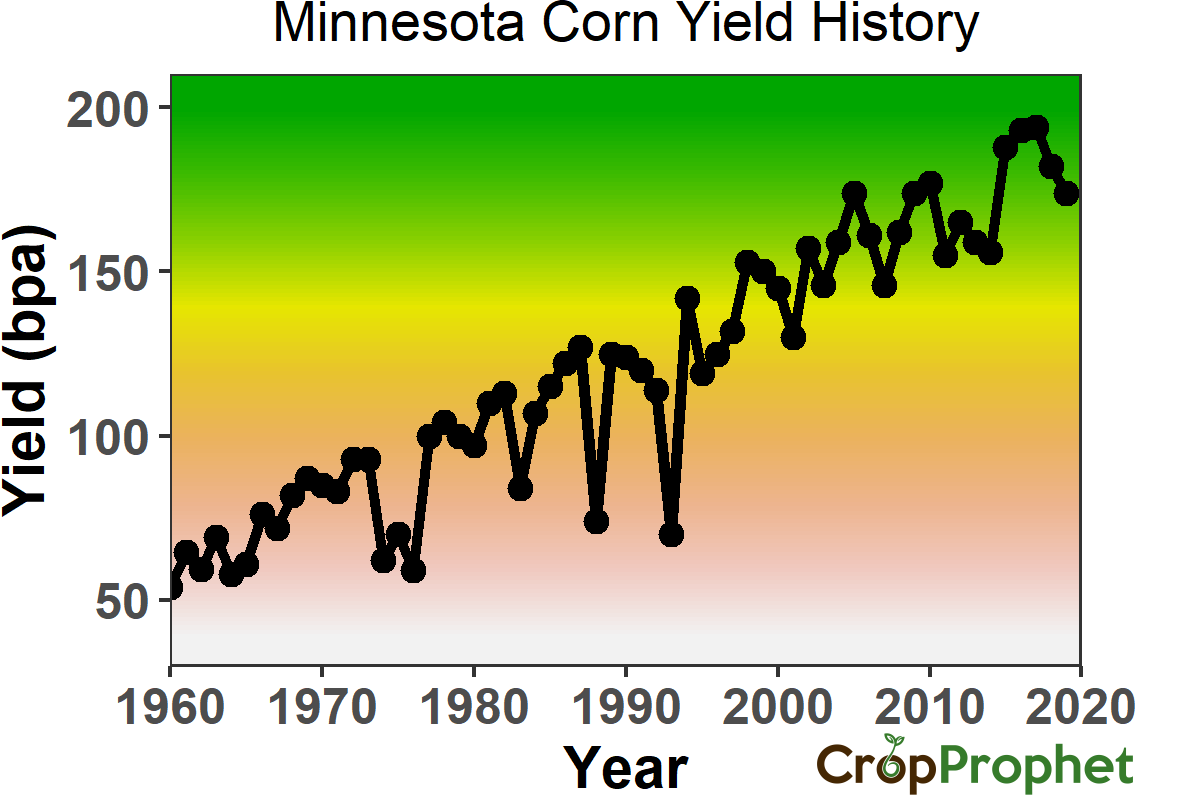
Minnesota
Minnesota’s maximum corn yield achieved is 194 bu/a which occurred in 2017