Satellite Crop Yield Monitoring with NDVI and VHI
Satellite crop monitoring is an important tool for global crop health and yield monitoring data. While CropProphet focuses on identifying and predicting the fundamental causes of changes in crop health (i.e., weather conditions during the crop season), other sources of confirming data can also be valuable. The NDVI and VHI indices, defined below, have recently been added to CropProphet as an additional source of crop monitoring data. This document describes each type of data and how it can be used.
What is the Normalized Difference Vegetation Index (NDVI)?
The Normalized Difference Vegetation Index (NDVI) is a numerical indicator that quantifies the health and density of vegetation. NDVI values range from -1.0 to +1.0 with areas of rock, sand, or snow showing very low NDVI values (0.1 or less). On the other hand, high NDVI values of approximately 0.6 to 0.9 relate to dense vegetation or crops at their peak growth stage.
NDVI relies on satellite imagery to calculate the difference between the amount of red and near-infrared light reflected by plants. Healthy plants absorb most of the red light for photosynthesis and reflect a significant portion of near-infrared light.
The NDVI Equation
NDVI is calculated using the equation:
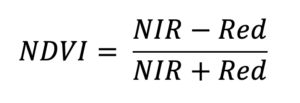
In this equation, NIR represents near-infrared reflectance, which is high for healthy vegetation, while Red corresponds to red light reflectance, which is low for vegetation during photosynthesis.
NDVI Applications
NDVI is a diverse tool that has several uses within agriculture as shown in Table 1.

While NDVI data has several uses, it is included in CropProphet to aid users’ weather-based crop yield and production monitoring.
Correlations of NDVI to Crop Health and Yield
NDVI has a significant correlation with crop health and yield. NDVI is correlated to crop health through:
- Vegetation Vigor: Higher NDVI values (0.6-0.9) generally indicate healthy and vigorous plants with abundant chlorophyll.
- Drought Stress: Crops under drought stress or nutrient deficiencies tend to have lower chlorophyll content, leading to lower NDVI values. Monitoring NDVI over time allows for early detection of these stress conditions.
- Pest and Disease Protection: Decreases in NDVI can signal pest infestations or disease outbreaks in crops. These can lead to reduced vegetation density or chlorosis, both of which reduce NDVI values.
Additionally, NDVI also has a strong correlation to crop yield through:
- Yield Estimation: While not used in CropProphet yield models, NDVI is used by others to predict crops by correlating NDVI values with historical yield data.
- Growth Stages: NDVI values at certain growth stages (e.g. during peak growing periods) are particularly predictive of final yield. For instance, NDVI during the reproductive stage of crops like corn and wheat is a good indicator of potential yield.
- Temporal NDVI Trends: Tracking NDVI over the growing season helps in assessing how crops are developing. Consistently high NDVI values over time suggest favorable conditions for high yields, while declining NDVI might indicate stress or poor growth conditions, leading to reduced yields.
- Spatial Variability: NDVI can identify areas within a field with higher or lower yield potential, enabling precision agriculture practices.
NDVI Limitations
Even though NDVI is a widely used and valuable tool for monitoring vegetation health, it has several limitations, including:
- Saturation in Dense Vegetation: NDVI values can reach a saturation point in areas with very diverse vegetation, making it difficult to distinguish between high levels of vegetation health or biomass. This can lead to an underestimate of vegetation health in densely vegetated areas, reducing the accuracy of monitoring during peak growing seasons.
- Soil Background Effects: The index can be influenced by the reflectance of the underlying soil, especially in areas with sparse vegetation. During the early stages of crop growth, when the green leaf is small, the NDVI results are very sensitive to soil background effects, leading to misinterpretations of vegetation health.
- Atmospheric Interference: Variations in atmospheric conditions, such as clouds, haze, and aerosols, can alter the reflectance values captured by satellites, affecting NDVI measurements. In turn, this introduces noise into the NDVI data, making it a challenge to compare values across different time periods or under different atmospheric conditions.
- Crop Phenology Timing: Due to different weather conditions each year, the planting progress and rates of crop development can vary by several weeks. This accelerates or delays the annual greening cycle, which can make it challenging to interpret whether above or below average values of NDVI are due to changes in vegetative health or simply caused by major shifts in the timing of the crop’s phenological cycle. Methodologies for mitigating this issue can become quite complex, as they require field-level information such as the crop type, planting date, and estimates of the phenological stage. Much of that information has to be modeled, which leads to additional sources of error and uncertainty.
NDVI Crop Monitoring in CropProphet
Within CropProphet (CP), a client can now view NDVI anomalies for the latest 8 days (Figure 1), the prior 8-day period, latest 30 days, latest 60 days, latest 90 days, and latest 180 days.
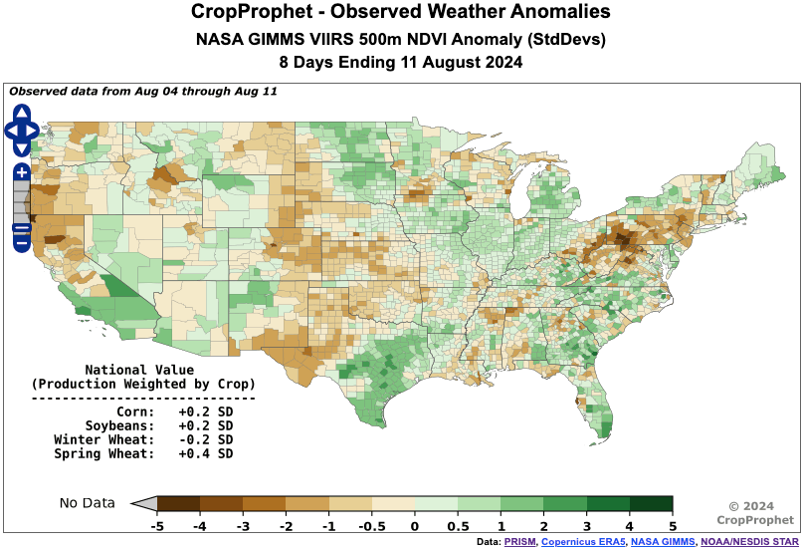
Green colors correspond to neutral to positive standard deviations, while brown colors correspond to neutral to negative standard deviations. The NDVI crop production-weighted statistic, placed in the bottom left of each graphic, is determined by summing the product of each county’s percentage of national crop production (e.g., corn, soybeans) and that county’s NDVI anomaly. This statistic enables the client to assess crop health at a national scale and improve yield forecasting by incorporating the crop production weight. For example, in Figure 1, the corn production-weighted NDVI over the last two updates has shown a positive standard deviation.

What is the Vegetation Health Index?
The Vegetation Health Index or VHI is an advanced remote sensing index combining various indicators to provide a more comprehensive assessment of vegetation conditions, especially regarding stress factors such as drought or wetness. The VHI incorporates the Vegetation Condition Index (VCI) and the Temperature Condition Index (TCI) to account for the effects of both vegetation vigor and temperature stress on crops. While NDVI is a valuable tool for assessing vegetation health, VHI includes a more holistic approach by incorporating temperature data. This makes the VHI a more effective indicator of drought and overall plant stress. VHI is calculated by the following equation:
Alpha, α, is a weighting factor that determines the relative influence of VCI and TCI on the VHI. Normally, α is set to 0.5 to give equal weight to both VCI and TCI, but it can be adjusted based on specific applications or environmental conditions. VHI typically ranges from 0 to 100 with lower values (close to 0) indicating poor vegetation health or stress, and higher values (close to 100) representing healthy vegetation.
Uses of VHI
VHI is a powerful tool for monitoring and assessing plant health and stress conditions. The primary application of this index includes drought monitoring, early warning systems, disaster management, food security, and climate change studies.
- Drought Monitoring: VHI is very effective in tracking drought conditions and their impact on vegetation. By combining vegetation condition and temperature data, this index provides a more accurate representation of plant stress compared to NDVI.
- Early Warning Systems: VHI can be used to develop early warning systems for agricultural droughts, allowing farmers and policymakers to take proactive measures to mitigate potential crop losses.
- Disaster Management: VHI data can be used to assess the severity of drought-related disasters and to support disaster response and recovery efforts.
- Food Security: By monitoring crop conditions and potential yield losses, VHI contributes to food security assessments.
- Climate Change Studies: VHI can be used to analyze long-term vegetation trends and their relationship to climate change.
Correlations of VHI to Crop Health and Yield
VHI is correlated to both crop health and yield due to its ability to integrate factors that influence vegetation, particularly through VCI and TCI. VHI is correlated to crop health through:
- Vegetation Condition Index (VCI): VCI is a component of VHI that measures how current vegetation greenness compares to historical normality. Healthy crops exhibit higher VCI values because they have more chlorophyll, whereas lower VCI values may indicate stress due to factors of drought, pests, or disease. Since VHI incorporates VCI, it directly reflects the relative health of crops by considering their greenness and vigor over time.
- Temperature Condition Index (TCI): TCI accounts for temperature-related stress, which significantly impacts crop health. High temperatures can cause heat stress while low temperatures can lead to frost damage. With incorporating the TCI, it provides a more comprehensive view of crop health by accounting for temperature extremes that could stress crops even if their greenness appears normal.
In addition, VHI is also correlated to crop yield through:
- Predicting Yield Based on VHI: VHI can be used throughout a growing season to monitor crop conditions. High VHI values (60-100) generally correlate with healthy crops that are likely to produce higher yields, while low VHI values (40 and below) can indicate stressed crops that may produce less yield. VHI is particularly useful for forecasting yields because it captures both the greenness and the temperature stress that crops experience. Both of these factors make VHI a better predictor of final crop yields than NDVI alone, which might not fully capture the effects of temperature stress.
- Historical Yield Correlations: Numerous studies have shown a strong correlation between VHI and actual crop yields. For example, in drought-prone regions, a drop in VHI often precedes lower yields. This is because the index incorporates VCI and TCI.
VHI Limitations
VHI is a very useful tool for assessing vegetation health and drought conditions, but it does have some limitations:
- Data Availability: The accuracy of VHI relies on the availability of high-quality vegetation greenness data and temperature data, which can be limited in some regions or time periods.
- Sensor Sensitivity: The sensitivity of satellite sensors to different vegetation types and atmospheric conditions can affect VHI accuracy. NDVI, a core component of VHI, can be significantly affected by cloud cover, atmospheric particles, and aerosols, which can distort the reflected light used in the calculations. This can lead to unreliable VHI readings, particularly in regions with frequent cloud cover or significant atmospheric pollution.
- Other Factors: VHI primarily focuses on drought and temperature stress, and it may not completely capture the impact of other factors affecting crop health, including pests, diseases, or nutrient deficiencies.
Usage of VHI in CropProphet:
The Vegetation Health Index (VHI) product in CropProphet is derived from data provided by NOAA’s National Environmental Satellite, Data, and Information Service (NESDIS). This index utilizes a no-noise version of the Normalized Difference Vegetation Index (NDVI), which is calculated using the most recent 7 weeks of NDVI composites. Although using a larger number of composites results in more stable estimates of vegetative health, it also introduces a lag. Consequently, for identifying emerging issues or rapid changes in crop health, CropProphet users should use the NDVI product. This NDVI product is based on 8-day composites from NASA GIMMS and is independent of the data used in the VHI product. The VHI product is more suitable when an accurate assessment of vegetative health over the past month or two is required. It is crucial to understand that the NDVI and VHI products in CropProphet come from independent data sources and serve distinct purposes, leading to contrasting estimates of vegetative health.
Grain traders can use VHI data to make informed decisions about weather’s impact on grain yields in a wide range of conditions. In CropProphet (CP), clients can use the observed VHI ranging from 0-100 for the latest 7 days, prior 7 days, latest 30 days, latest 60 days, latest 90 days, and latest 180 days. Green to blue colors represent average to healthy vegetation while yellow to pink shows average to poor vegetation. For example, in the latest 7-day graphic (Figure 2), Arkansas, Missouri, and Illinois among other states show relatively healthy vegetation growth over the past week.
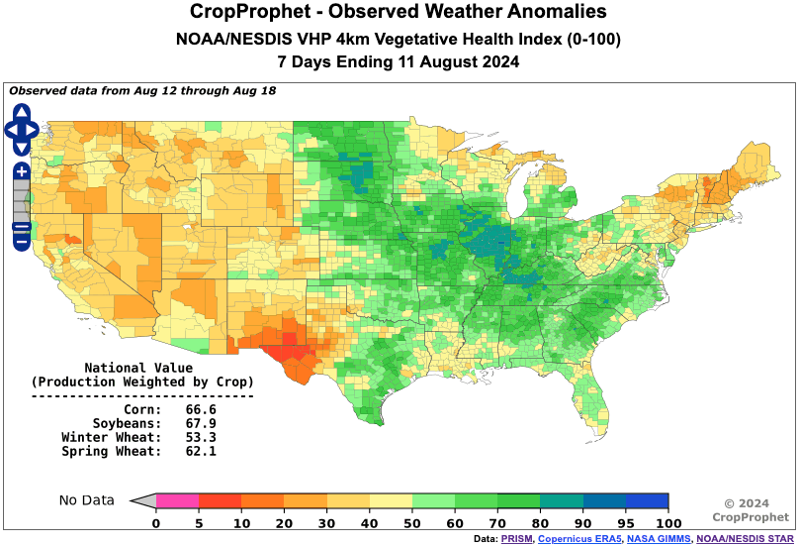
In the lower-left corner of each graphic, the crop production weighted VHI statistic is highlighted. The crop production weighted VHI statistic is calculated by summing the product of the percentage of crops (corn, soybeans, etc.) growing in each county and the VHI for each county. This statistic allows a client to make informed decisions and manage risks on weather-impacted crops.
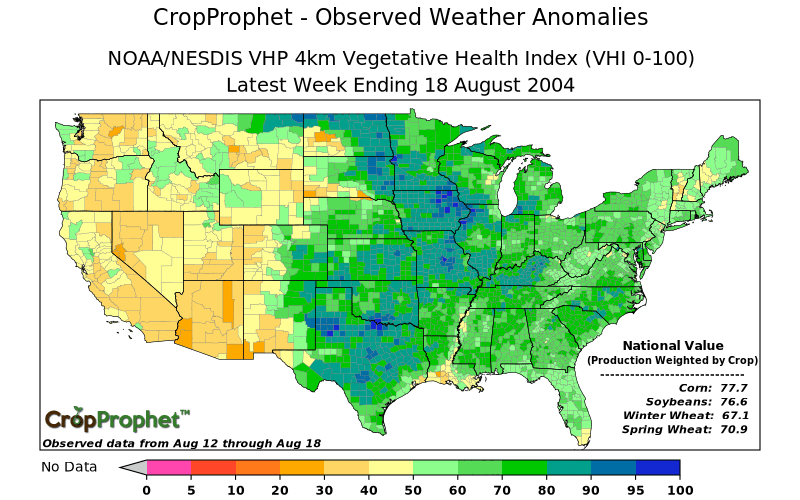
Figure 3 illustrates the CropProphet VHI graphic for the latest week ending on August 18th, 2004. This graphic depicts the VHI values from August 12th to August 18th, 2004, showing notably high VHI values across most grain-growing regions. The record yields observed in 2004 are reflected in CropProphet’s VHI graphic. Clients using VHI graphics on CropProphet, as seen in figures 1-3, find these tools invaluable for identifying extremes in vegetative health.
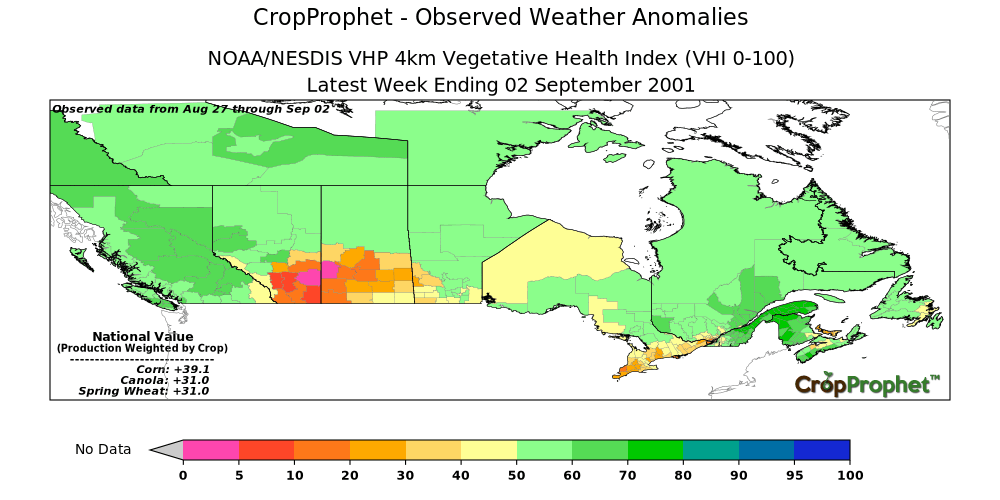
Canada can also be analyzed using VHI in CropProphet. Figure 4 highlights the significant low VHI values in southern Alberta which is where most crops are grown in Canada.
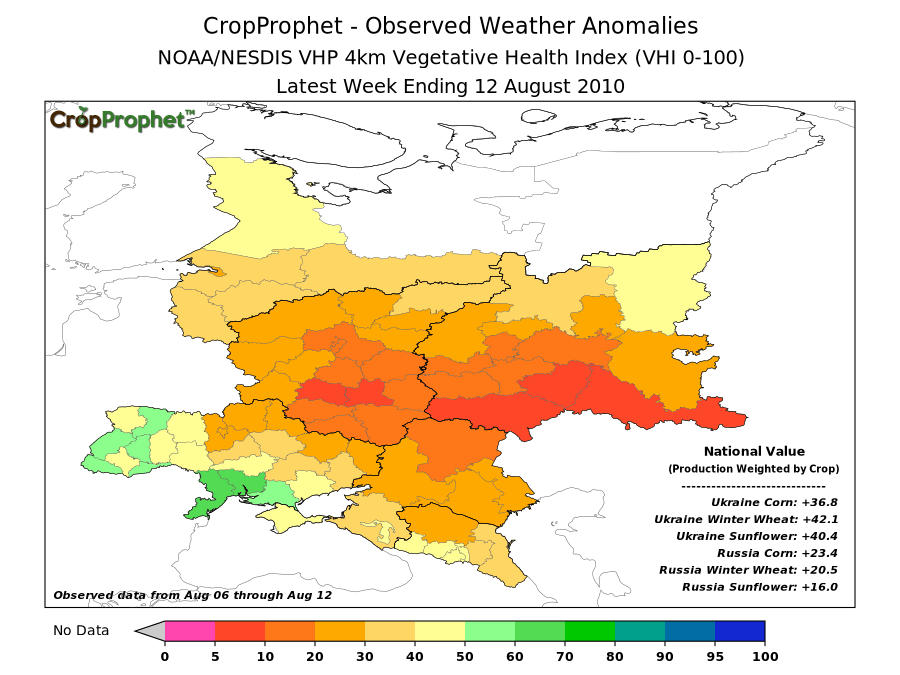
Clients can also use the VHI to monitor vegetation health in the Black Sea region, as illustrated in Figure 5. In this graphic, VHI values were notably low in northern and eastern Ukraine and across much of Russia.
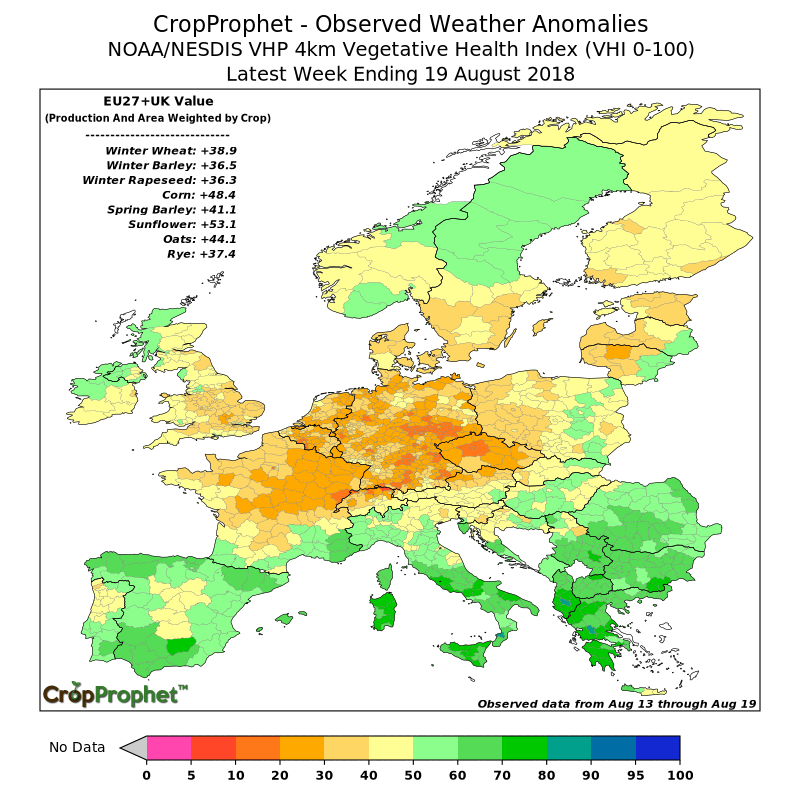
Lastly, Figure 6 shows the substantially low VHI values in central Europe. All European winter crop production weighted VHI show very low VHI values, signifying poor vegetation health.
Conclusion: NDVI & VHI are Complementary to Crop Yield Modeling
NDVI and VHI maps and crop production-weighted statistics have been added to CropProphet. These two sources of additional information expands the means by which our grain trading customers can track weather and its impact on crop yield and production.
NDVI and VHI Data Sources
The NDVI and VHI graphics use data from NASA GIMMS, and NOAA/NESDIS STAR.
Links to dataset descriptions:
NOAA/NESDIS STAR:
https://www.star.nesdis.noaa.gov/smcd/emb/vci/VH/index.php
Links to the datasets:
NOAA/NESDIS STAR:
https://www.star.nesdis.noaa.gov/data/pub0018/VHPdata4users/data/Blended_VH_4km/geo_TIFF/