Crop Insurance and Reinsurance: Measure Risk with Crop Forecasts
Weather-driven to Model Risk
CropProphet is a sophisticated weather-driven yield and production forecasting system for corn, soybeans, and winter wheat in the United States. While some yield forecast systems focus on using NDVI data as a primary input, CropProphet models crop yields and production based on daily weather information during the growing season. We can provide 34 years of daily county-level crop yield/production forecasts to enable improved modeling of MPCI portfolio risks.
During the crop season, our forecasts update daily as the weather evolves. This allows crop insurance and reinsurance providers to monitor the in-season financial risk held in portfolios of crop insurance contracts. CropProphet is the only crop yield forecast product that can estimate the yield impact implied by weather forecast models such as NOAA’s GEFS and the European Centre for Medium-Range Weather Forecasting ensemble model.
Crop Insurance: Monitor Crop Yield Risks
CropProphet enables users to quantify the impact of weather crop yield and production of three primary crops at the county level. Factors such as excess precipitation, drought, and extreme temperatures are all accounted for in the model. Our county-level forecasts that are rolled up to produce an accurate national level crop yield forecast. CropProphet is not a weather forecast solution. It is a crop yield and production forecast solution based on weather conditions and forecasts.
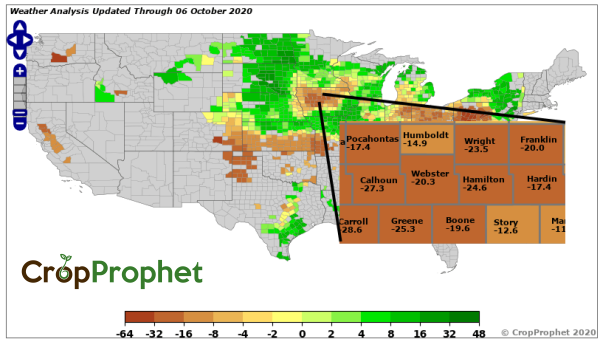
Example Deviation From Trend Forecast
The CropProphet system is available as a web-based service with access to digital forms of the daily updated forecast and historical data via FTP.
Consider the following product characteristics. CropProphet:
- Monitors and forecasts yield and production development during the crop season at the county level. It allows crop insurance industry users to pinpoint the locations of the MPCI policies written with the detailed analytics provided by CropProphet to understand if mid-season risks are materializing.
- Makes attractive maps – communication mid-season regarding any risks that may be materializing is easier to discuss with a map-based analysis. Current customers keep their executive team informed of developing risks with these maps.
- Valuable risk analytics – analytics such as the yield and production deviation from the prior year, deviation from trend, and 5% and 95% percentile yield analyses allow crop insurance companies to deeply analyze risks in the portfolio.
- Enables FTP access to a wide range of data – automated data acquisition saves time and enables improved analysis and application development. We even reformat and provide NASS data, making it easy to access.
Crop Insurance: Quantify your Risk with Modeler
CropProphet uses data mining to compare weather conditions to annual yields at the county, state, and national levels. We provide extensive historical model forecast performance information. An example of 34 years of national corn deviation from the technology trend is shown below and available in CropProphet Modeler.
CropProphet data is available to trial with no risk. Request more information today!