One Minute Summary
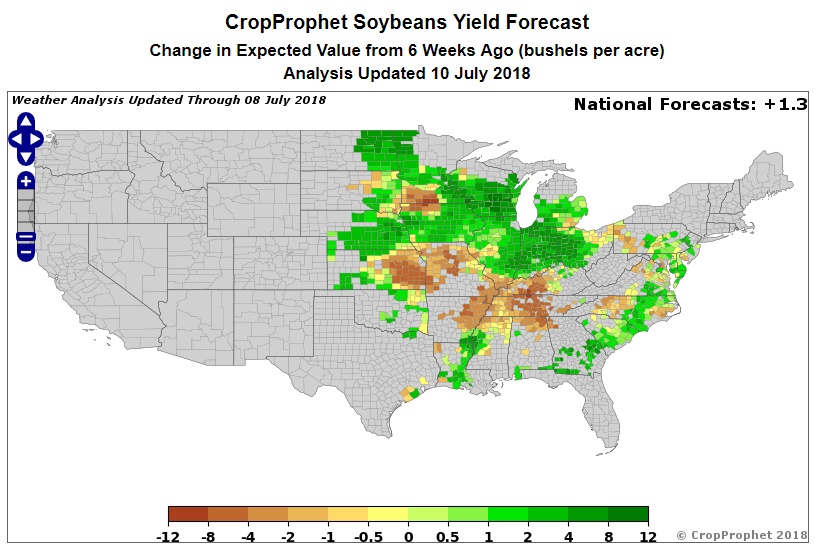
- The CropProphet Soybean yield forecast has been trending upward all season. The national yield forecast has increased 1.3 bu/a over the past 6 weeks.
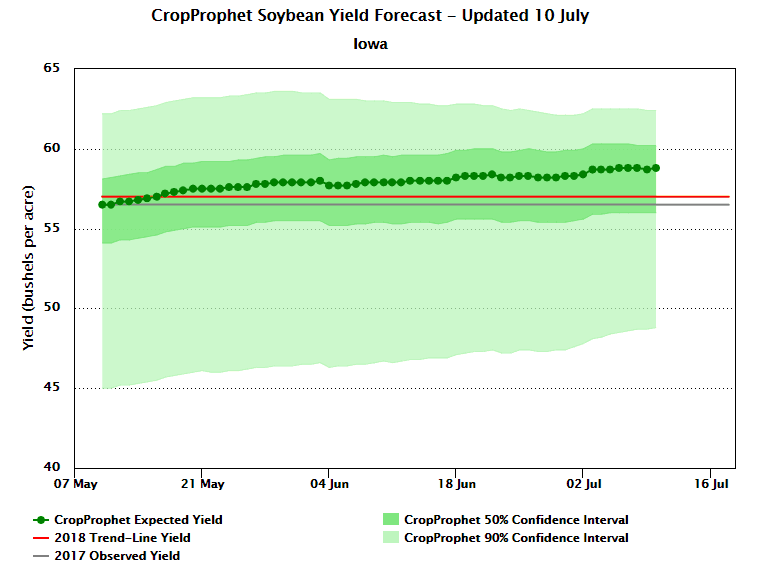
- The Iowa trend graphic looks very similar to the national yield forecast trend. The national yield forecast trend can be accessed via a trial or your subscription to CropProphet.
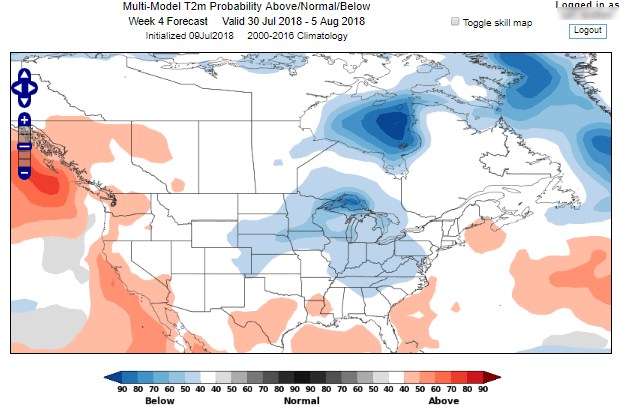
- The World Climate Service long lead forecast indicates increased probabilities of below normal temperatures for the end of July.
US Soybean Yield Forecasts Are Trending Up
Crop conditions for Soybeans have been generally favorable across much of the key growing seasons since the start of June. The map below shows the 6 week change in the CropProphet yield forecast at the county level. Overall the national impact on Soybean yields has been an improvement of 1.3 bu/a over the past 6 weeks.
The graph below, taken from CropProphet, is the daily updated soybean yield forecast for Iowa. A general upward trend is evident since the start of the season. The same chart for the US national soybean yield forecast has the same general upward trend suggesting general beneficial growing conditions for Soybean since the start of the season. The US National Soybean yield forecast can be viewed in CropProphet via a product trial or subscription. Request a trial today.
The weather outlook over the next two week continues to favor soybean growth, with the CropProphet forecast showing an increase of +0.3 bpa. It’s not often that we see every soybean growing state showing an increase in expected end-of-season yield, and if the weather proves to be nearly ideal then the CropProphet soybean outlook could see substantial improvement.
Long Lead Agriculture Weather Forecast
Our companion product, The World Climate Service, provides seasonal climate (i.e. 1 – 3 months ahead) and subseasonal climate (i.e. 3-6 weeks ahead) forecasts. In fact, the US Government sponsored Prescient Weather to conduct subseasonal climate predictability research in the space. The July 9, 2018 forecast for “week 4”, meaning for the period July 30th to August 5th, 2018 shows greater than normal probabilities of below normal temperatures (long lead forecasts of weather and climate conditions should be interpreted using probabilities, not anomalies). So, chances are there is going to be spell of colder than normal weather in the grain belt towards the end of July.
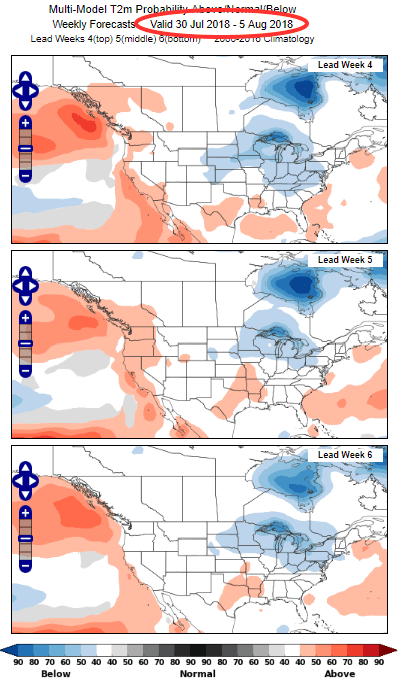
Long lead probabilistic subseasonal and seasonal forecasts require careful use. One signal meteorologists like to see to gain confidence in a forecast is consistency in the “model-to-model” changes. This means that if the forecasts for the same time period from several different forecast lead times are similar, the model is consistently forecasting the same signal. This is what is seen below. The image below provides the week 4, week 5 and week 6 lead forecast for the same 30 July, 2018 to August 5, 2018 time period.
The probabilities for the upper midwest show a consistient increase in probabilities of below normal temperatures (the blue blobs). Consider carefully before betting on heat in the midwestern United States in late July.
Avoid the Hype. Get the Facts. Use CropProphet for your Grains Market Intelligence.


