Table of Contents
| 2000-2004 | 2005-2009 | 2010-2014 | 2015-2019 | 2020-2022 |
|---|---|---|---|---|
Where are Oats Grown in the United States
Oats are mostly grown across in northern US states, with production dominated by North and South Dakota. For a deeper look at how weather impacts yields north of the border, see this case study on the Canadian oats market.
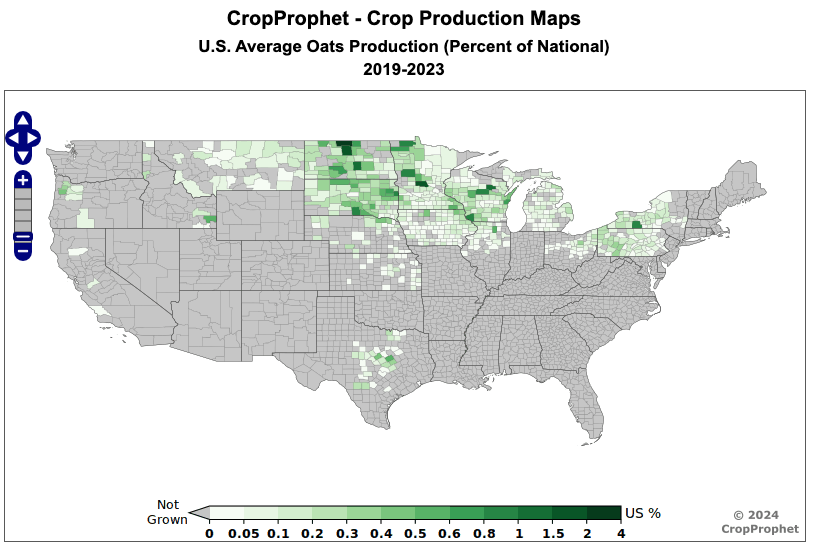
Check here to see where oats are grown in Canada.

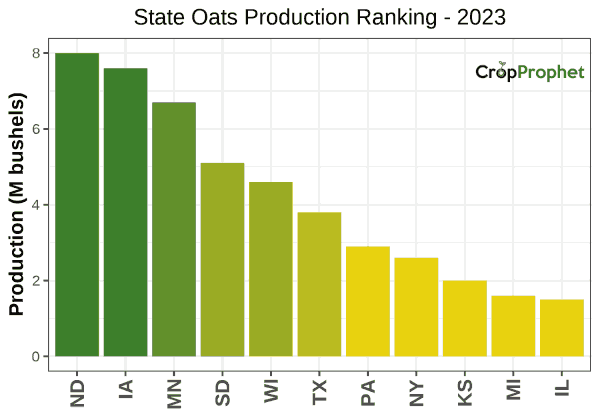
Oats Production by State: Top 11 of 2023
The top 11 oats-producing states (and their total production) of 2023 was:
| Production Rankings: 2023 | ||
| Rank | State | Production (M bu) |
|---|---|---|
| 1 | ND | 8.0 |
| 2 | IA | 7.6 |
| 3 | MN | 6.7 |
| 4 | SD | 5.1 |
| 5 | WI | 4.6 |
| 6 | TX | 3.8 |
| 7 | PA | 2.9 |
| 8 | NY | 2.6 |
| 9 | KS | 2.0 |
| 10 | MI | 1.6 |
| 11 | IL | 1.5 |
State Oats Production – 2023
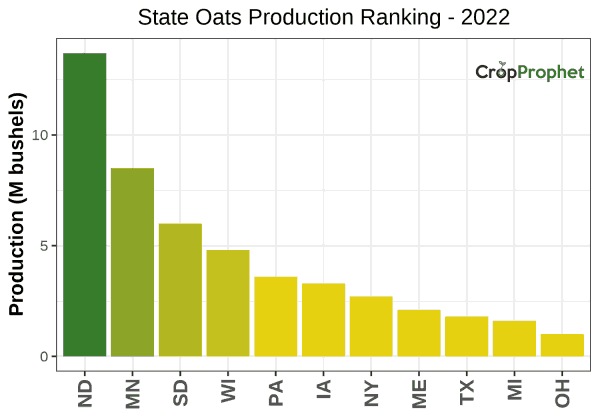
Oats Production by State: Top 11 of 2022
The top 11 oats-producing states (and their total production) of 2022 was:
| Production Rankings: 2022 | ||
| Rank | State | Production (M bu) |
|---|---|---|
| 1 | ND | 13.7 |
| 2 | MN | 8.5 |
| 3 | SD | 6.0 |
| 4 | WI | 4.8 |
| 5 | PA | 3.6 |
| 6 | IA | 3.3 |
| 7 | NY | 2.7 |
| 8 | ME | 2.1 |
| 9 | TX | 1.8 |
| 10 | MI | 1.6 |
| 11 | OH | 1.0 |
State Oats Production – 2022
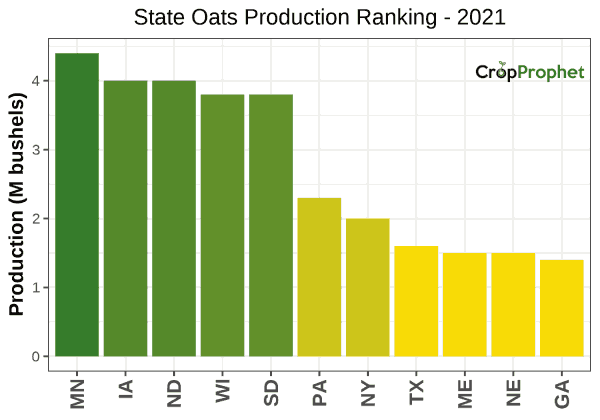
Oats Production by State: Top 11 of 2021
The top 11 oats-producing states (and their total production) of 2021 was:
| Production Rankings: 2021 | ||
| Rank | State | Production (M bu) |
|---|---|---|
| 1 | MN | 4.4 |
| 2 | IA | 4.0 |
| 3 | ND | 4.0 |
| 4 | WI | 3.8 |
| 5 | SD | 3.8 |
| 6 | PA | 2.3 |
| 7 | NY | 2.0 |
| 8 | TX | 1.6 |
| 9 | ME | 1.5 |
| 10 | NE | 1.5 |
| 11 | GA | 1.4 |
State Oats Production – 2021
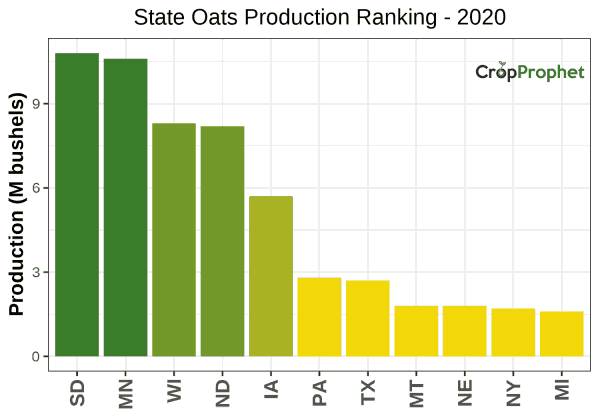
Oats Production by State: Top 11 of 2020
The top 11 oats-producing states (and their total production) of 2020 was:
| Production Rankings: 2020 | ||
| Rank | State | Production (M bu) |
|---|---|---|
| 1 | SD | 10.8 |
| 2 | MN | 10.6 |
| 3 | WI | 8.3 |
| 4 | ND | 8.2 |
| 5 | IA | 5.7 |
| 6 | PA | 2.8 |
| 7 | TX | 2.7 |
| 8 | MT | 1.8 |
| 9 | NE | 1.8 |
| 10 | NY | 1.7 |
| 11 | MI | 1.6 |
State Oats Production – 2020
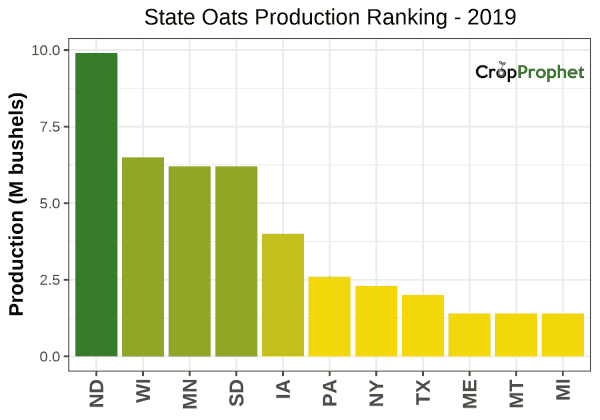
Oats Production by State: Top 11 of 2019
The top 11 oats-producing states (and their total production) of 2019 was:
| Production Rankings: 2019 | ||
| Rank | State | Production (M bu) |
|---|---|---|
| 1 | ND | 9.9 |
| 2 | WI | 6.5 |
| 3 | MN | 6.2 |
| 4 | SD | 6.2 |
| 5 | IA | 4.0 |
| 6 | PA | 2.6 |
| 7 | NY | 2.3 |
| 8 | TX | 2.0 |
| 9 | ME | 1.4 |
| 10 | MT | 1.4 |
| 11 | MI | 1.4 |
State Oats Production – 2019
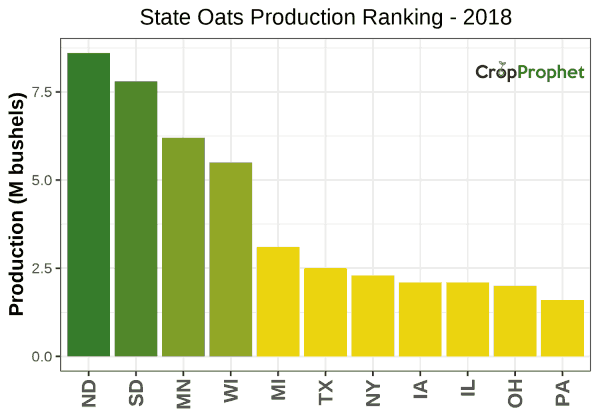
Oats Production by State: Top 11 of 2018
The top 11 oats-producing states (and their total production) of 2018 was:
| Production Rankings: 2018 | ||
| Rank | State | Production (M bu) |
|---|---|---|
| 1 | ND | 8.6 |
| 2 | SD | 7.8 |
| 3 | MN | 6.2 |
| 4 | WI | 5.5 |
| 5 | MI | 3.1 |
| 6 | TX | 2.5 |
| 7 | NY | 2.3 |
| 8 | IA | 2.1 |
| 9 | IL | 2.1 |
| 10 | OH | 2.0 |
| 11 | PA | 1.6 |
State Oats Production – 2018
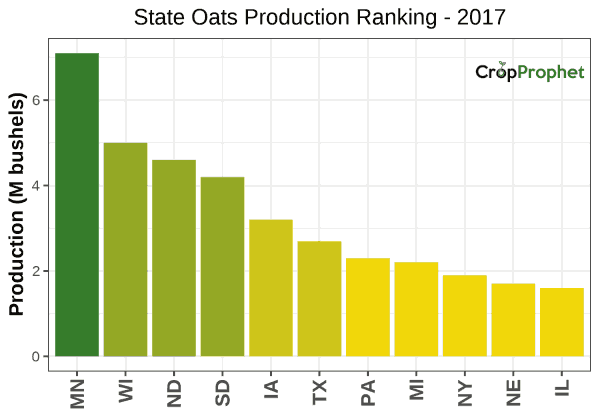
Oats Production by State: Top 11 of 2017
The top 11 oats-producing states (and their total production) of 2017 was:
| Production Rankings: 2017 | ||
| Rank | State | Production (M bu) |
|---|---|---|
| 1 | MN | 7.1 |
| 2 | WI | 5.0 |
| 3 | ND | 4.6 |
| 4 | SD | 4.2 |
| 5 | IA | 3.2 |
| 6 | TX | 2.7 |
| 7 | PA | 2.3 |
| 8 | MI | 2.2 |
| 9 | NY | 1.9 |
| 10 | NE | 1.7 |
| 11 | IL | 1.6 |
State Oats Production – 2017
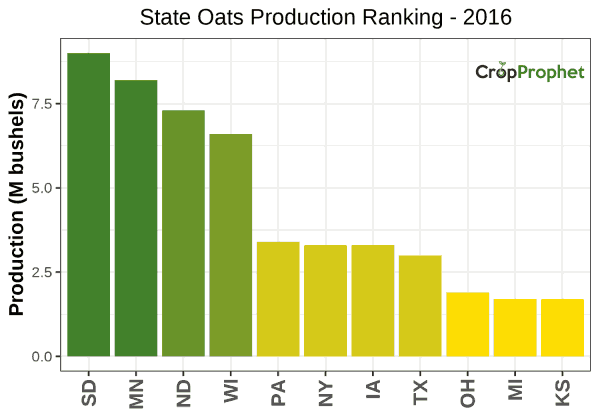
Oats Production by State: Top 11 of 2016
The top 11 oats-producing states (and their total production) of 2016 was:
| Production Rankings: 2016 | ||
| Rank | State | Production (M bu) |
|---|---|---|
| 1 | SD | 9.0 |
| 2 | MN | 8.2 |
| 3 | ND | 7.3 |
| 4 | WI | 6.6 |
| 5 | PA | 3.4 |
| 6 | NY | 3.3 |
| 7 | IA | 3.3 |
| 8 | TX | 3.0 |
| 9 | OH | 1.9 |
| 10 | MI | 1.7 |
| 11 | KS | 1.7 |
State Oats Production – 2016
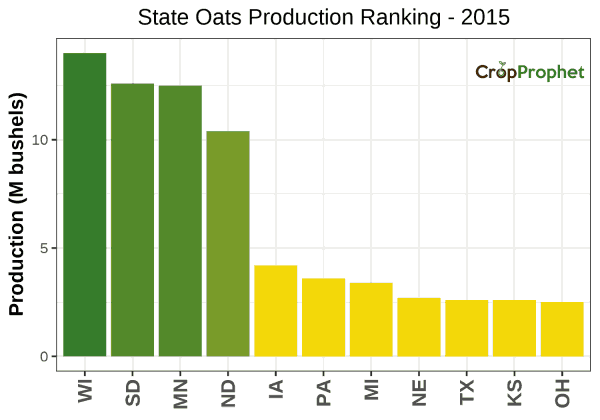
Oats Production by State: Top 11 of 2015
The top 11 oats-producing states (and their total production) of 2015 was:
| Production Rankings: 2015 | ||
| Rank | State | Production (M bu) |
|---|---|---|
| 1 | WI | 14.0 |
| 2 | SD | 12.6 |
| 3 | MN | 12.5 |
| 4 | ND | 10.4 |
| 5 | IA | 4.2 |
| 6 | PA | 3.6 |
| 7 | MI | 3.4 |
| 8 | NE | 2.7 |
| 9 | TX | 2.6 |
| 10 | KS | 2.6 |
| 11 | OH | 2.5 |
State Oats Production – 2015
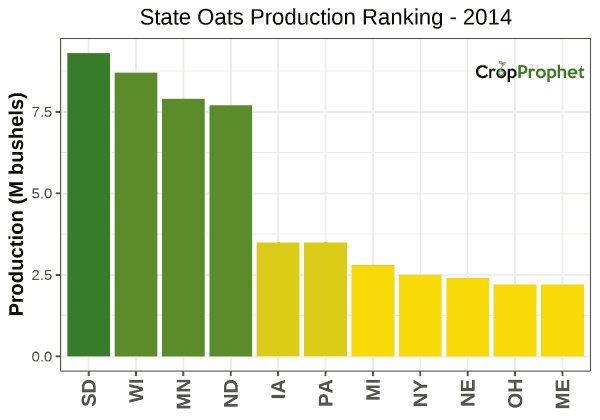
Oats Production by State: Top 11 of 2014
The top 11 oats-producing states (and their total production) of 2014 was:
| Production Rankings: 2014 | ||
| Rank | State | Production (M bu) |
|---|---|---|
| 1 | SD | 9.3 |
| 2 | WI | 8.7 |
| 3 | MN | 7.9 |
| 4 | ND | 7.7 |
| 5 | IA | 3.5 |
| 6 | PA | 3.5 |
| 7 | MI | 2.8 |
| 8 | NY | 2.5 |
| 9 | NE | 2.4 |
| 10 | OH | 2.2 |
| 11 | ME | 2.2 |
State Oats Production – 2014
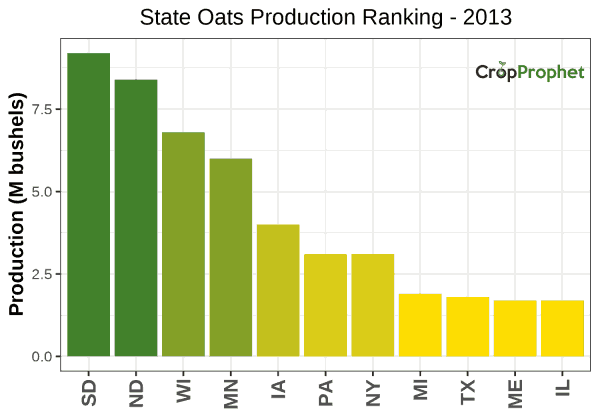
Oats Production by State: Top 11 of 2013
The top 11 oats-producing states (and their total production) of 2013 was:
| Production Rankings: 2013 | ||
| Rank | State | Production (M bu) |
|---|---|---|
| 1 | SD | 9.2 |
| 2 | ND | 8.4 |
| 3 | WI | 6.8 |
| 4 | MN | 6.0 |
| 5 | IA | 4.0 |
| 6 | PA | 3.1 |
| 7 | NY | 3.1 |
| 8 | MI | 1.9 |
| 9 | TX | 1.8 |
| 10 | ME | 1.7 |
| 11 | IL | 1.7 |
State Oats Production – 2013
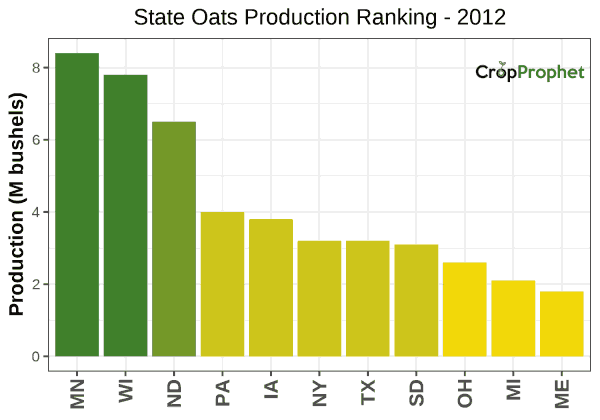
Oats Production by State: Top 11 of 2012
The top 11 oats-producing states (and their total production) of 2012 was:
| Production Rankings: 2012 | ||
| Rank | State | Production (M bu) |
|---|---|---|
| 1 | MN | 8.4 |
| 2 | WI | 7.8 |
| 3 | ND | 6.5 |
| 4 | PA | 4.0 |
| 5 | IA | 3.8 |
| 6 | NY | 3.2 |
| 7 | TX | 3.2 |
| 8 | SD | 3.1 |
| 9 | OH | 2.6 |
| 10 | MI | 2.1 |
| 11 | ME | 1.8 |
State Oats Production – 2012
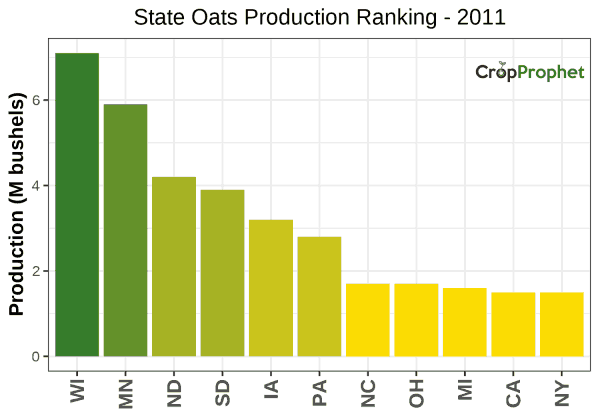
Oats Production by State: Top 11 of 2011
The top 11 oats-producing states (and their total production) of 2011 was:
| Production Rankings: 2011 | ||
| Rank | State | Production (M bu) |
|---|---|---|
| 1 | WI | 7.1 |
| 2 | MN | 5.9 |
| 3 | ND | 4.2 |
| 4 | SD | 3.9 |
| 5 | IA | 3.2 |
| 6 | PA | 2.8 |
| 7 | NC | 1.7 |
| 8 | OH | 1.7 |
| 9 | MI | 1.6 |
| 10 | CA | 1.5 |
| 10 | NY | 1.5 |
State Oats Production – 2011
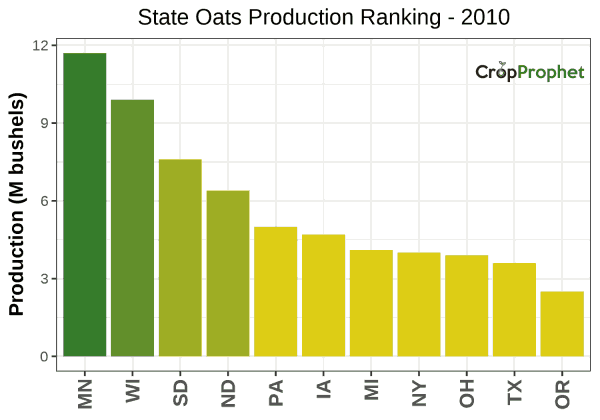
Oats Production by State: Top 11 of 2010
The top 11 oats-producing states (and their total production) of 2010 was:
| Production Rankings: 2010 | ||
| Rank | State | Production (M bu) |
|---|---|---|
| 1 | MN | 11.7 |
| 2 | WI | 9.9 |
| 3 | SD | 7.6 |
| 4 | ND | 6.4 |
| 5 | PA | 5.0 |
| 6 | IA | 4.7 |
| 7 | MI | 4.1 |
| 8 | NY | 4.0 |
| 9 | OH | 3.9 |
| 10 | TX | 3.6 |
| 11 | OR | 2.5 |
State Oats Production – 2010
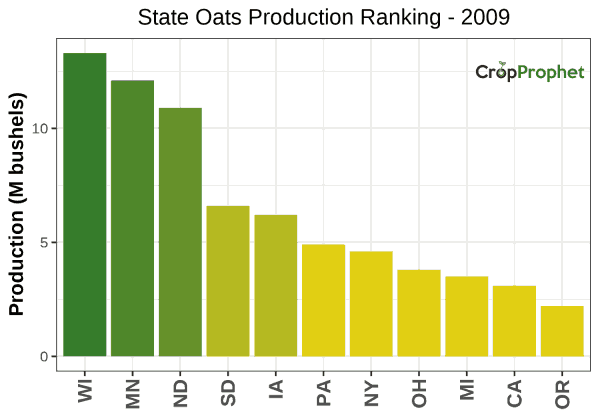
Oats Production by State: Top 11 of 2009
The top 11 oats-producing states (and their total production) of 2009 was:
| Production Rankings: 2009 | ||
| Rank | State | Production (M bu) |
|---|---|---|
| 1 | WI | 13.3 |
| 2 | MN | 12.1 |
| 3 | ND | 10.9 |
| 4 | SD | 6.6 |
| 5 | IA | 6.2 |
| 6 | PA | 4.9 |
| 7 | NY | 4.6 |
| 8 | OH | 3.8 |
| 9 | MI | 3.5 |
| 10 | CA | 3.1 |
| 11 | OR | 2.2 |
State Oats Production – 2009
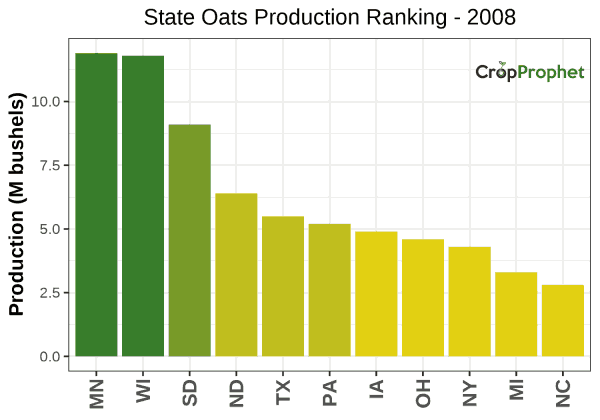
Oats Production by State: Top 11 of 2008
The top 11 oats-producing states (and their total production) of 2008 was:
| Production Rankings: 2008 | ||
| Rank | State | Production (M bu) |
|---|---|---|
| 1 | MN | 11.9 |
| 2 | WI | 11.8 |
| 3 | SD | 9.1 |
| 4 | ND | 6.4 |
| 5 | TX | 5.5 |
| 6 | PA | 5.2 |
| 7 | IA | 4.9 |
| 8 | OH | 4.6 |
| 9 | NY | 4.3 |
| 10 | MI | 3.3 |
| 11 | NC | 2.8 |
State Oats Production – 2008
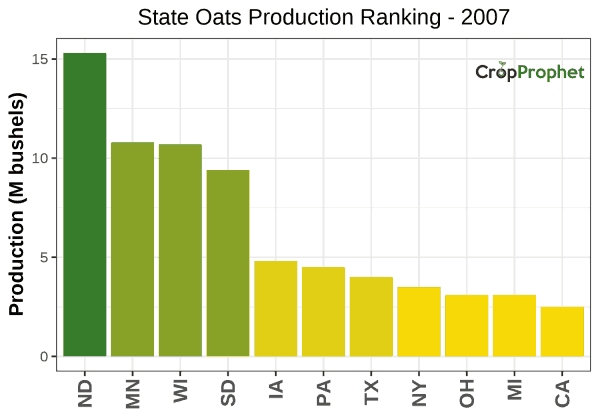
Oats Production by State: Top 11 of 2007
The top 11 oats-producing states (and their total production) of 2007 was:
| Production Rankings: 2007 | ||
| Rank | State | Production (M bu) |
|---|---|---|
| 1 | ND | 15.3 |
| 2 | MN | 10.8 |
| 3 | WI | 10.7 |
| 4 | SD | 9.4 |
| 5 | IA | 4.8 |
| 6 | PA | 4.5 |
| 7 | TX | 4.0 |
| 8 | NY | 3.5 |
| 9 | OH | 3.1 |
| 10 | MI | 3.1 |
| 11 | CA | 2.5 |
State Oats Production – 2007
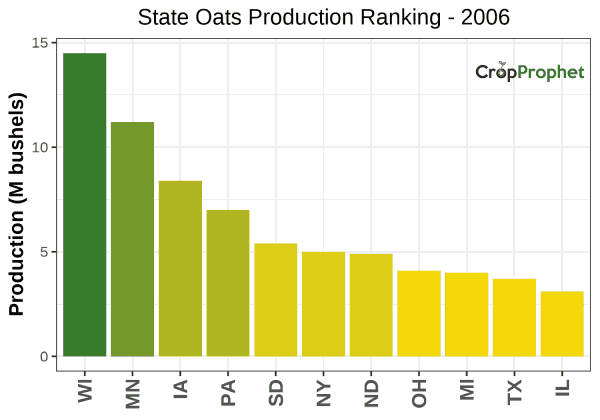
Oats Production by State: Top 11 of 2006
The top 11 oats-producing states (and their total production) of 2006 was:
| Production Rankings: 2006 | ||
| Rank | State | Production (M bu) |
|---|---|---|
| 1 | WI | 14.5 |
| 2 | MN | 11.2 |
| 3 | IA | 8.4 |
| 4 | PA | 7.0 |
| 5 | SD | 5.4 |
| 6 | NY | 5.0 |
| 7 | ND | 4.9 |
| 8 | OH | 4.1 |
| 9 | MI | 4.0 |
| 10 | TX | 3.7 |
| 11 | IL | 3.1 |
State Oats Production – 2006
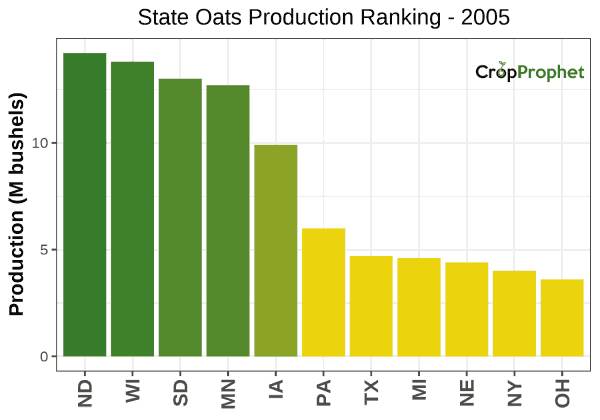
Oats Production by State: Top 11 of 2005
The top 11 oats-producing states (and their total production) of 2005 was:
| Production Rankings: 2005 | ||
| Rank | State | Production (M bu) |
|---|---|---|
| 1 | ND | 14.2 |
| 2 | WI | 13.8 |
| 3 | SD | 13.0 |
| 4 | MN | 12.7 |
| 5 | IA | 9.9 |
| 6 | PA | 6.0 |
| 7 | TX | 4.7 |
| 8 | MI | 4.6 |
| 9 | NE | 4.4 |
| 10 | NY | 4.0 |
| 11 | OH | 3.6 |
State Oats Production – 2005
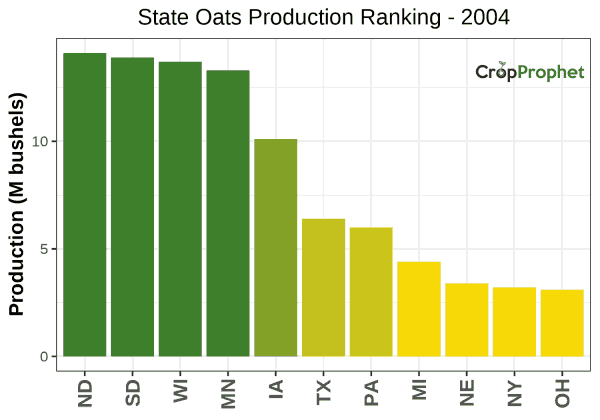
Oats Production by State: Top 11 of 2004
The top 11 oats-producing states (and their total production) of 2004 was:
| Production Rankings: 2004 | ||
| Rank | State | Production (M bu) |
|---|---|---|
| 1 | ND | 14.1 |
| 2 | SD | 13.9 |
| 3 | WI | 13.7 |
| 4 | MN | 13.3 |
| 5 | IA | 10.1 |
| 6 | TX | 6.4 |
| 7 | PA | 6.0 |
| 8 | MI | 4.4 |
| 9 | NE | 3.4 |
| 10 | NY | 3.2 |
| 11 | OH | 3.1 |
State Oats Production – 2004
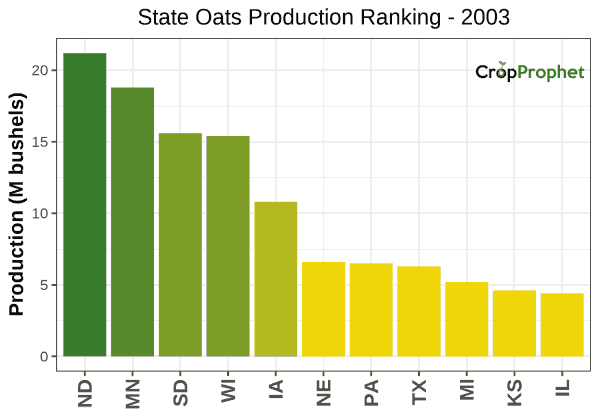
Oats Production by State: Top 11 of 2003
The top 11 oats-producing states (and their total production) of 2003 was:
| Production Rankings: 2003 | ||
| Rank | State | Production (M bu) |
|---|---|---|
| 1 | ND | 21.2 |
| 2 | MN | 18.8 |
| 3 | SD | 15.6 |
| 4 | WI | 15.4 |
| 5 | IA | 10.8 |
| 6 | NE | 6.6 |
| 7 | PA | 6.5 |
| 8 | TX | 6.3 |
| 9 | MI | 5.2 |
| 10 | KS | 4.6 |
| 11 | IL | 4.4 |
State Oats Production – 2003
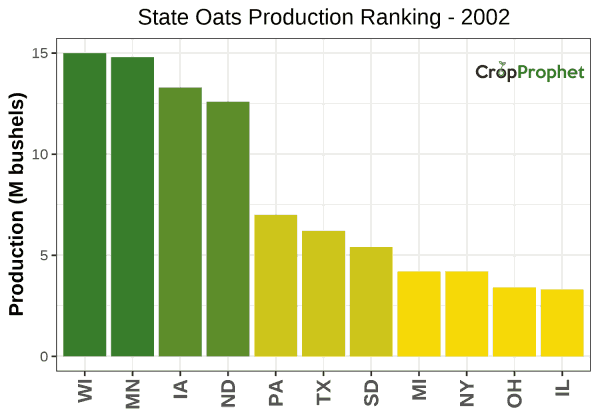
Oats Production by State: Top 11 of 2002
The top 11 oats-producing states (and their total production) of 2002 was:
| Production Rankings: 2002 | ||
| Rank | State | Production (M bu) |
|---|---|---|
| 1 | WI | 15.0 |
| 2 | MN | 14.8 |
| 3 | IA | 13.3 |
| 4 | ND | 12.6 |
| 5 | PA | 7.0 |
| 6 | TX | 6.2 |
| 7 | SD | 5.4 |
| 8 | MI | 4.2 |
| 8 | NY | 4.2 |
| 10 | OH | 3.4 |
| 11 | IL | 3.3 |
State Oats Production – 2002
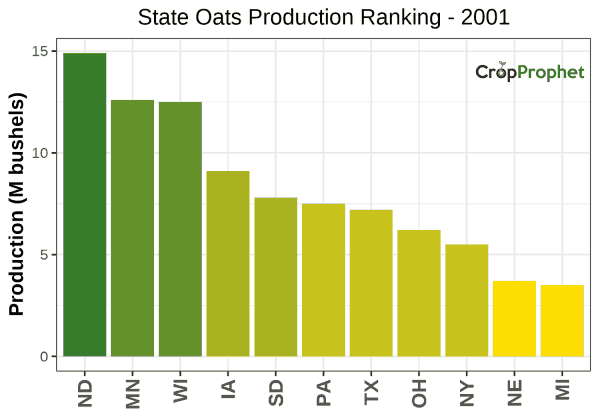
Oats Production by State: Top 11 of 2001
The top 11 oats-producing states (and their total production) of 2001 was:
| Production Rankings: 2001 | ||
| Rank | State | Production (M bu) |
|---|---|---|
| 1 | ND | 14.9 |
| 2 | MN | 12.6 |
| 3 | WI | 12.5 |
| 4 | IA | 9.1 |
| 5 | SD | 7.8 |
| 6 | PA | 7.5 |
| 7 | TX | 7.2 |
| 8 | OH | 6.2 |
| 9 | NY | 5.5 |
| 10 | NE | 3.7 |
| 11 | MI | 3.5 |
State Oats Production – 2001
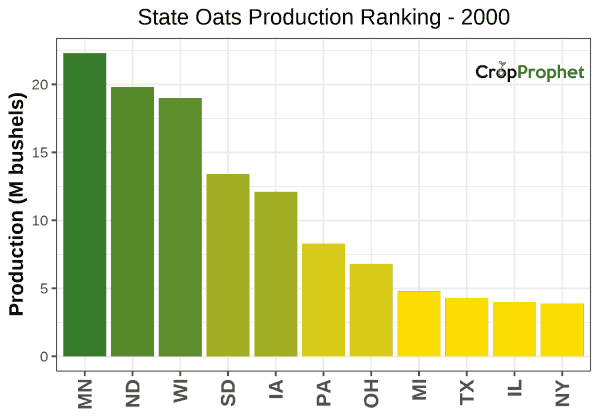
Oats Production by State: Top 11 of 2000
The top 11 oats-producing states (and their total production) of 2000 was:
| Production Rankings: 2000 | ||
| Rank | State | Production (M bu) |
|---|---|---|
| 1 | MN | 22.3 |
| 2 | ND | 19.8 |
| 3 | WI | 19.0 |
| 4 | SD | 13.4 |
| 5 | IA | 12.1 |
| 6 | PA | 8.3 |
| 7 | OH | 6.8 |
| 8 | MI | 4.8 |
| 9 | TX | 4.3 |
| 10 | IL | 4.0 |
| 11 | NY | 3.9 |
State Oats Production – 2000