CropProphet, which provides weather-based forecasts of grain yield and production, is created by Prescient Weather. We have a second product, called the World Climate Service (WCS), which is designed to support energy and commodity meteorologists and grain traders as they seek to improve not only their long-range forecasting process but also the communication of weather-related risk. WCS enables long-range forecasting backed by the best science available.
Midwest Heat Wave Possibilities
The current long-range forecast includes a few interesting signals that we highlight here. WCS allows for the comparison of dynamical weather forecast models that are run many days into the future. The ECMWF model, for example, is run to 46 days into the future on Mondays and Thursdays each week. We post-process this information to extract useful information about the probabilities of specific weather and climate events happening in the weeks ahead.
It’s well known that a deterministic forecast for a specific day many days in advance is not useful. Will the temperature in Iowa City on July 15th be 90 oF? We have no idea. Do temperatures in Iowa for the week between July 13th and July 19th have a greater than normal probability of being above average? Yes, according to the information below from WCS.
Statistical Forecast Support
The World Climate Service provides users access to long-range dynamical forecast models (i.e. weather forecast models), statistical models, and analog analysis tools. A statistical model is a prediction of future climate conditions based only on what has happened in the past, such as the most recent two to six weeks. Histories of weather data that span as much as 70 years into the past are used to find the statistical relationships that make up the past.
The WCS statistical forecast is called SubR. It placed first in the “Forecast Rodeo“, a long-range (“sub-seasonal”) forecasting contest held by the US Bureau of Reclamation. It uses what has occurred over the prior two to six weeks to predict climate variations three to six weeks into the future.
The SubR forecast as of June 29, 2020 is shown below.
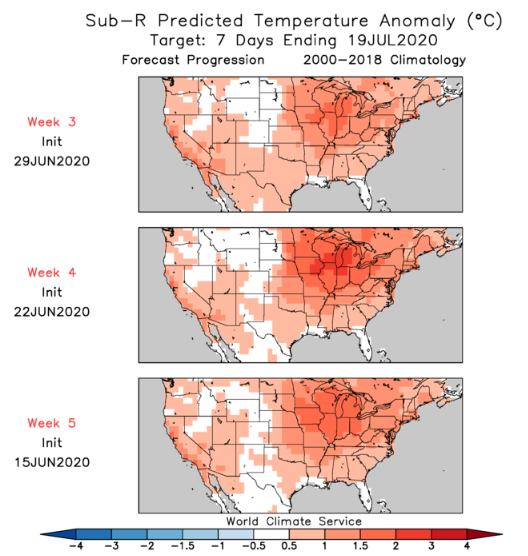
These maps show the progression of the forecast for the week ending July 19th, 2020, with the bottom map issued five weeks ahead, and the top map issued 3 weeks ahead. The forecast is remarkably consistent. This consistency is one signal of the likelihood of the forecast being correct.
SubR & MME
In research we have conducted regarding the accuracy of SubR, we discovered that when SubR and our multi-model ensemble (MME) dynamical forecasts have similar patterns, the dynamical model forecast is more reliable.
Looking at the current three week temperature forecast from SubR and the MME, we see some similarity in the patterns.
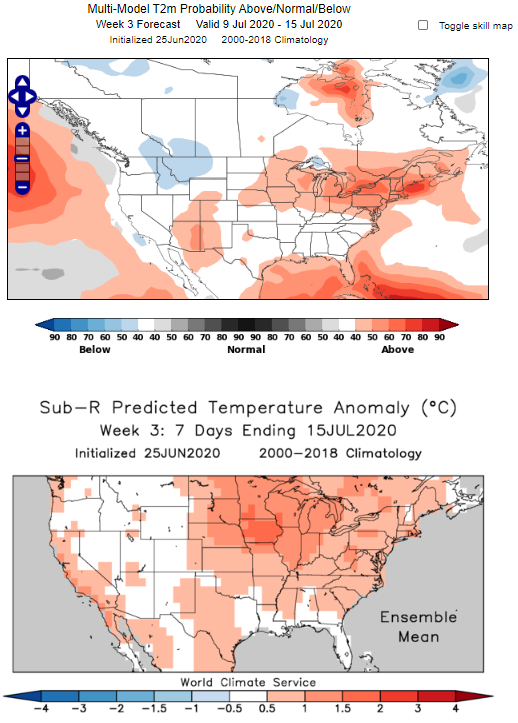
Note that the MME data (the top map) shows the probability of above-normal, near-normal, or below-normal temperatures occurring. It’s a probabilistic forecast because the dates are too far into the future for a deterministic forecast (i.e. a forecast for a specific temperature on a day that’s two or more weeks into the future).
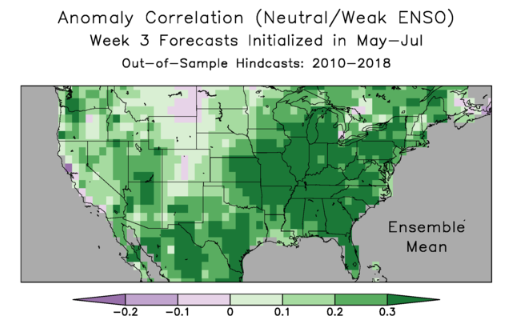
SubR Skill
Mid-summer also happens to be the time of year when SubR skill is at its greatest in the Midwest of the US.
MME Forecast Progression
Just as we can review the forecast progression of SubR, we can also look at the dynamical model forecast progression.
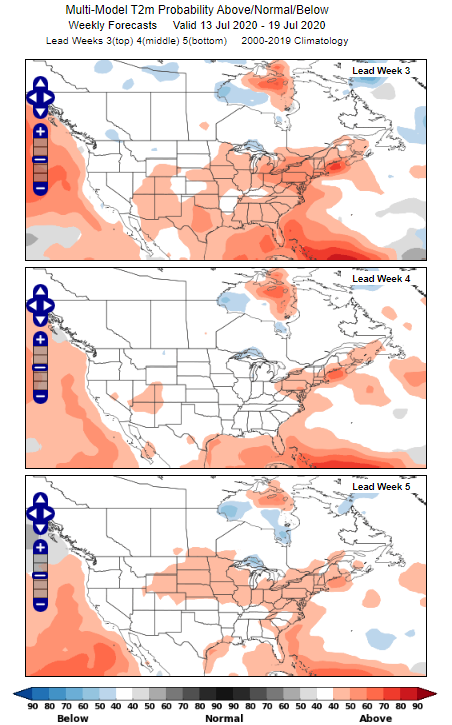
As the analysis shows, the week five forecast included a 40-50% chance of significantly greater than normal temperatures in the Midwest. This probability signal faded for the week 4 forecast but reemerged for the week 3 forecast.
Summary: Signals of a Midwest Heat Wave
Long-range forecasting is hard. A user of long-range forecasts looking for trading opportunities has to interpret a wide range of information to estimate the probability of a specific event occurring. In this case, we are looking at the likelihood of a heatwave occurring in mid-July in the US Midwest. Our science-driven tools tell us:
- The statistical forecast indicates a heat wave event is relatively likely. In this case, the warmer than normal temperatures occurring now in the Midwest are likely to continue, according to SubR.
- The multi-model dynamical forecast analysis suggests higher than normal probabilities of warmer than normal conditions in mid-July.
- Our research indicates that when SubR and the MME broadly agree over a targeted region, the MME reliability increases.
- Summer is the season of peak accuracy for SubR.
These signals suggest an enhanced likelihood of a Midwestern heatwave. Subsequent forecast updates will provide important refinements of forecast confidence, and it is important to bear in mind that long-range forecasts are best interpreted in probability terms. While it is unlikely, it is still possible that the opposite outcome (cooler than normal, in this case) could occur; but the best information available points towards warmer than normal conditions happening in the US Midwest between July 13th and July 19th.