2025 US Corn Belt Precipitation vs 2024: Drier Eastern Corn belt, Wetter Western Corn Belt
Comparing 2025 Precipitation in the Corn Belt to 2024
There are a lot of comparisons of 2025 post silking precipitation to 2024. Figure 1 shows a substantial difference exists between the 2025 US corn belt precipitation and the 2024 US corn belt precipitation.
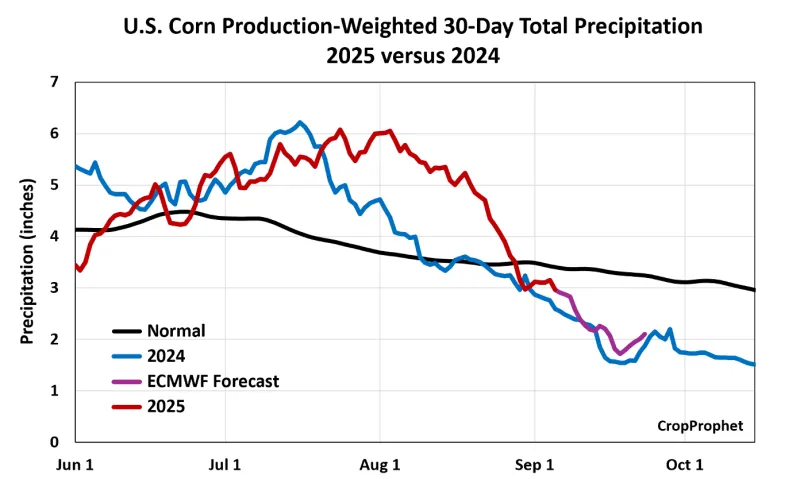
Figure 1. U.S. corn production-weighted 30-day total precipitation (inches) showing 2025 versus 2024.
Comparing the Evolution of the 2025 Precipitation in the Corn Belt to 2024
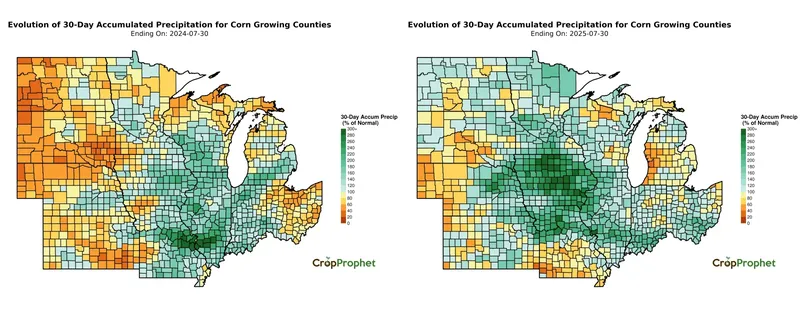
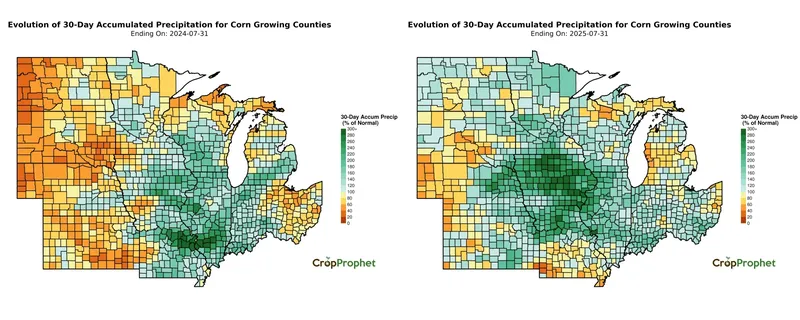
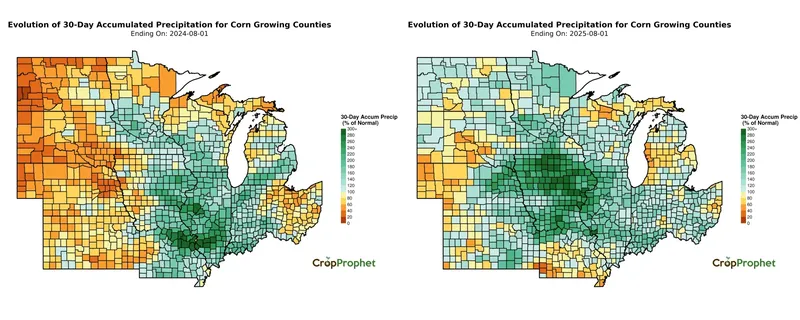
The figures below compare precipitation in 2025 with 2024. They track the day-by-day evolution of 30-day accumulated precipitation across Corn Belt growing counties from July 1 through September 11. For each date, the map on the left shows 2024 and the map on the right shows 2025.
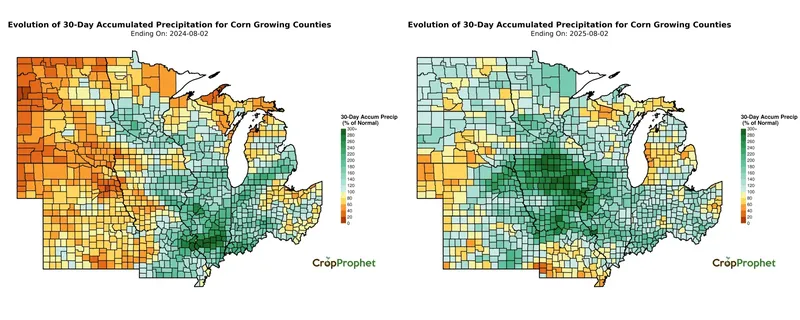
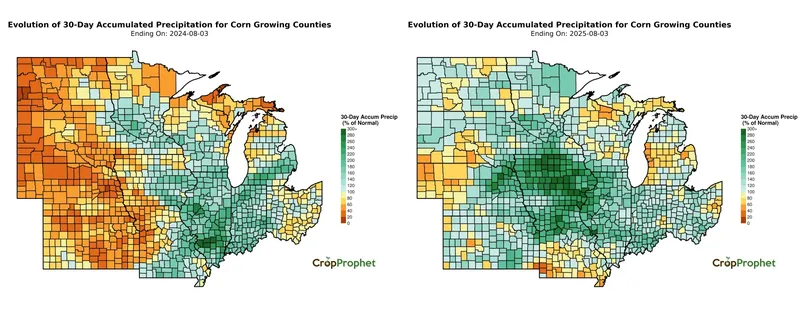
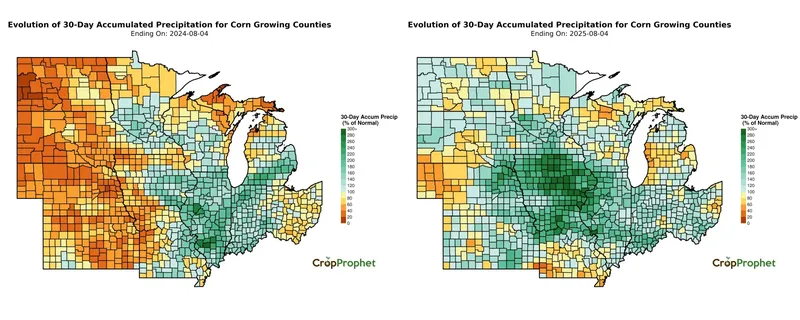
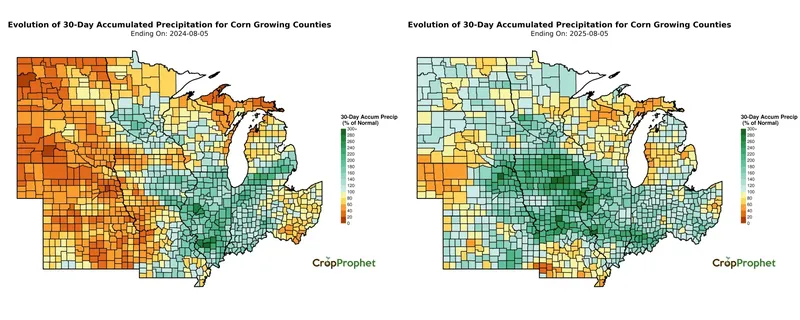
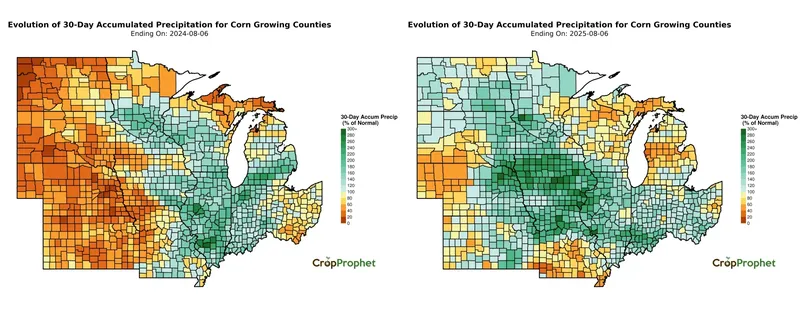
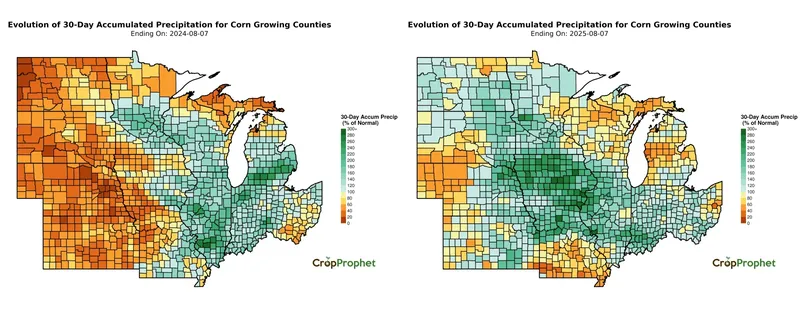
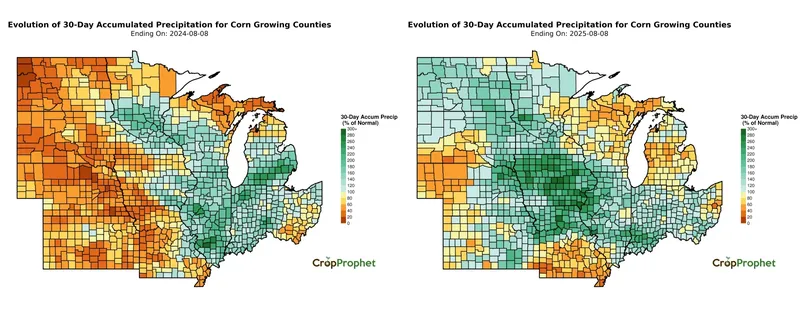
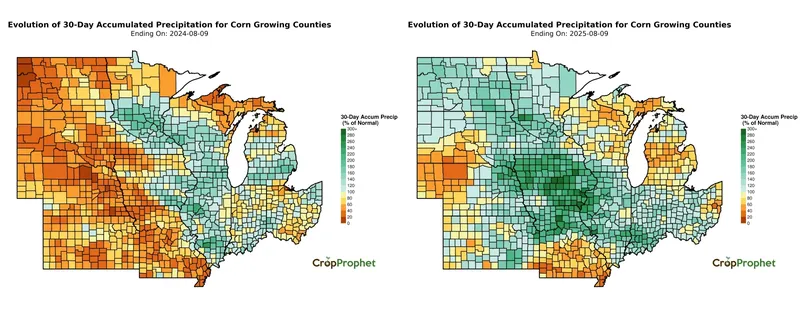
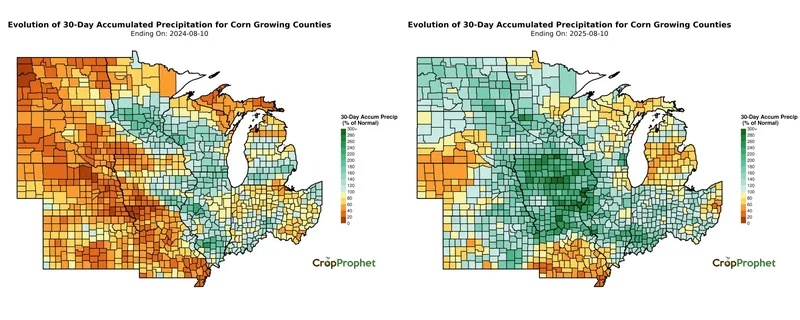
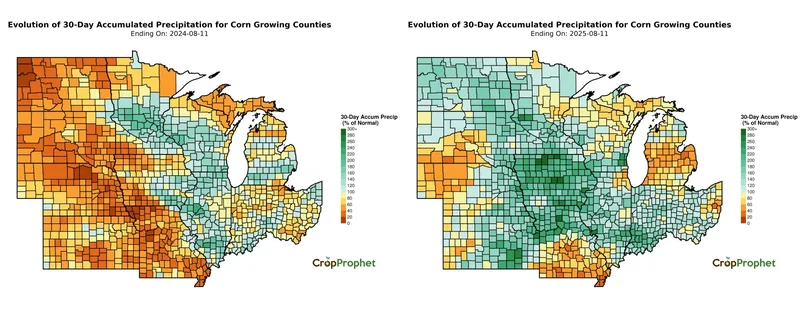
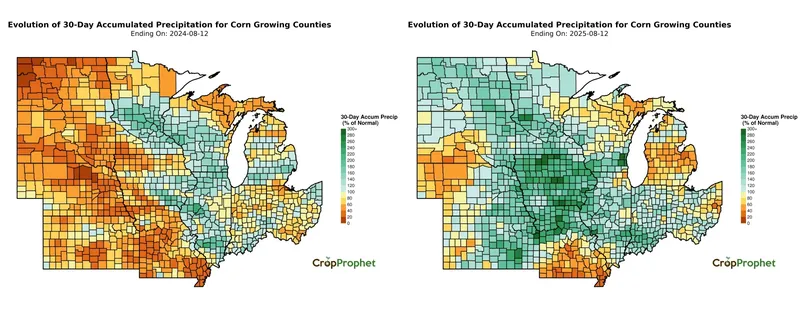
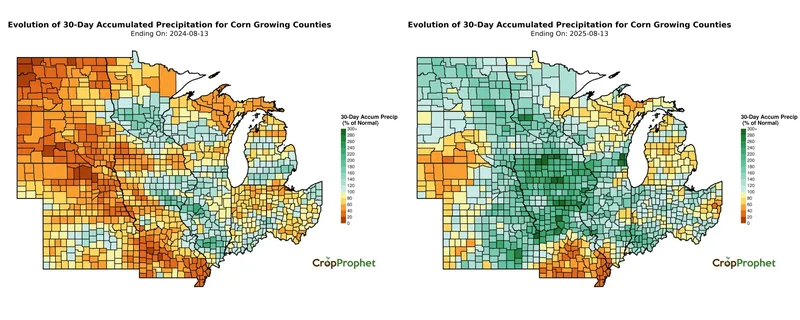
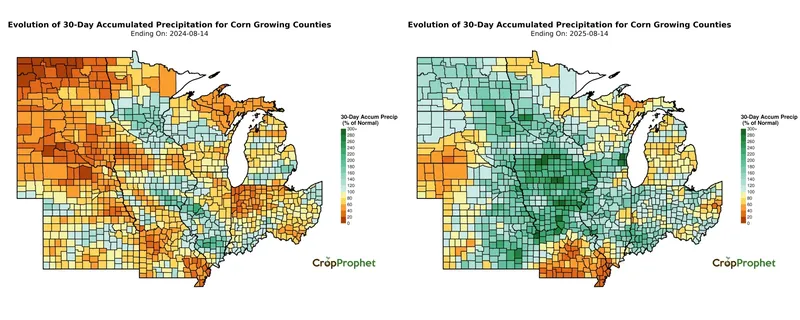

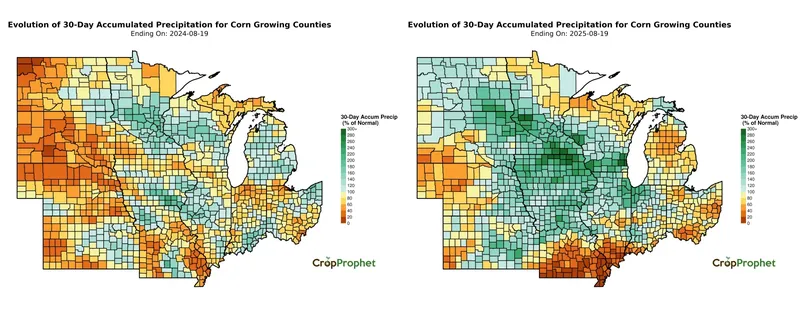
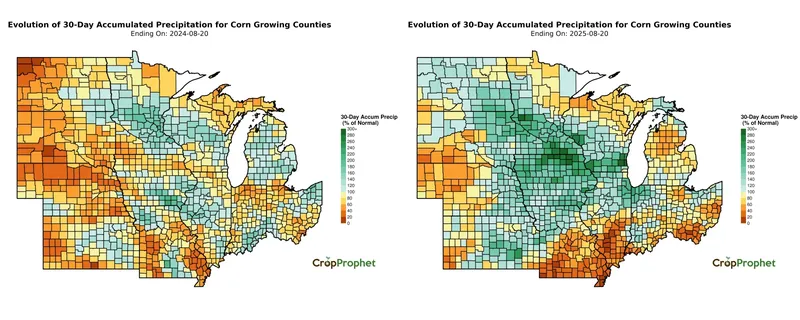
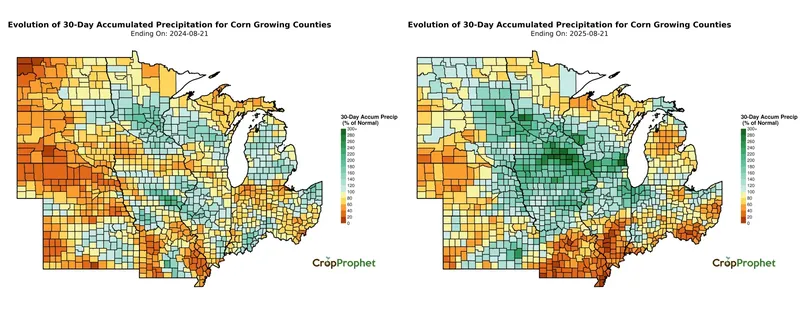
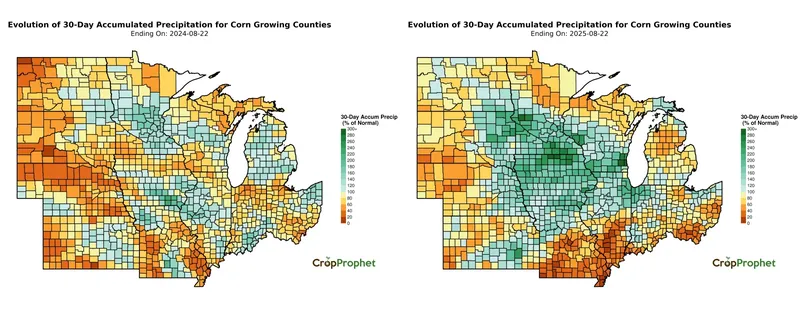
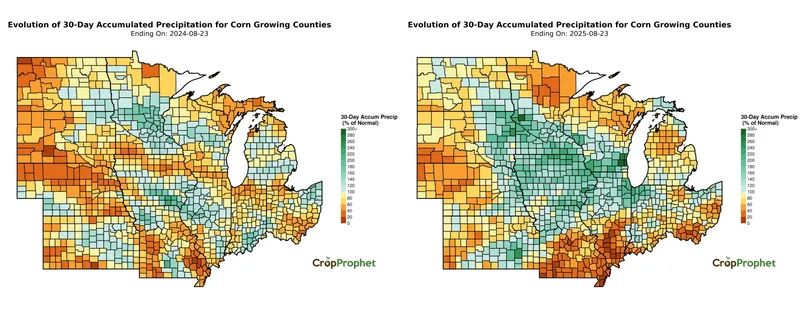
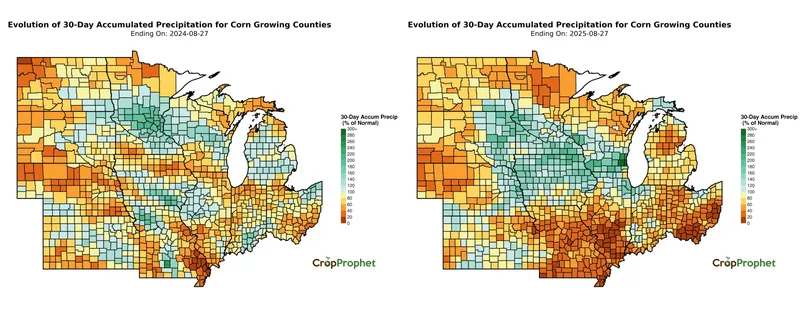
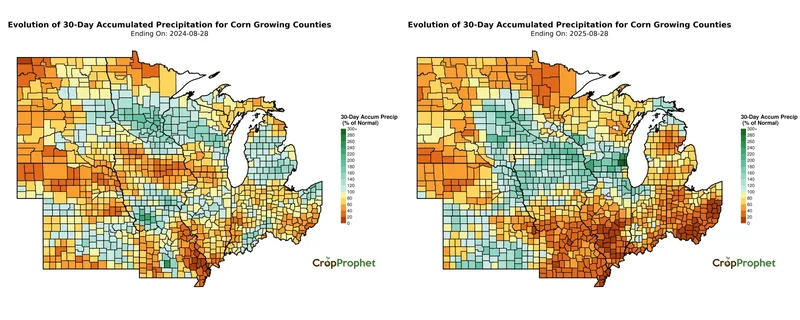
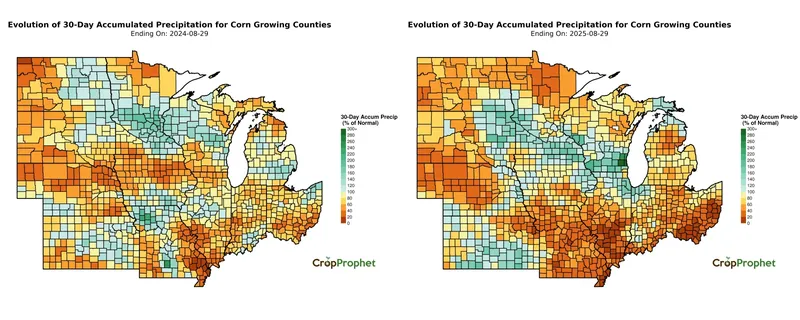
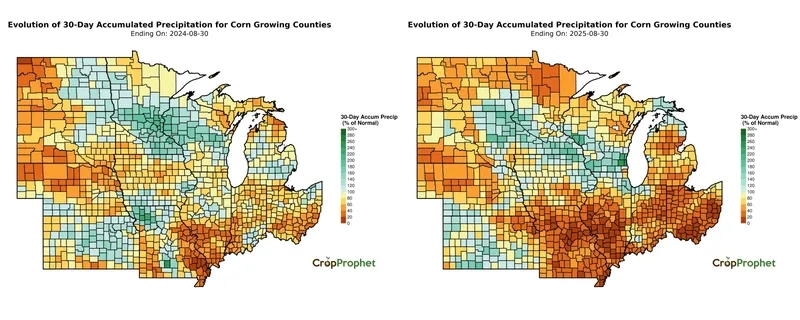
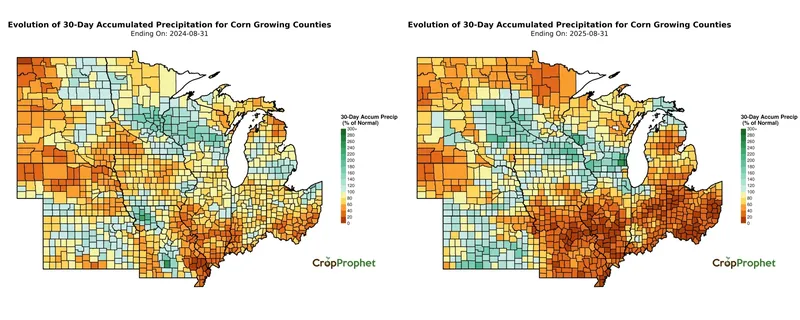
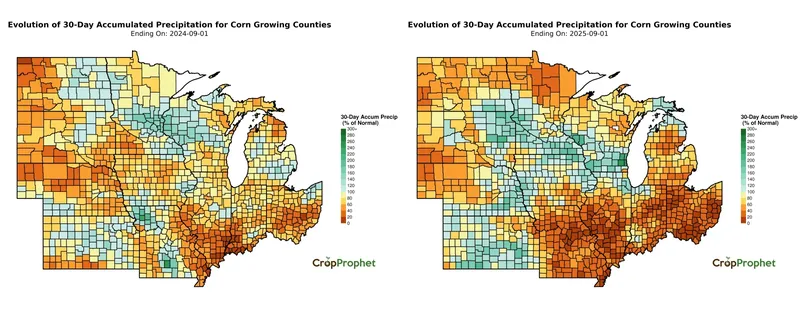
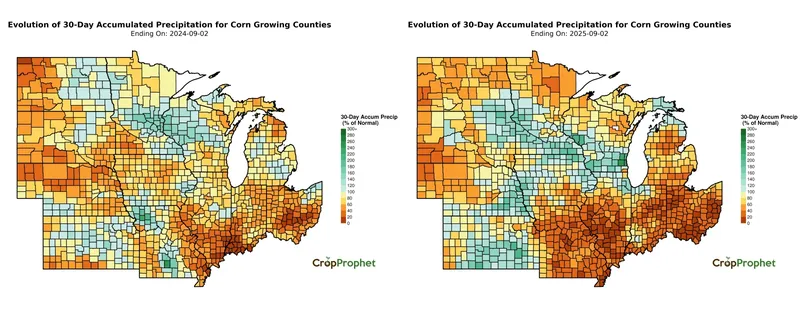
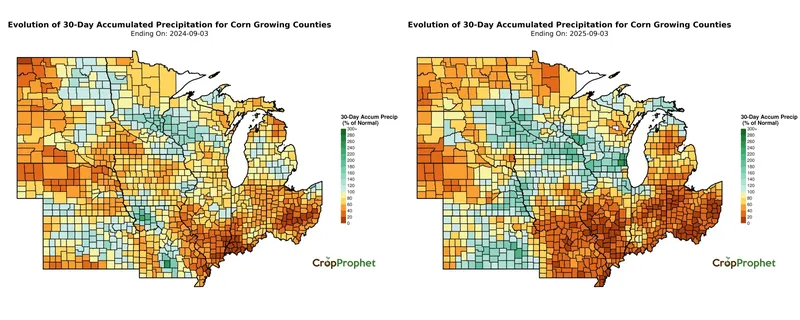
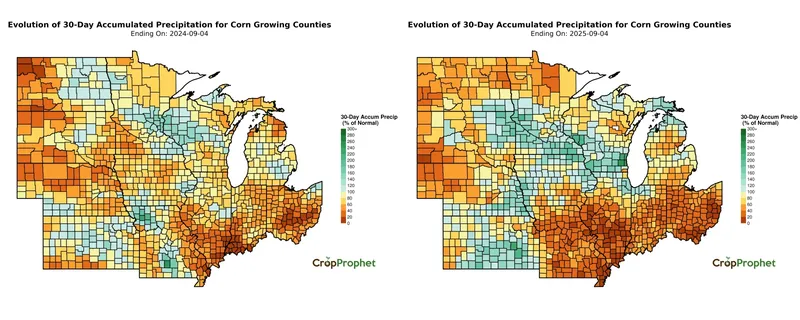
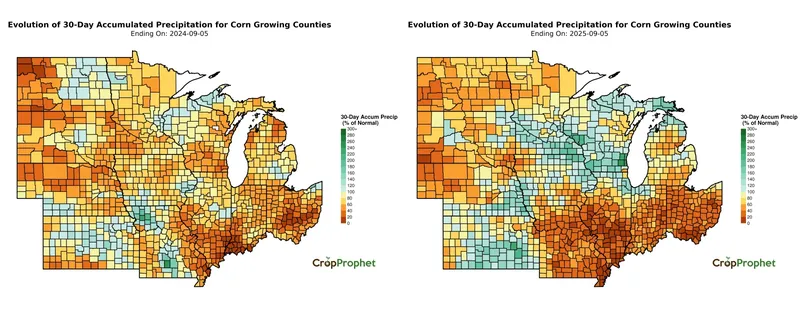
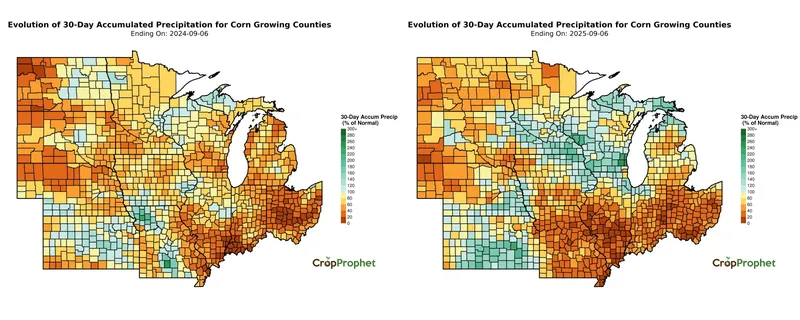
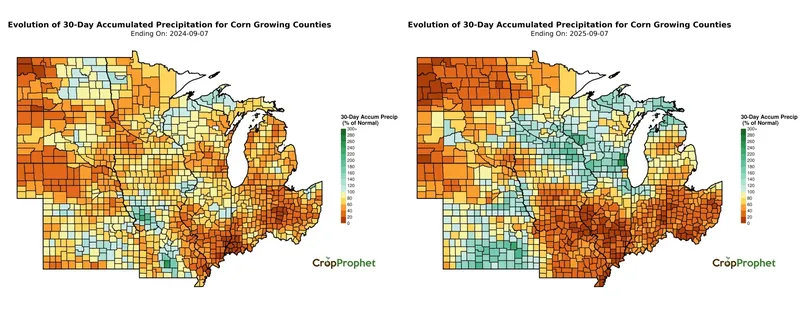
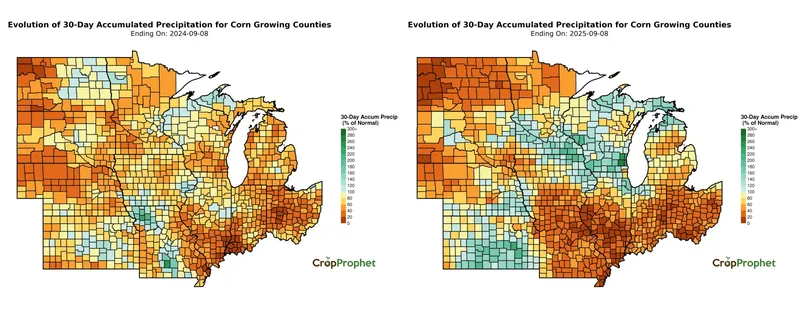
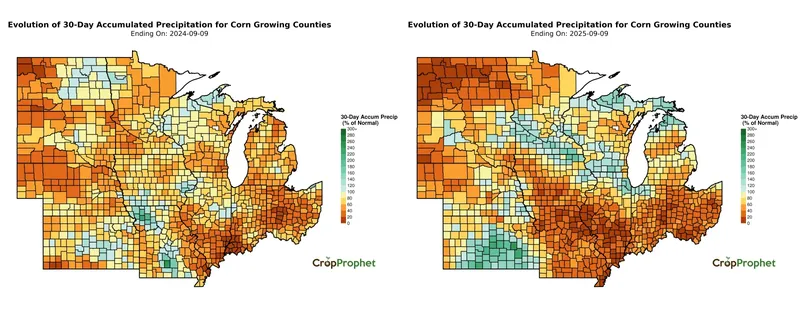

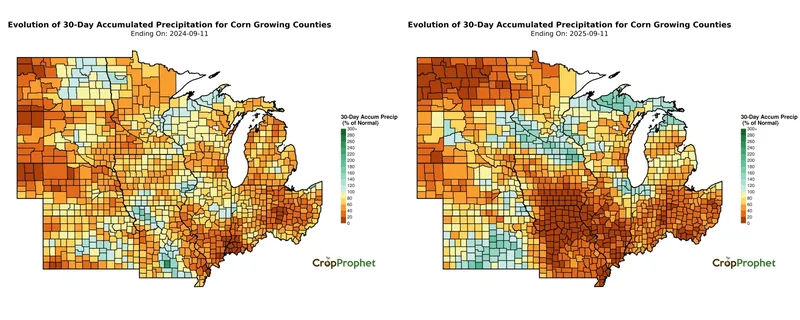
2025 vs 2024: Where and When Corn-Belt Rainfall Differs
The 30-day corn production-weighted precipitation in 2025 tracks near or above 2024 through July, then drops quickly from mid- to late August, converging with 2024 by early September (Figure 1).
Figure 2 highlights the geographic contrast. In 2025, dryness concentrates in the eastern Corn Belt and Missouri: Illinois (42), Indiana (42), Ohio (45), and Missouri (43) rank among the driest in the 1981–2025 record while parts of the Upper Midwest rank wetter (Nebraska 11, North Dakota 12, South Dakota 14, Minnesota 17, Wisconsin 18). In 2024, more states fall into drier rankings overall, but the values cluster in the low- to mid-30s, indicating broader yet less extreme dryness.
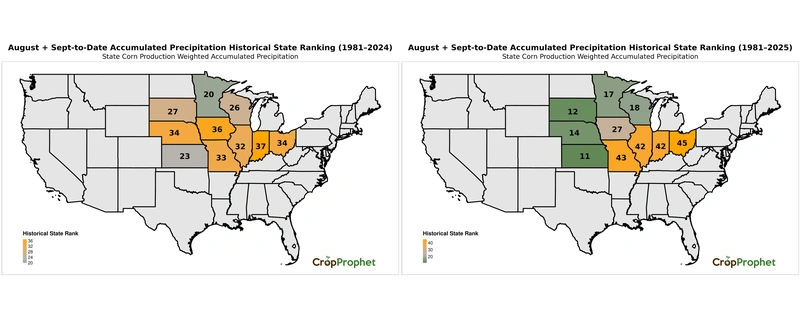
Figure 2. 2024 versus 2025 August + September-to-date accumulated precipitation historical state ranking (corn production-weighted).