“Bad Weather Could Hurt Soybean Crops”
A December 23, 2020, Barrons article, with the title “Bad Weather Could Hurt Soybean Crops” discusses the possibility of a dry January and February 2021 in Brazil negatively impacting soybean yields and production. The ongoing La Niña event is likely to impact crops this year and season-to-date conditions are dry. The article quotes a meteorologist as saying, “In years of low solar activity and La Niña, it tends to be dry,” referring to weather conditions in Brazil.
The article continues by quoting Shawn Hackett, president of Hackett Financial Advisors, as saying “much-needed rain will likely soon give way to more drought and could irreparably damage the crop in January and February.”
This post examines Brazil and Argentina’s conditions during January, February, and March during La Niña events and periods of low solar activity using a technique called analog forecasting.
What are Sunpots?
According to NASA, Sunspots are “areas that appear dark on the surface of the Sun. They appear dark because they are cooler than other parts of the Sun’s surface.” Sunspot activity is measured using a metric called the sunspot number. It measures the number of spots on the sun. https://www.spaceweather.com reports this is not a straightforward process (imagine the difficulty of picking out spots on the sun), but it’s not only possible but is accomplished by several observatories around the world. The graphic below shows the “International Sunspots Number” as reported by the Solar Influences Data Center in Belgium.
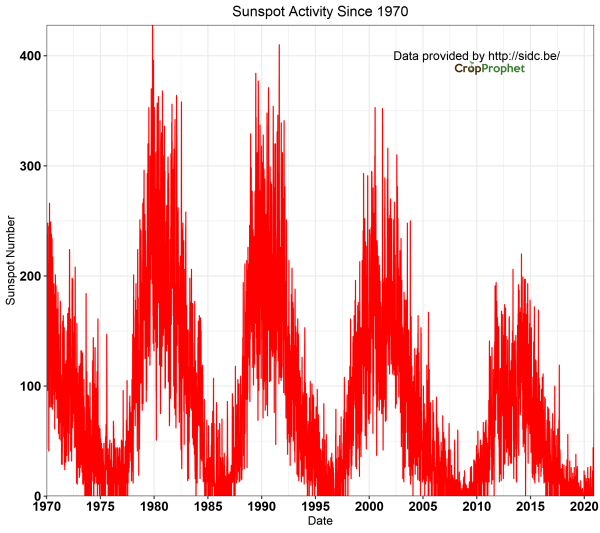
The data shows the last few years have been at or near a sunspot minimum.
Analog Forecasting South American Precipitation
To examine the validity of the quotes from the Barron’s article, we turn to the World Climate Service, a climate analysis tool created by Prescient Weather in addition to CropProphet. The World Climate Service enables, among other climate forecasting techniques, analog analysis and forecasting.
What is analog forecasting?
Analog forecasting is a methodology to find weather and climate conditions that are similar to today’s conditions. For example, La Niña events from the past and the climate that occurred during them are used to understand their impacts. Thus, the evolution of the climate that occurred in the past likely contains useful information regarding what may happen in the future from today.
In this example, we search for prior year’s January, February, and March during which there were:
- La Niña Events
- Low sunspot activity, and
- Both a La Niña event and low sunspot activity
We examine the precipitation during prior years for these scenarios to shed light on likely climate outcomes in Brazil and Argentina during early 2021.
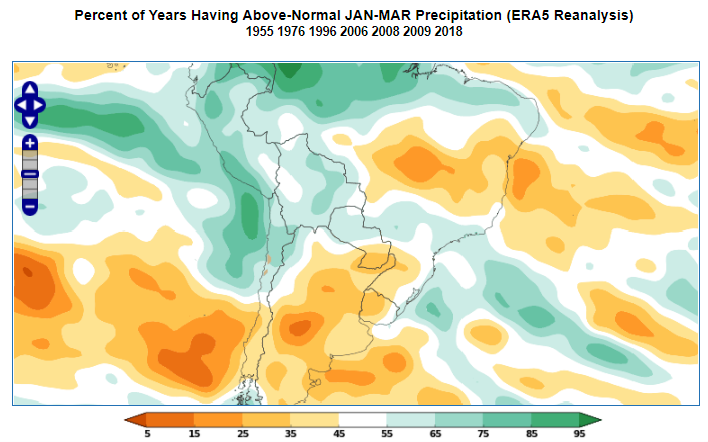
Analog Forecast for Brazil and Argentina: La Niña Events
The analog precipitation forecast for January, February, March (JFM) 2021 for Brazil and Argentina. There are a few important points to note.
The first is the years that match our criteria of years with a La Niña event are showing the graphic. In this case, 20 years since 1950 were selected. The second is a probability map, not an anomaly map. The information depicted shows the percentage of years that had above-normal precipitation. The green areas are more likely to experience above-normal precipitation. The brown areas are more likely to experience drier than normal conditions.
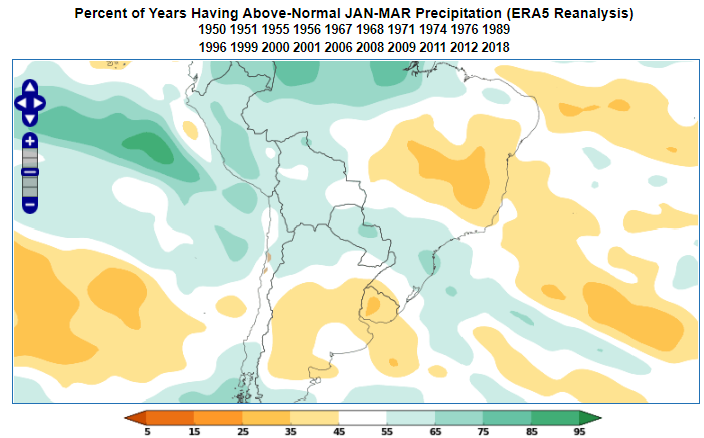
We can conclude from this analysis that Brazil and Argentina’s key growing regions are likely to be drier than normal during JFM during a La Niña event.
Analog Forecast for Brazil and Argentina: Low Sunspot Activity years
The World Climate Service tool allows us to replicate the analysis by changing a simple pull-down menu. The analysis below shows the average impact of low sunspot activity on South American climate.
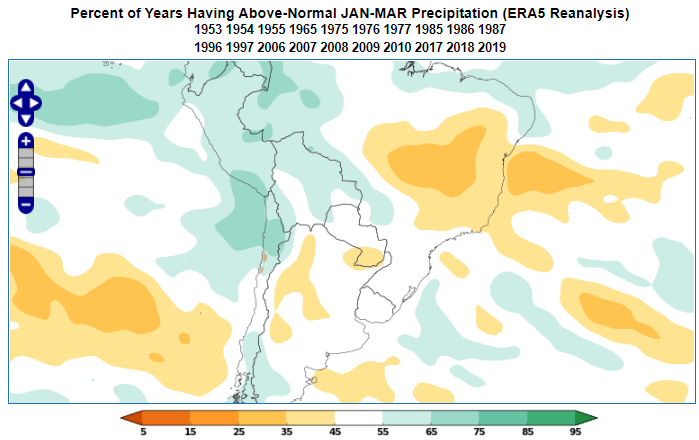
Interestingly, the pattern is broadly similar to the La Niña analog forecast.
Analog Forecast for Brazil and Argentina: La Niña and Low Sunspot Activity
The World Climate Service also allows the user to combine several indices to create multi-climate index analog analyses.
Since the individual La Niña and sunspot activity maps are broadly similar, it’s not surprising to see the combined La Niña/sunspot activity precipitation analog forecast map pattern is the same, but the probabilities are enhanced. Indeed, the Barron’s article correctly suggests that low solar activity and La Niña tend to generate broadly drier conditions in key crop-growing regions during JFM.
For this discussion, we looked at the time period averaged from January to the end of March. It’s also possible to break out individual months. Doing so raises an interesting possibility for Argentina’s precipitation during February 2021.
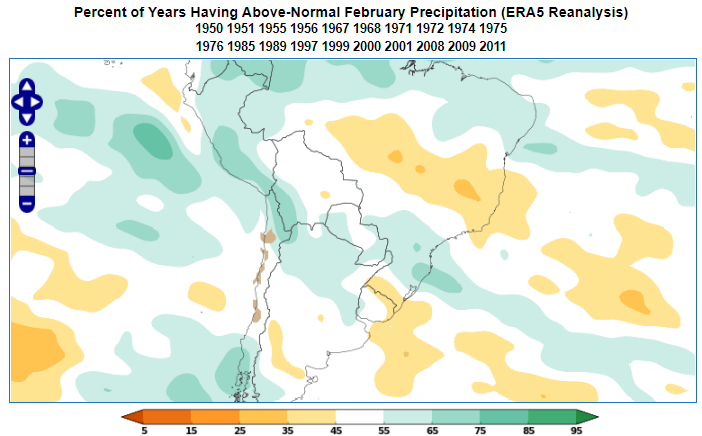
Analog Forecast: Focus on February
We continue our analysis by looking at the impact of our climate indices during February.
February Analog Forecast: La Niña
The search criteria for our analog forecasts is now narrowed to February. The search finds prior Februarys during La Niña events. The resulting climate impact is shown below. Central Brazil is still indicating increased probabilities of drier than normal conditions, but northern Argentina indicates the higher chances of above-normal precipitation.
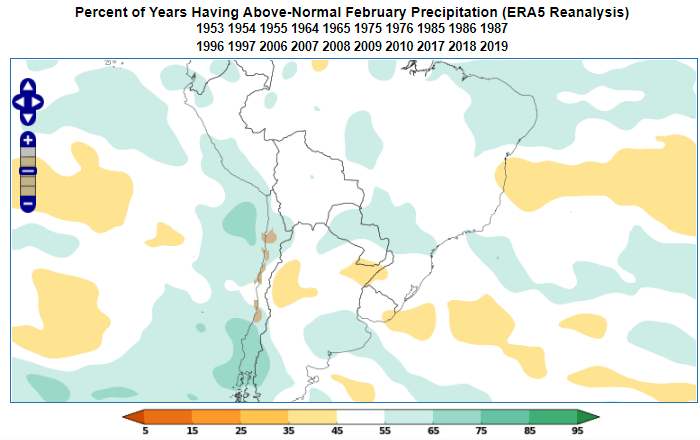
February Analog Forecast: Low Sunspot Activity
The impact of February low solar activity during that month’s climate is weaker. No strong probability signal stands out.
February Analog Forecast: La Niña and Low Sunspot Activity
Interestingly, the analog for February for the combination of La Niña and low sunspot activity remains dry for key crop regions in Brazil. In Argentina, however, much of the countries crop-growing regions are highlighted by increased probabilities of above-normal precipitation.
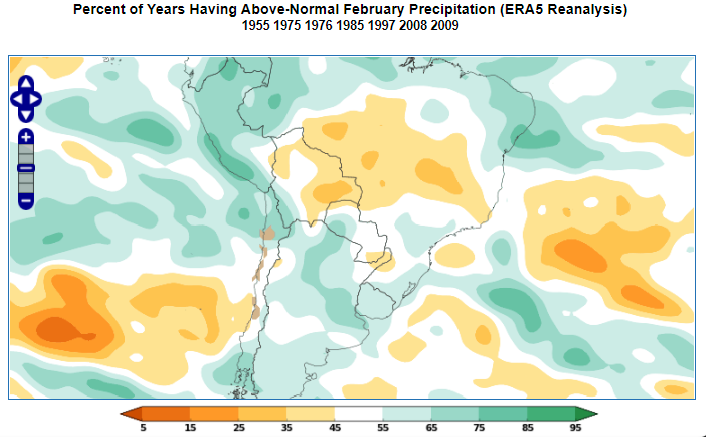
Could Argentina receive much-needed precipitation during February? This analog forecast certainly suggests it’s a possibility. While Brazil is the #1 Soybean producer in the world, Argentina is a strong #3. If the scenario of a generally wetter February in Argentina while Brazil remains dry plays out, the Argentina crop would benefit. This would potentially ameliorate but not eliminate global soybean supply concerns.
The analysis provided, however, has its own risks. The individual La Niña and sunspot activity selected a relatively large number of years. The combined analysis selects only 7 years, however. The February map shown above may not be statistically significant, suggesting the information should be digested with some caution.
CropProphet quantifies the impact of weather on grain crops. In December of 2020, we extended our weather-driven corn and soybean yield forecast capability by adding Argentina. Use CropProphet to understand the impact of weather on grains better. Request your trial today.